. 2018 May;30(5):986-1005.
doi: 10.1105/tpc.17.00854. Epub 2018 Apr 4.

The YTH Domain Protein ECT2 Is an m6A Reader Required for Normal Trichome Branching in Arabidopsis

Affiliations

The YTH Domain Protein ECT2 Is an m6A Reader Required for Normal Trichome Branching in Arabidopsis

Jérémy Scutenaire et al. Plant Cell. 2018 May.

Abstract

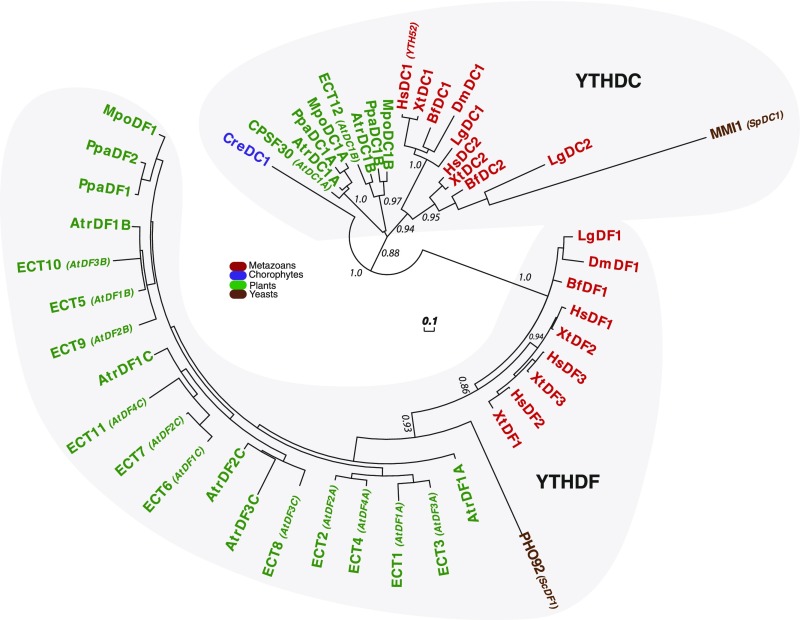
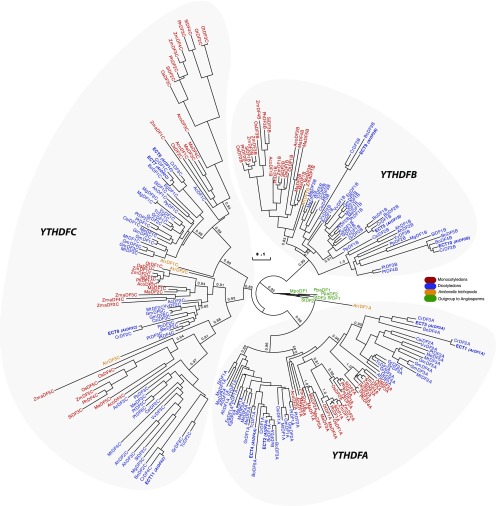
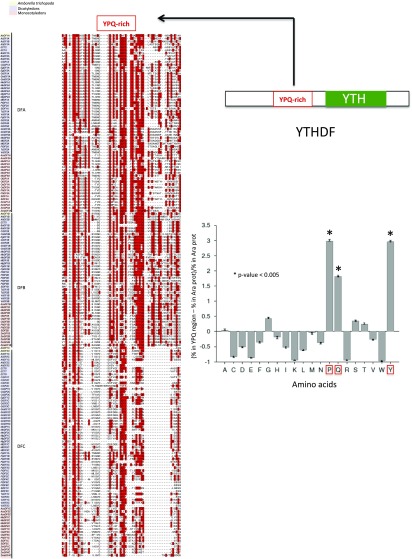
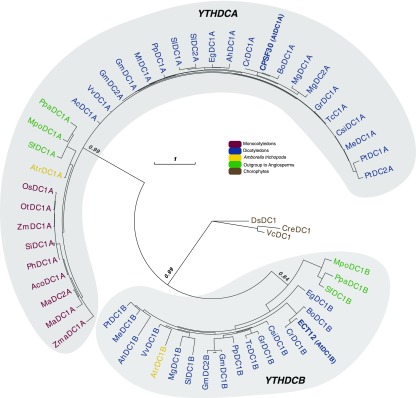
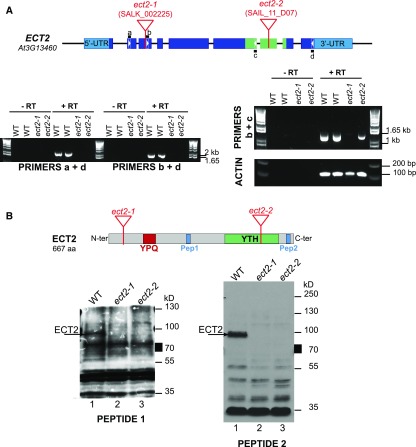
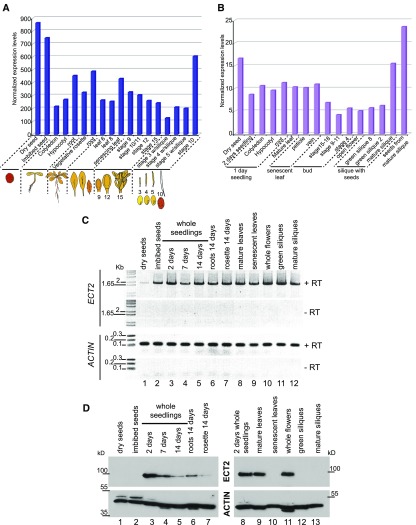
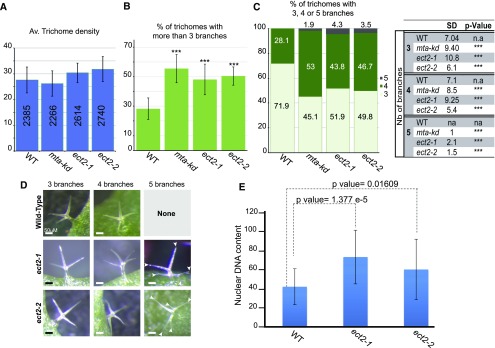
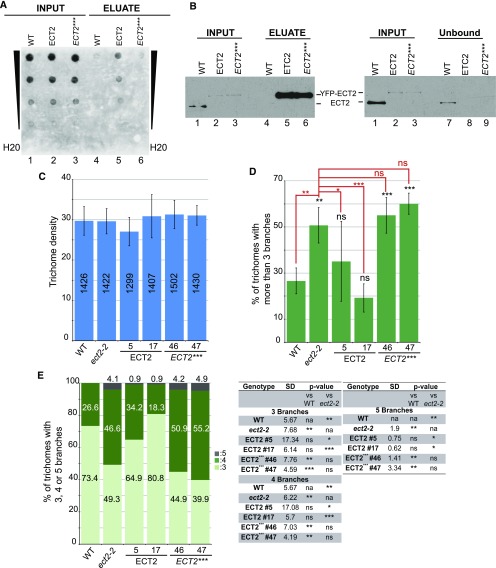
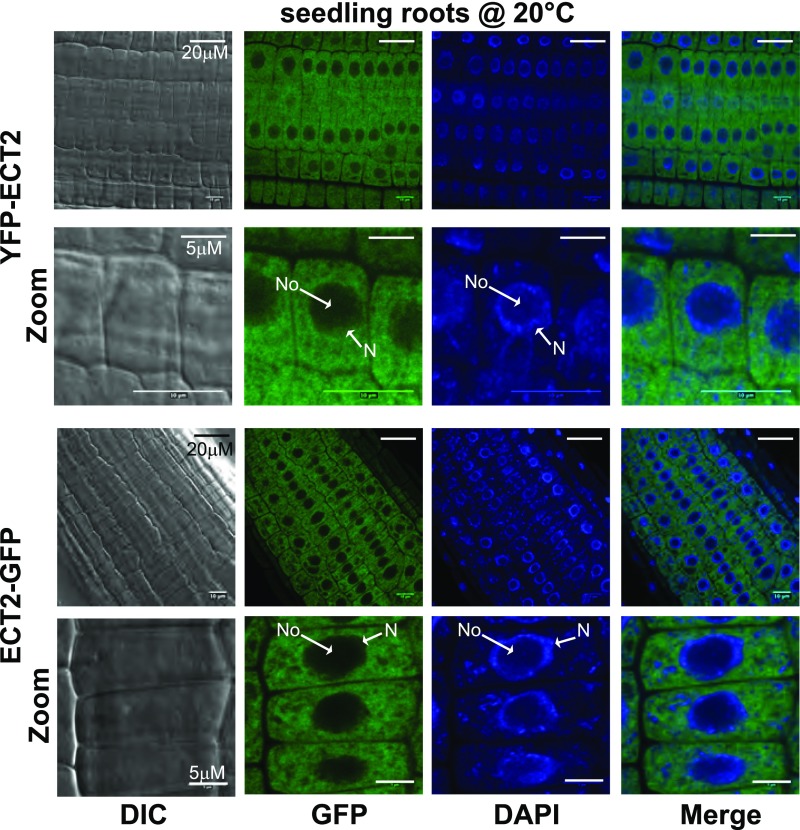
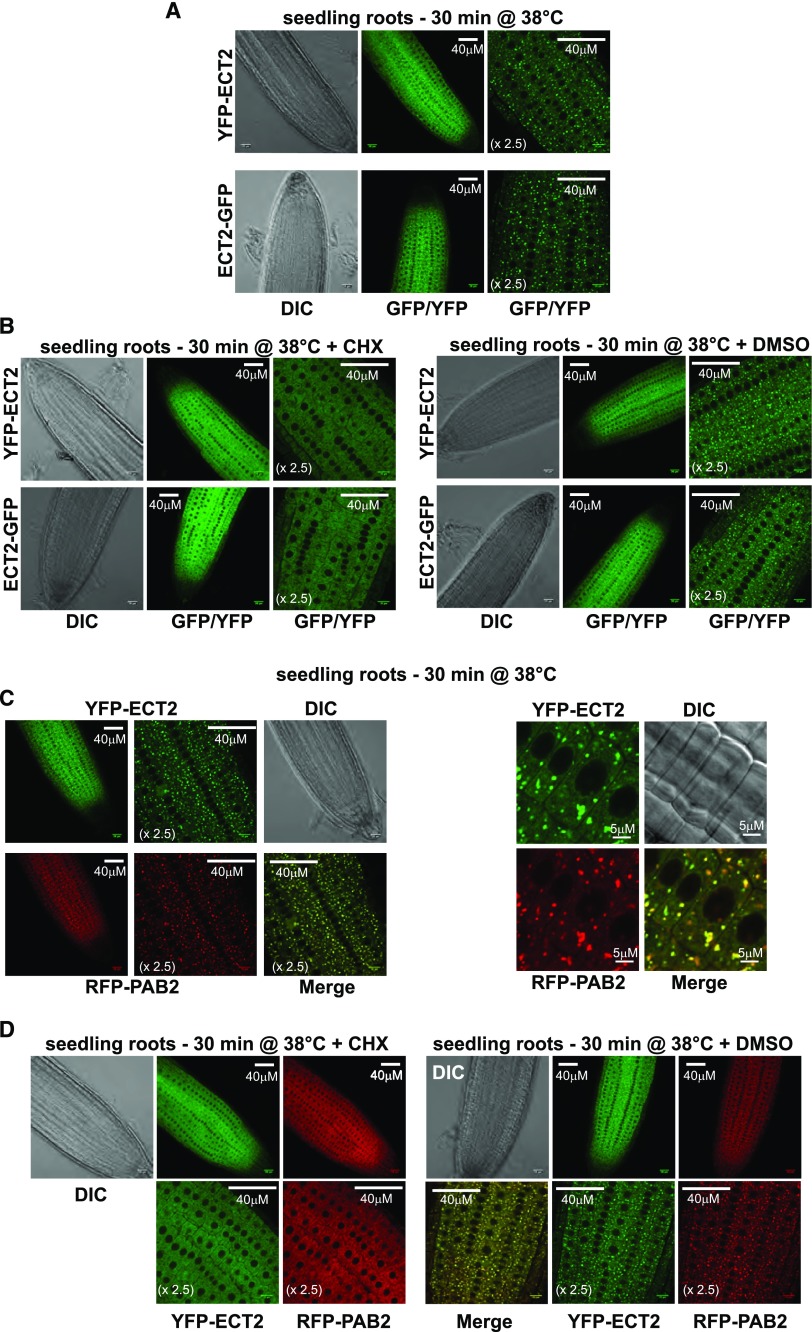
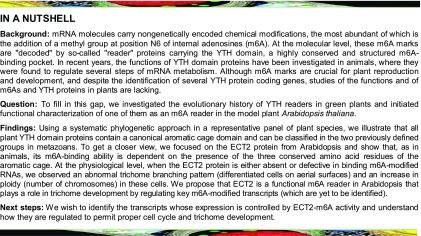
Methylations at position N6 of internal adenosines (m6As) are the most abundant and widespread mRNA modifications. These modifications play crucial roles in reproduction, growth, and development by controlling gene expression patterns at the posttranscriptional level. Their function is decoded by readers that share the YTH domain, which forms a hydrophobic pocket that directly accommodates the m6A residues. While the physiological and molecular functions of YTH readers have been extensively studied in animals, little is known about plant readers, even though m6As are crucial for plant survival and development. Viridiplantae contains high numbers of YTH domain proteins. Here, we performed comprehensive evolutionary analysis of YTH domain proteins and demonstrated that they are highly likely to be actual readers with redundant as well as specific functions. We also show that the ECT2 protein from Arabidopsis thaliana binds to m6A-containing RNAs in vivo and that this property relies on the m6A binding pocket carried by its YTH domain. ECT2 is cytoplasmic and relocates to stress granules upon heat exposure, suggesting that it controls mRNA fate in the cytosol. Finally, we demonstrate that ECT2 acts to decode the m6A signal in the trichome and is required for their normal branching through controlling their ploidy levels.


Figures

Figure 1.
Figure 1.
Phylogenetic Relationships among Viridiplantae, Metazoan, and Yeast Core (β1 to α3) YTH Domains. The phylogenetic tree was built using representative YTH motifs from Viridiplantae compared with several yeast and metazoan YTHs, including those from human, fruit fly, the yeast S. cerevisiae, and the fission yeast S. pombe (see Supplemental Data Set 1 for YTH sequences and for a list of name codes and Supplemental Figure 1 for the alignment used to build the tree). The two clades, YTHDF and YTHDC, are indicated. The color code is as follows: brown for yeast species, green for plant species, blue for chlorophyte species, and red for metazoan species. Statistical supports of key nodes that are important for our argumentation, calculated with the approximate likelihood-ratio test (aLRT), are indicated. The scale bar indicates a length of 0.1 substitution per site.
Figure 2.
Figure 2.
Phylogenetic Relationships among Plant YTHDF Proteins. The phylogenetic tree was built using the YTH domain of 240 DF proteins from 29 species representing the diversity of the Viridiplantae lineage (see Supplemental Data Set 1 for YTH sequences and for a list of name codes and Supplemental Figure 2 for the alignment used to build the tree). The three clades, DFA, DFB, DFC, are indicated. The color code is as follows: green for outgroup species to angiosperms, orange for A. trichopoda, blue for dicotyledon species, and dark red for monocotyledon species. Statistical supports of key nodes that are important for our argumentation, calculated with the aLRT, are indicated. The scale bar indicates a length of 0.1 substitutions per site.
Figure 3.
Figure 3.
Identification of a YPQ-Rich Region in Plant YTHDF Proteins. Alignment of the YPQ-rich region present in most plant YTHDF proteins. The three amino acids are highlighted in red. The histogram shows the bias in composition of the YPQ-rich region compared with all Arabidopsis proteins. The y axis represents the proportion of each amino acid in the YPQ-rich region compared with a database of all Arabidopsis proteins. The YPQ amino acids are statistically (P < 0.005) overrepresented in this region. Statistical significance associated with a specific enrichment or depletion is estimated using the two-sample t test including a Bonferroni correction according to the Composition Profiler website (http://www.cprofiler.org).
Figure 4.
Figure 4.
Phylogenetic Relationships among Plant YTHDC Proteins. The phylogenetic tree was built using 57 YTHDC proteins from 32 species representing the diversity of the Viridiplantae lineage (see Supplemental Data Set 1 for YTH sequences and for a list of name codes and Supplemental Figure 3 for the alignment used to build the tree). The two clades, DCA and DCB, are indicated. The color code is as follows: brown for chlorophyte species, green for outgroup species to angiosperms, yellow for A. trichopoda, blue for dicotyledon species, and dark red for monocotyledon species. Statistical supports of key nodes that are important for our argumentation, calculated with the aLRT, are indicated. The scale bar indicates a length of one substitution per site.
Figure 5.
Figure 5.
Characterization of Two ECT2 Insertion Mutants. (A) RT-PCR analyses of steady-state levels of ECT2 mRNA in wild-type (WT), ect2-1 (SALK_002225), and ect2-2 (SAIL_11_D07) seedlings. The top panel shows a schematic representation of the ECT2 genomic locus; boxes represent exons, with light blue corresponding to untranslated regions (UTR) and dark blue to coding regions. In addition, green boxes label the region coding for the ECT2 YTH domain. The positions of primers used for the PCR assays are reported as well as the T-DNA insertion sites in ect2-1 and ect2-2. (B) Protein gel blot analyses of steady-state levels of ECT2 protein in wild-type, ect2-1, and ect2-2 plants. Custom-made antibodies raised against a centrally (pep1, pos. 281 to 295) and a C-terminally (pep2, pos. 642 to 656) located peptide, respectively, were used.
Figure 6.
Figure 6.
ECT2 Has a Tissue-Specific Expression Profile. (A) and (B) ECT2 mRNA expression levels across plant development. Data were selected from publicly available databases at the eFP browser (microarray) (A) and TraVA db (RNA-seq) (B). (C) RT-PCR monitoring of ECT2 mRNA levels across development; primers a and d (Figure 5A) were used for reverse transcription. ACTIN mRNA was used as a control. RNAs were prepared from the same tissues as those used for protein gel blot analysis in (D). (D) Protein gel blot analyses of ECT2 steady-state levels across development and in various tissues. Sample tissue from 2-d-old whole seedlings was used as a reference and loaded on both gels 1 (left) and 2 (right) (lanes 3 and 8). ACTIN levels were used as a loading control.
Figure 7.
Figure 7.
ECT2 Is Required for Normal Trichome Branching and Ploidy Levels. (A) to (C) Histogram representation of the average trichome density per leaf (A), the percentage of trichomes with more than three branches (B), and the percentage of trichomes with three (light green), four (green), and five branches (dark green) (C) in wild-type (WT), mta knockdown (mta-kd), and ect2-1 and ect2-2 lof lines. sd values were calculated from 11 biological replicates (one biological replicate corresponds to the analysis of four plants of each genotype sown and grown together and issued from seed stocks harvested at the same time and stored together). P values were obtained using Dunnett’s test to determine whether mutant values are statistically distinct from wild-type values (***P < 10E-4). The table in (C) reports the sd and P values related to the values represented in the histogram shown in (C). na, not applicable. (D) Representative photographs of each type of trichome observed in each genotype. Bars = 50 μm. (E) Histogram representation of the average DNA content of trichomes with three branches in the wild type and trichomes with four branches in ect2 mutants. DNA content was calculated based on the fluorescence intensity of guard cells that are known to have a 2C content. sd was calculated from three biological replicates. P values were calculated with Student’s t test to determine whether mutant values are statistically different from wild-type ones.
Figure 8.
Figure 8.
m6A Binding by ECT2 Is Required for Normal Trichome Formation. (A) and (B) RIP assays. (A) Dot blot analysis of the input (lanes 1 to 3) and eluate (lanes 4 to 6) fractions obtained from wild-type (WT), ect2-2 (YFP-ECT2; ECT2), and ect2-2 (YFP-ECT2***; ECT2***) 15-d-old seedlings. Serial dilutions of the input and eluate fractions were spotted onto the membrane as follows: 1:300, 1:1500, 1:7500, and 1:37.5e-3 for the input and 1:6, 1:30, 1:150, and 1:750 for the eluate. The blot was probed with an anti-m6A antibody. (B) Protein gel blot monitoring of the levels of proteins that were respectively present in each input, unbound, and eluate fraction. Totals of 1:100 of the input and unbound fractions and 1:6 of the eluate fractions were loaded for each genotype. The blots were probed with the anti-ECT2 antibody (pep2). Images presented correspond to one replicate over four independent replicates. (C) to (E) Monitoring of trichome-branching defects. Histograms show the density of trichomes for each genotype (C). The total number of trichomes monitored is reported for each genotype. The percentages of trichomes with more than three branches (D) and three, four, or five branches (E) are shown. ECT2 represents the ect2-2 lof mutant expressing the YFP-ECT2 transgene. Two independent transgenic lines were tested (nb 5 and 17). ECT2*** represents transgenic ect2-1 lines expressing the triple ECT2 point mutant (as in [A] and [B]) fused to the YFP tag. Two independent lines (nb 46 and 47) were analyzed. The experiment was conducted over six independent replicates. Four pairs of leaves were analyzed in each replicate. Error bars represent the sd calculated over the six replicates. P values reported over the histograms in (D) and in the table in (E) were obtained with Dunnett’s test to determine if the values are significantly distinct from the wild type (labeled in black) or from ect2-2 (labeled in red and with red bars). *P < 0.05, **P < 0.005, and ***P < 0.0001; ns, not significant; na; not applicable.
Figure 9.
Figure 9.
ECT2 Mainly Accumulates in the Cytosol under Normal Growth Conditions. Monitoring of N-terminally and C-terminally tagged versions of ECT2 (YPF-ECT2 and ECT2-GFP, respectively) expressed in the ect2-2 mutant background. The YFP or GFP signals of roots of 7-d-old seedlings were observed under a confocal microscope and counterstained with 4′,6-diamidino-2-phenylindole (DAPI). The transgenic lines used are the same as those used to monitor ECT2’s ability to complement the trichome-branching defect of the ect2-2 lof mutant. DIC, differential interference contrast; N, nucleus; No, nucleolus.
Figure 10.
Figure 10.
ECT2 Relocates to SGs under Heat Stress Conditions. Root tips of 7-d-old seedlings were monitored after 30 min of exposure to 38°C (heat stress), 30 min of exposure to 38°C in the presence of 100 μM cycloheximide (CHX), or 30 min of exposure to 38°C in the presence of DMSO for mock treatment. (A) and (B) Subcellular distribution of YFP-ECT2 and ECT2-GFP. The same transgenic lines as those used in Figure 8 were analyzed. (C) and (D) Confocal monitoring of the colocalization of YFP-ECT2 and RFP-PAB2 using the ect2-2 (YFP-ECT2 and RFP-PAB2) line. One representative image is shown for each transgenic line in each environmental condition. Each experiment was conducted over three independent replicates, and at least four roots were monitored for each condition and replicate. The sizes of the scale bars are indicated. Images labeled × 2.5 correspond to a 2.5× enlargement of images in the panels immediately to the left. DIC, differential interference contrast.
None

References

    1. Addepalli B., Hunt A.G. (2007). A novel endonuclease activity associated with the Arabidopsis ortholog of the 30-kDa subunit of cleavage and polyadenylation specificity factor. Nucleic Acids Res. 35: 4453–4463. - PMC - PubMed
    1. Anderson P., Kedersha N. (2008). Stress granules: the Tao of RNA triage. Trends Biochem. Sci. 33: 141–150. - PubMed
    1. Anisimova M., Gascuel O. (2006). Approximate likelihood-ratio test for branches: a fast, accurate, and powerful alternative. Syst. Biol. 55: 539–552. - PubMed
    1. Arribas-Hernández L., Bressendorff S., Hansen M.H., Poulsen C., Erdmann S., Brodersen P. (2018). Control of developmental timing and morphogenesis in Arabidopsis by an m6A-YTH module. Plant Cell 30: 952–967. - PMC - PubMed
    1. Bodi Z., Zhong S., Mehra S., Song J., Graham N., Li H., May S., Fray R.G. (2012). Adenosine methylation in Arabidopsis mRNA is associated with the 3′ end and reduced levels cause developmental defects. Front. Plant Sci. 3: 48. - PMC - PubMed

Publication types

MeSH terms

Substances