. 2018 Apr;556(7700):244-248.
doi: 10.1038/s41586-018-0004-7. Epub 2018 Apr 4.

Distributed hepatocytes expressing telomerase repopulate the liver in homeostasis and injury

Affiliations

Distributed hepatocytes expressing telomerase repopulate the liver in homeostasis and injury

Shengda Lin et al. Nature. 2018 Apr.

Abstract

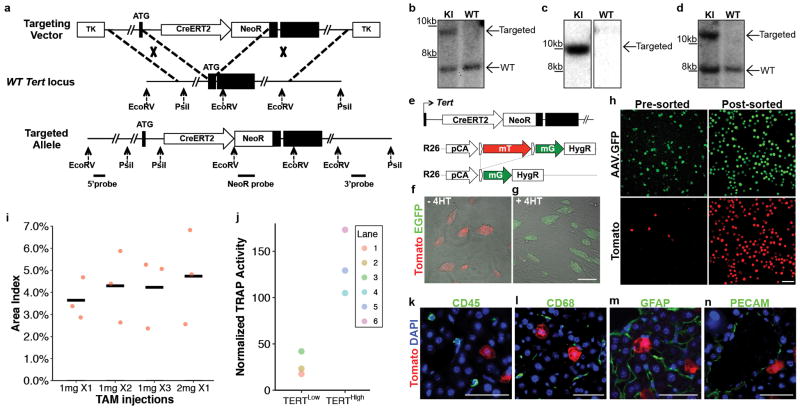
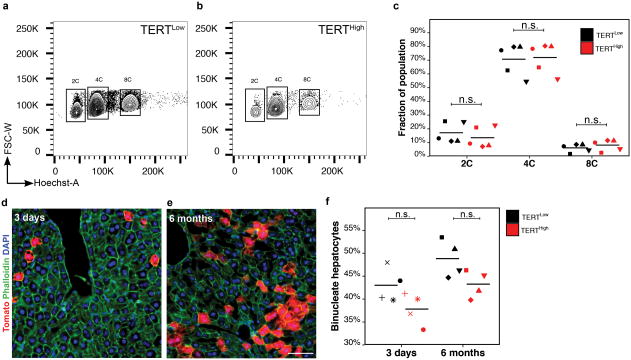
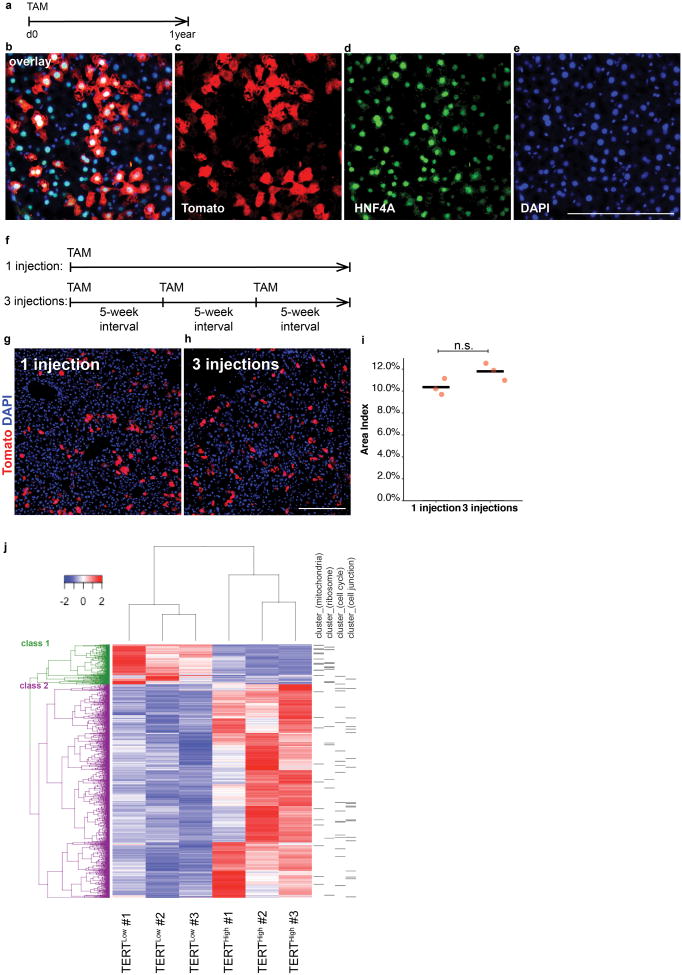
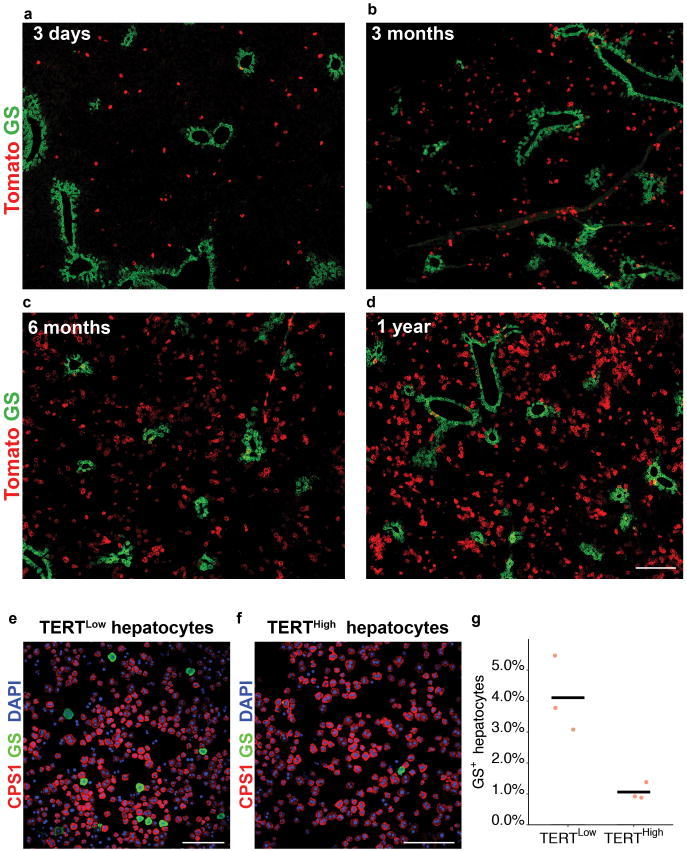
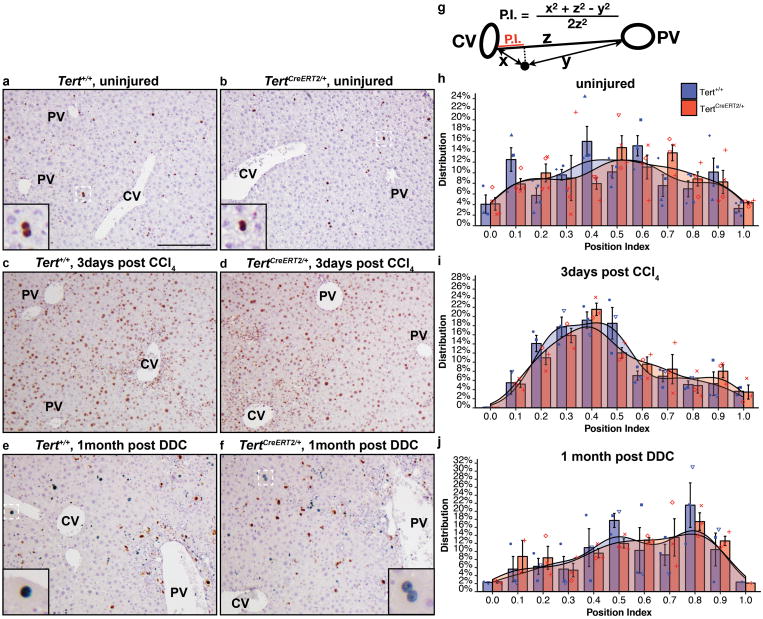
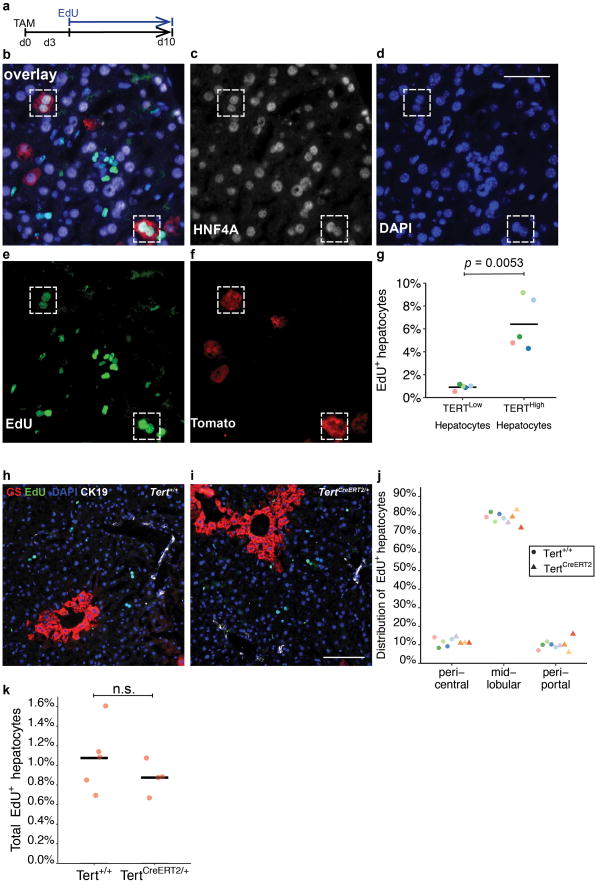
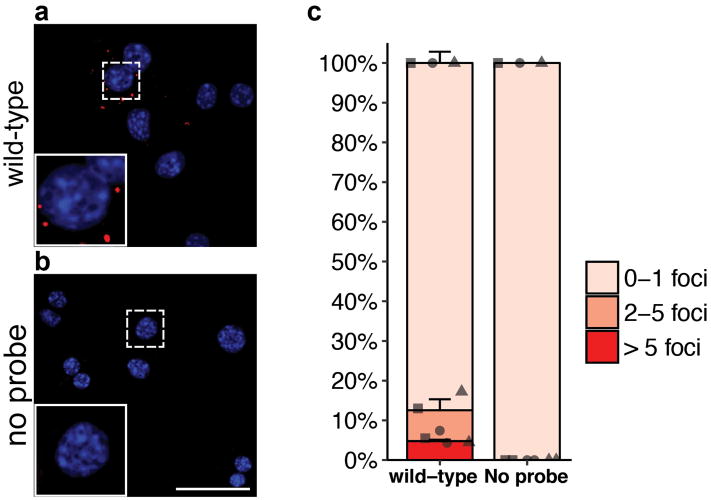
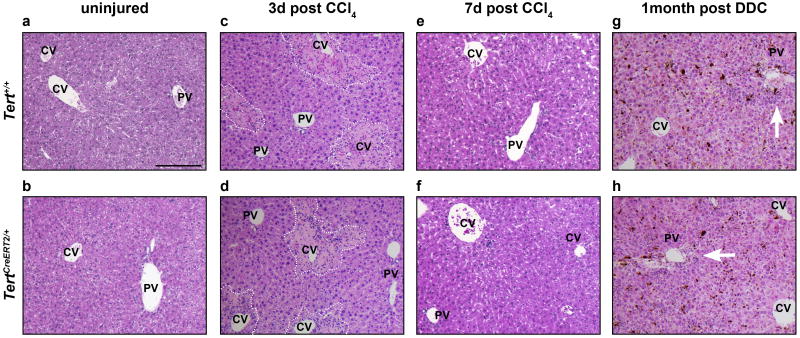
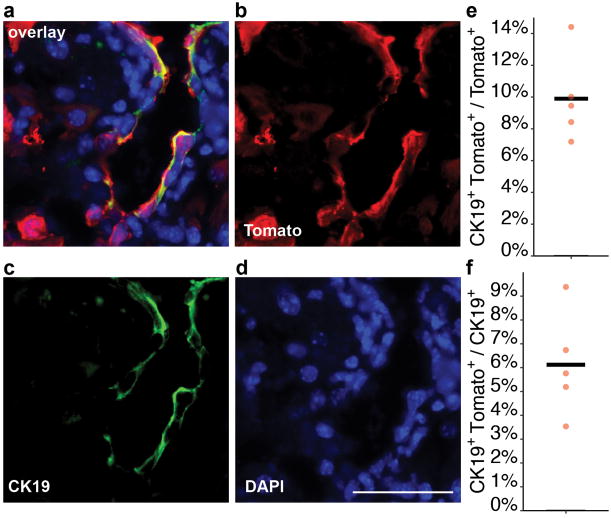
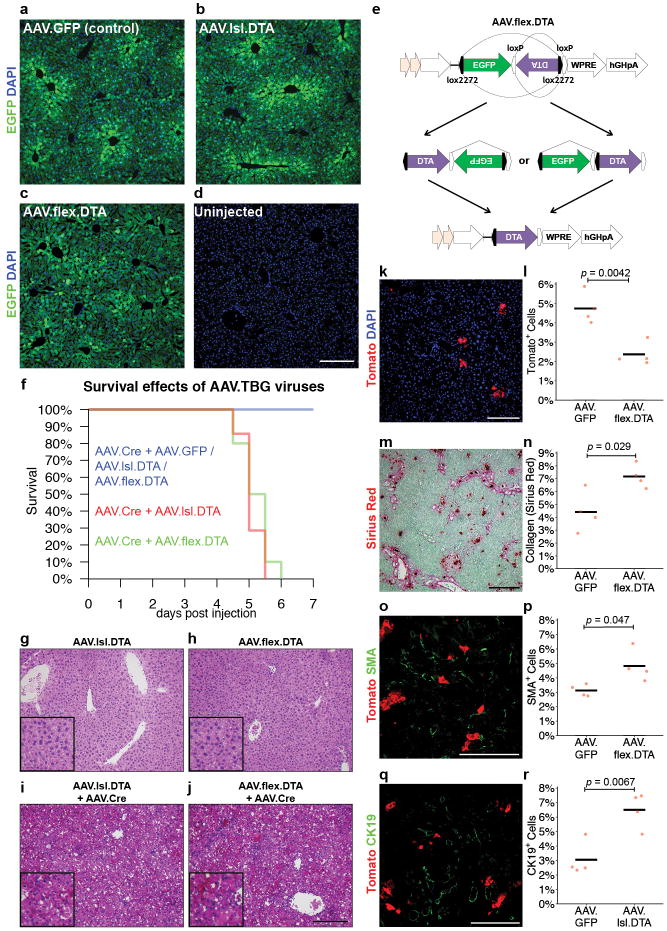
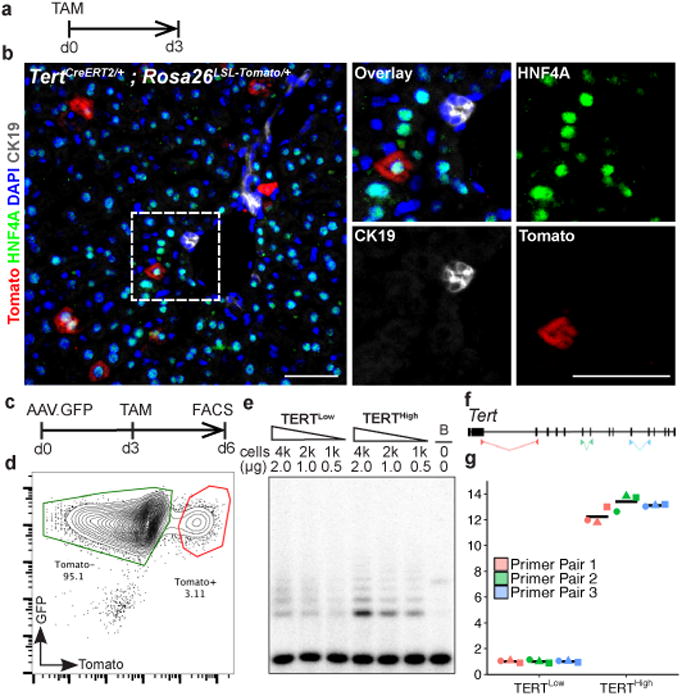
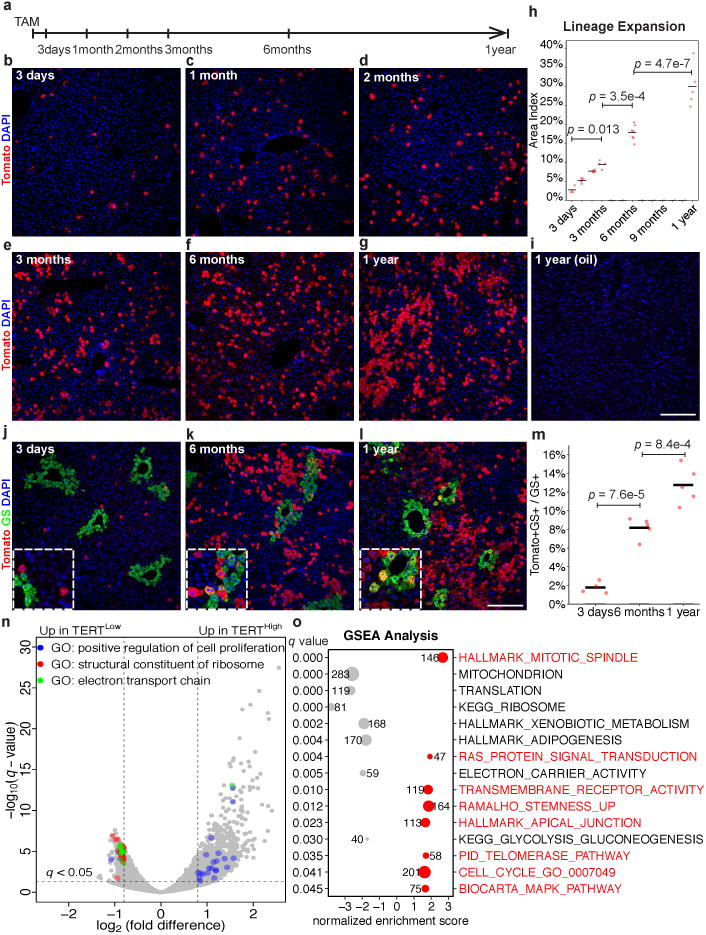
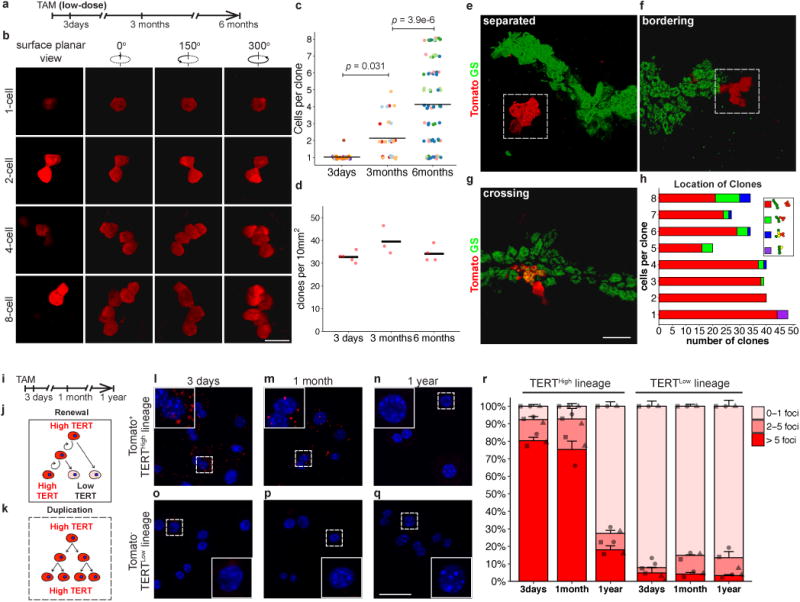
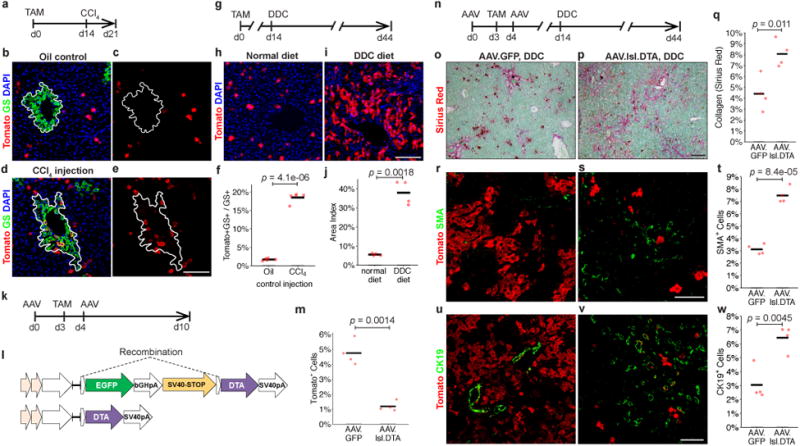
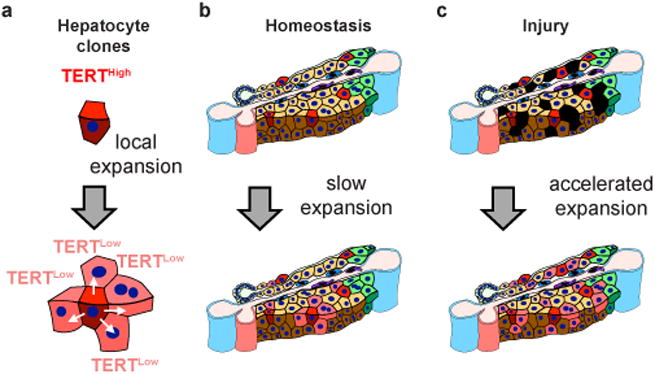
Hepatocytes are replenished gradually during homeostasis and robustly after liver injury1, 2. In adults, new hepatocytes originate from the existing hepatocyte pool3-8, but the cellular source of renewing hepatocytes remains unclear. Telomerase is expressed in many stem cell populations, and mutations in telomerase pathway genes have been linked to liver diseases9-11. Here we identify a subset of hepatocytes that expresses high levels of telomerase and show that this hepatocyte subset repopulates the liver during homeostasis and injury. Using lineage tracing from the telomerase reverse transcriptase (Tert) locus in mice, we demonstrate that rare hepatocytes with high telomerase expression (TERTHigh hepatocytes) are distributed throughout the liver lobule. During homeostasis, these cells regenerate hepatocytes in all lobular zones, and both self-renew and differentiate to yield expanding hepatocyte clones that eventually dominate the liver. In response to injury, the repopulating activity of TERTHigh hepatocytes is accelerated and their progeny cross zonal boundaries. RNA sequencing shows that metabolic genes are downregulated in TERTHigh hepatocytes, indicating that metabolic activity and repopulating activity may be segregated within the hepatocyte lineage. Genetic ablation of TERTHigh hepatocytes combined with chemical injury causes a marked increase in stellate cell activation and fibrosis. These results provide support for a 'distributed model' of hepatocyte renewal in which a subset of hepatocytes dispersed throughout the lobule clonally expands to maintain liver mass.


Figures

Extended Data Figure 1
Extended Data Figure 1. Generation and characterization of the TertCreERT2/+ knock-in line
a-d, TertCreERT2 targeting strategy and southern-blot strategy (a). Southern-blots using a 5′probe (b), a NeoR probe (c), and a 3′probe (d). KI, knock-in cells. WT, wild-type cells. For gel source data, see Supplementary Figure 1. e-g, TertCreERT2/+;Rosa26mTmG/+ mouse embryonic stem cells showed either membrane Tomato (f, overlaid on bright-field image), or membrane EGFP(g, overlaid on bright-field image) in response to 500nM 4-hydroxy tamoxifen (4-HT). h, hepatocytes from TertCreERT2/+; Rosa26LSL-Tomato/+ livers before and after FACS-enrichment. i, Tamoxifen dose response of TertCreERT2/+; Rosa26LSL-Tomato/+ livers (n = 3 mice for each group, cross-bar: mean). j, Quantification of the TRAP assay shown in Fig.1e by densitometry. k-n, Co-immunofluorescence for Tomato (red) and CD45 (k, blood cells, 202 cells examined), CD68 (l, Kupffer cells, 179 cells examined), GFAP (m, stellate cells, 158 cells examined) and PECAM (n, endothelial, 167 cells examined) (each in green) in TertCreERT2/+; Rosa26LSL-Tomato/+ liver, 3-day trace, with DAPI (blue). Experiments repeated twice for b-d, f-g, k-n. Scale bars, 100 μm in g,h, 50 μm in k-n.
Extended Data Figure 2
Extended Data Figure 2. Ploidy and nuclear profiles of the TERTLow and TERTHigh lineages
a-c, Ploidy analysis by Hoechst incorporation and FACS in TERTLow (a) and TERTHigh (b) hepatocytes. Quantification showed no significant differences between TERTLow and TERTHighcells regarding ploidies (c, n = 5 mice, each represented by unique dot-shapes). d-f, Nuclei count by Tomato(red), phalloidin(green) and DAPI(blue) in livers traced by 3 days (d) and 6 months (e). Quantification showed no significant differences between TERTLow and TERTHighcells in binuclei fractions (f, n = 4 mice for each group, each represented by unique dot-shapes). Experiments repeated twice. Scale bar, 50 μm.
Extended Data Figure 3
Extended Data Figure 3. Characterization of the lineage expansion of TERTHigh hepatocytes
a-e, IF performed on TertCreERT2/+; Rosa26LSL-Tomato/+ livers after one-year trace showed TERTHigh hepatocytes exclusively gave rise to hepatocytes. f-i, Repeated injections showed TERTHigh cells as a constant proportion of the liver. Lineage expansion over one injection (g) and three injections (h) was quantified (i, n = 3 mice for each group; cross-bar: mean). j, Heat map showing differentially regulated genes among all TERTLow and TERTHigh samples. Class I and Class 2 refer to genes significantly down-regulated and up-regulated in TERTHigh samples, respectively. Genes assigned to DAVID- generated annotation clusters shown on the right. Experiments repeated twice. Scale bar, 200 μm.
Extended Data Figure 4
Extended Data Figure 4. Zonal pattern of TERTHigh lineage hepatocytes
a-d, Stitched images of IF for Tomato protein (red) and GS (green) in liver sections from TertCreERT2/+; Rosa26LSL-Tomato/+ mice treated with tamoxifen and traced for three days (a), three months (b), six months (c) or one year (d). e-g, FACS-isolated and cytospunhepatocytes from TertCreERT2/+; Rosa26LSL-Tomato/+ mice treated with tamoxifen and traced for three days were stained for CPS1 (red) and GS (green) in TERTLow (e) and TERTHigh hepatocytes (f), and quantified for the GS+ fraction of all cells (g, n = 3 mice; cross-bars: mean). Experiments repeated three times. Scale bars, 200 μm.
Extended Data Figure 5
Extended Data Figure 5. Distribution of proliferating hepatocytes in Tert+/+ and TertCreERT2/+ livers in homeostasis and under injury hepatocytes
a-f, Livers were stained with anti-Ki-67 antibody with standard immunohistochemistry. Ki-67+ nuclei were indicated by brown colours in uninjured livers (a, b), and CCl4 (10 μL/10 g weight) injured livers (c, d), with haematoxylin counterstain in light blue. Green chromogen was used to indicate Ki-67+ nuclei in DDC (0.1%) treated livers (e, f). Hepatocyte nuclei were distinguished by size and morphology. Examples of Ki-67+ hepatocytes nuclei were shown in box insets. g, Quantification of Ki-67+ hepatocytes and their distribution along the central-portal axis. The position index (P.I.) was determined by the distance to the most adjacent central vein (x), the distance to the most adjacent portal vein (y), and the distance between the central and portal veins (z), following the law of cosines. h-j,Two-sided Kolmogorov-Smirnov tests were performed to analyse the distribution of Ki-67+ hepatocytes along the central-portal axis. Histograms (bin-width = 0.1) and shaded curves of the kernel density estimation with Gaussian approximation were shown. Bars and error-bars: mean±SEM. No significant differences between Tert+/+ and TertCreERT2/+ livers were found in uninjured livers (h, n = 4 mice for each group;each mouse represented by unique dot-shapes;p = 0.58), in CCl4 injured livers (i, n = 3 mice for each group; each mouse represented by unique dot-shapes, p = 0.32), or in DDC injured livers (j, n = 3 mice for each group; each mouse represented by unique dot-shapes;p = 0.98). Experiments repeated twice. CV, central vein; PV, portal vein; P.I., position index. Scale bar, 200 μm.
Extended Data Figure 6
Extended Data Figure 6. EdU incorporation assays
a, Scheme of experiments. b-g, EdU incorporation in livers of TertCreERT2/+; Rosa26LSL-Tomato/+ mice treated with tamoxifen, traced for three days, then treated with EdU in drinking water for 7 days (1 mg/mL). The overlay image (b), as well as individual images of HNF4A (c), DAPI (d), EdU (e) and Tomato (f) were shown. Quantification of EdU incorporation in hepatocytes (g, n = 5 mice, each represented by unique dot-colours). Dashed boxes, EdU+HNF4A+Tomato+ cells. h-k,EdU incorporation in livers of Tert+/+ (h) and TertCreERT2/+(i) mice were compared. Co-immunofluorescence for GS (red) and CK19 (white) was overlaid with EdU (green) and DAPI (blue). Quantification of the distribution of EdU+ hepatocytes (j, “pericentral”: in GS+ zones; “periportal”: 0-2 cell layers adjacent to the portal veins space or CK19+ bile ducts; “mid-lobular”: neither “pericentral” nor “periportal”. Dot-colours represent individual mice) and total EdU+ hepatocytes in Tert+/+ and TertCreERT2/+ livers (k) (n = 5 mice for Tert+/+livers, and n = 4 mice for TertCreERT2/+livers). Experiments repeated twice. Scale bar, 50 μm in d, 200 μm in i.
Extended Data Figure 7
Extended Data Figure 7. Single-molecule RNA FISH on wild-type hepatocytes
a, Experiment performed on wild-type hepatocytes isolated by FACS and cytospun. b, Control experimentby omitting the detection probe for Tert. c, Quantification by foci counts (n = 3 mice, each represented by unique dot-shapes. Bars and error-bars are mean+SEM). Experiments repeated three times. Scale bar, 50 μm.
Extended Data Figure 8
Extended Data Figure 8. Responses of Tert+/+ and TertCreERT2/+livers to injuries
a-b, H&E analysis on uninjured livers. c-d, H&E analysis on livers 3 days post CCl4 injection. Artificial white dotted lines encircle the damage pericentral area. e-f, H&E analysis on livers 7 days post CCl4 injection. g-h, H&E analysis on livers 1 month post DDC treatment. CV, central vein; PV, portal vein. Experiments repeated five times. Scale bar, 200 μm.
Extended Data Figure 9
Extended Data Figure 9. Progeny of TERTHigh hepatocytes can adopt ductal fate after DDC injury
a-d, IF analysis on TertCreERT2/+; Rosa26LSL-Tomato/+ livers treated with tamoxifen and DDC, and traced for 1 month. The overlay image (a), as well as individual images of Tomato (b), CK19 (c), and DAPI (d) were shown. e. Quantification of the percentage of CK19+Tomato+ cells in all Tomato+ cells (n = 5 mice, mean±SEM:10.0±1.2%) f. Quantification of the percentage of CK19+Tomato+ cells in all CK19+ cells (n = 5 mice, mean±SEM:6.1±1.0%). Bars: mean. Experiments repeated three times. Scale bar, 50 μm.
Extended Data Figure 10
Extended Data Figure 10. Characterization of AAV.lsl.DTA and AAV.flex.DTA
a-d, Epifluorescence of EGFP, as well as DAPI staining from livers 4 days after injection with AAV.GFP (a), AAV.lsl.DTA (b), AAV.flex.DTA (c), and uninjected control (d) shown. e, Diagram of AAV.flex.DTA, and recombination events that lead to DTA expression. f, Survival effects of AAV.TBG viruses. Combined injection of “AAV.lsl.DTA+AAV.Cre” (red line) or “AAV.flex.DTA+AAV.Cre” (green line) lead to a narrow window of complete mortality between 4.5-6 days; in contrast, “AAV.GFP+AAV.Cre”, AAV.lsl.DTA, or AAV.flex.DTA injection did not result in mortality. Between 4-6 mice were used for each regimen. Survived mice were monitored for up to 2 months. g-j,H&E on liver sections from mice injected with AAV.lsl.DTA alone (g), AAV.flex.DTA alone (h), “AAV.lsl.DTA+AAV.Cre” (i), and “AAV.flex.DTA+AAV.Cre” (j). k-r, Livers injected with AAV.flex.DTA and Tamoxifen showed reduction of TERTHigh cells (k, l), as well as increases in collagen deposit (m, n), activated stellate cells (o, p) and ductal cells (q, r). Experiments repeated three times for a-d, and twice for g-j, k-r. Scale bars, 200 μm.
Figure 1
Figure 1. Identification of a hepatocyte subpopulation with elevated Tert and telomerase activity
a-b, Immunofluorescence (IF) analysis on TertCreERT2/+; Rosa26LSL-Tomato/+ liverstreated with single-dose of tamoxifen and analysed 3 days post injection. Tomato (red), HNF4A (green), CK19 (white), and DAPI (blue) shown. c-g, Analysis of telomerase expression in FACS-sorted hepatocytes. Representative FACS plot (d), TRAP assay (e, B: Buffer only) and quantitative reverse-transcription PCR(f, position of primer pairs) (g, fold-changes.n = 3 mice, each indicated by unique dot shapes; cross-bar: mean) shown. Experiments repeated three times for b, more than five times for d, and twice for e and g. Scale bars, 50 μm.
Figure 2
Figure 2. TERTHigh hepatocytes repopulate the liver in homeostasis and show downregulation of metabolic genes
a-i, Lineage tracing in TertCreERT2/+; Rosa26LSL-Tomato/+ micetreated with single-dose tamoxifen (b-g) or oil vehicle (i) and analysed at indicated tracing periods by IF for Tomato. Quantification of Tomato+hepatocyte area (h, n = 4, 5, 4, 4, 7, 5 mice for each time-point;cross-bar: mean). j-m, Co-IF for Tomato and GS inTertCreERT2/+; Rosa26LSL-Tomato/+ micetraced for 3 days, 6 months or one year.Quantification of Tomato+GS+ fraction of GS+ hepatocytes (m, n = 4, 5, 5 mice for each time-point; cross-bars, mean). n-o, RNA-seq results on FACS-purified TERTHigh (Tomato+) or TERTLow (Tomato-) hepatocytes (n = 3 mice for each group). Volcano plot for enriched genes and GO terms (n,cut-offs:q< 0.05, |log2(fold difference)|> 0.8). GSEA analysis for enriched gene-sets (o, number of genes shown for each gene set). Experiments repeated twice for time-points in b,f,g,j-l. Scale bars, 100 μm.
Figure 3
Figure 3. TERTHigh hepatocytes drive clonal expansion by a self-renewal mechanism
a-h, 3D analysis of sparse-labelled hepatocyte clones in TertCreERT2/+; Rosa26LSL-Tomato/+ mice treated with low-dose tamoxifen, traced for 3 days, 3 months or 6 months. Clone-sizes (b,c) and clone-number per volume (d) (n = 5, 3, and 4 mice, respectively; each mouse represented by unique dot-colour in c; cross-bar: mean). Co-IF for Tomato and GS to assess clone-location in 6-month trace samples (e-h). Quantification of clone size and position relative to GS+ cells (h).i-r, Single-molecule RNA FISH on FACS-purified TERTHigh derived (l-n) and TERTLow derived (o-q) hepatocytes. Quantification by foci counts (r, n = 3 mice per time-point, each mouse indicated by unique dot-shapes. Bars and error-bars are mean+SEM. For cells with >5 foci, p1month-3days = 0.56, p1year-3days = 2.7e-5, p1year-1month = 4.3e-5). Experiments repeated twice. Scale bars, 50 μm.
Figure 4
Figure 4. TERTHigh hepatocytes are critical in liver regeneration
a-f, Single-dose CCl4 liver injury. TertCreERT2/+; Rosa26LSL-Tomato/+ mice treated with oil vehicle (b,c) or CCl4 (d,e) analysed by IF for Tomato and GS at day 7 post-treatment. IF Quantification (f); white lines, GS+ pericentral zone(n = 5 mice). g-j, DDC diet-induced injury in TertCreERT2/+; Rosa26LSL-Tomato/+ mice. IF of liver for Tomato after 30 days treatment with normal diet (h) or DDC diet (i). IF quantification (j) (n = 4 mice). k-m, Ablation of TERTHigh hepatocytes via AAV.lsl.dtA injection to TertCreERT2/+; Rosa26LSL-Tomato/+ mice (n = 4 mice), quantification of Tomato+ cells (m). n-v, Genetic ablation followed by DDC injury in TertCreERT2/+; Rosa26LSL-Tomato/+ mice. Livers analysed by Sirius Red for collagen (o-q), SMA for activated stellate cells (r-t), and CK19+ cells (u-w) (n = 4 mice). AAV.GFP injected control animals (o, r, t) and AAV.lsl. DTA injected animals (p, s, u).Cross-bars: mean.Experiments repeated at least twice. Scale bars, 100 μm.
Figure 5
Figure 5. A distributed modelto explain hepatocyte renewal
a, TERTHigh hepatocytes generate expanding clones comprised of both TERTHigh and TERTLow hepatocytes. b, Rare TERTHigh hepatocytes distributed throughout the lobule form enlarging clones during homeostasis in response to local hepatocyte loss. c, Repopulation of injured liver by clonal expansion ofTERTHigh hepatocytes is accelerated during injury. Blue vessels, portal and central veins; pink vessel, hepatic artery; small green cells, cholangiocytes; large green cells, pericentral hepatocytes; red cells, TERTHigh hepatocytes; black cells, damaged hepatocytes.

Comment in

References

    1. Stanger BZ. Cellular homeostasis and repair in the mammalian liver. Annu Rev Physiol. 2015;77:179–200. doi: 10.1146/annurev-physiol-021113-170255. - DOI - PMC - PubMed
    1. Zaret KS, Grompe M. Generation and regeneration of cells of the liver and pancreas. Science. 2008;322:1490–1494. doi: 10.1126/science.1161431. - DOI - PMC - PubMed
    1. Malato Y, et al. Fate tracing of mature hepatocytes in mouse liver homeostasis and regeneration. The Journal of clinical investigation. 2011;121:4850–4860. doi: 10.1172/JCI59261. - DOI - PMC - PubMed
    1. Schaub JR, Malato Y, Gormond C, Willenbring H. Evidence against a stem cell origin of new hepatocytes in a common mouse model of chronic liver injury. Cell reports. 2014;8:933–939. doi: 10.1016/j.celrep.2014.07.003. - DOI - PMC - PubMed
    1. Yanger K, et al. Adult hepatocytes are generated by self-duplication rather than stem cell differentiation. Cell stem cell. 2014;15:340–349. doi: 10.1016/j.stem.2014.06.003. - DOI - PMC - PubMed

Publication types