. 2018 Apr;556(7700):239-243.
doi: 10.1038/s41586-018-0016-3. Epub 2018 Apr 4.

Advanced maturation of human cardiac tissue grown from pluripotent stem cells

Affiliations

Advanced maturation of human cardiac tissue grown from pluripotent stem cells

Kacey Ronaldson-Bouchard et al. Nature. 2018 Apr.

Erratum in

Abstract

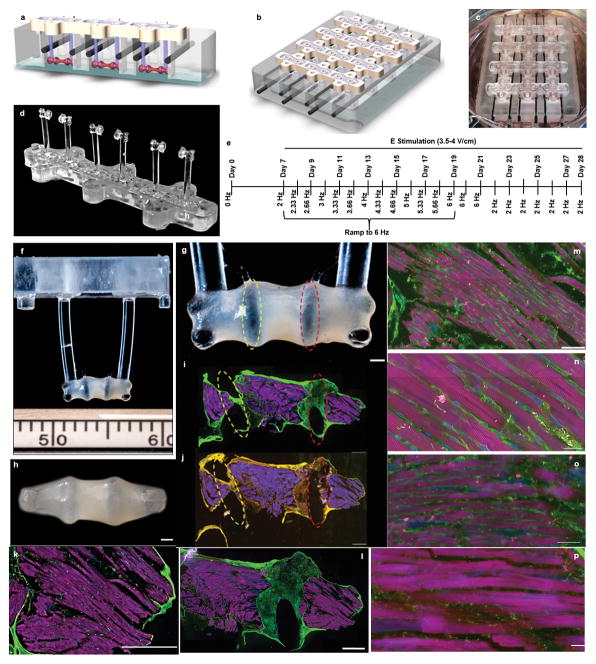
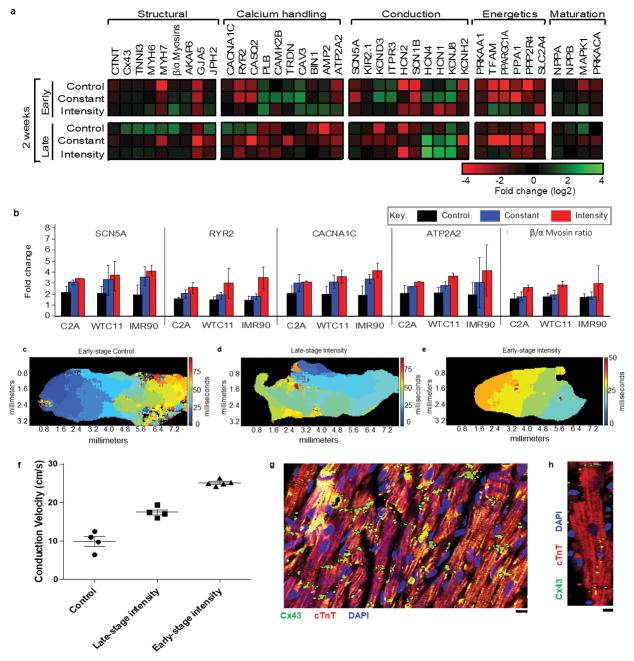
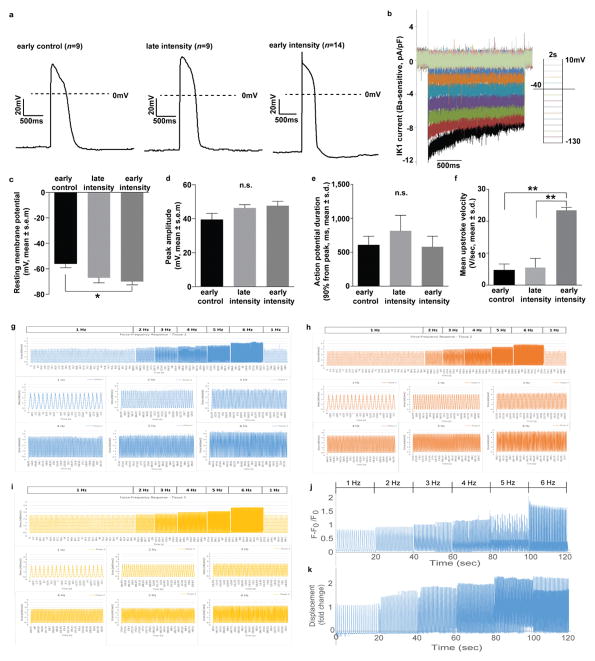
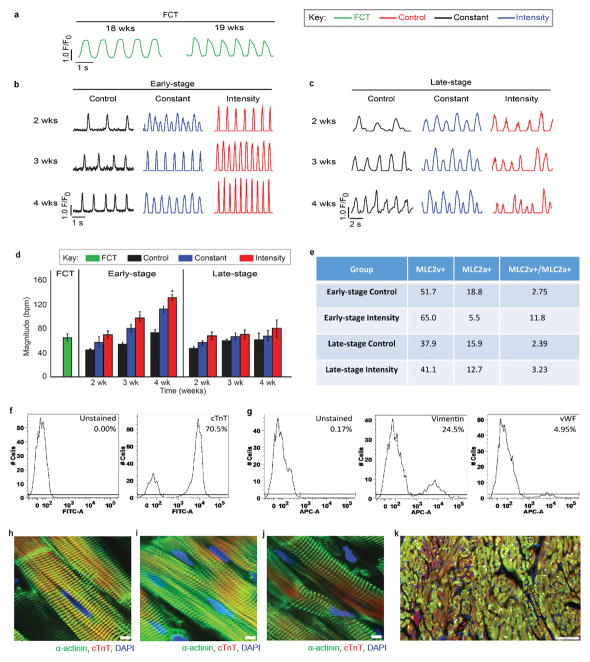
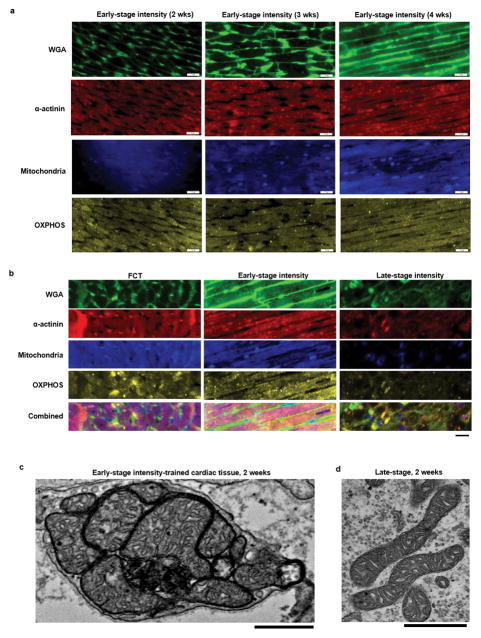
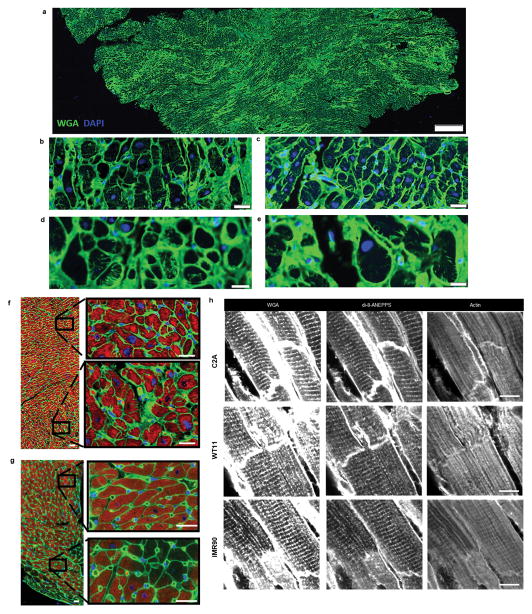
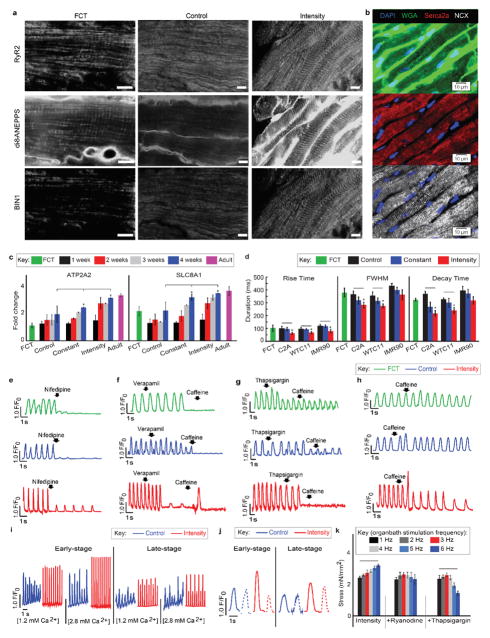
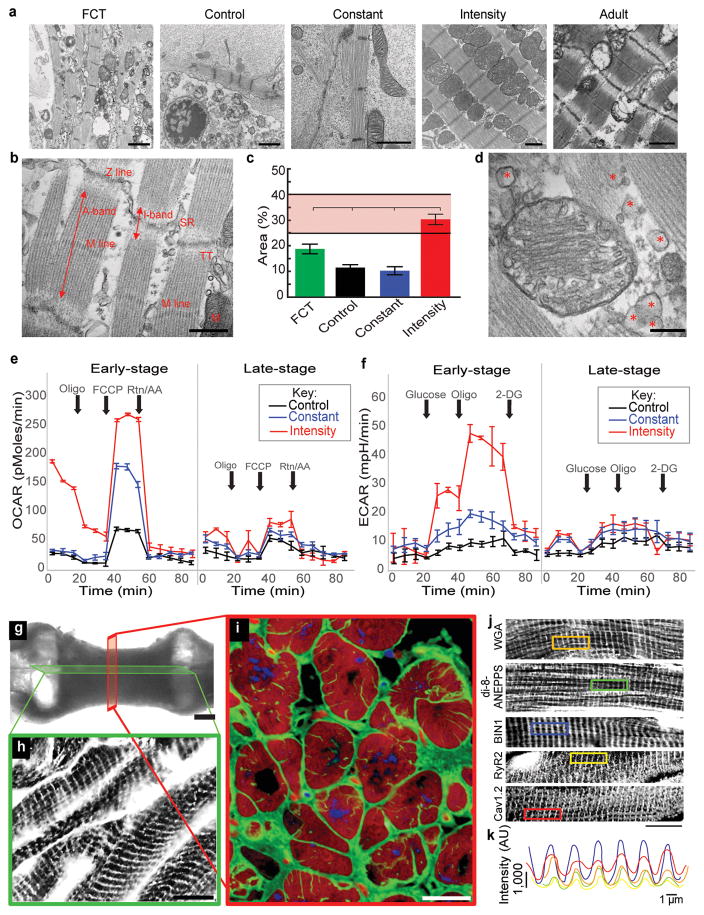
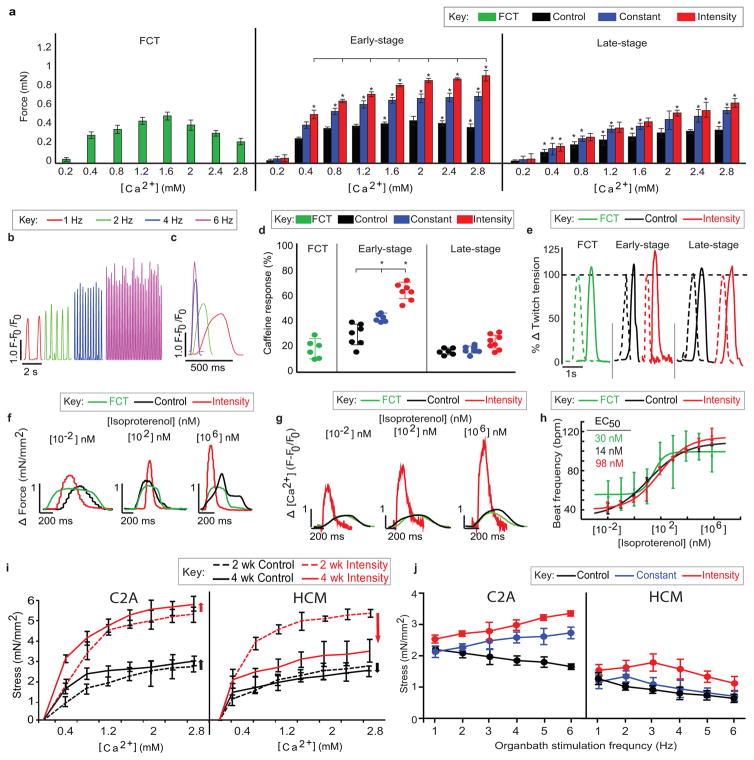
Cardiac tissues generated from human induced pluripotent stem cells (iPSCs) can serve as platforms for patient-specific studies of physiology and disease1-6. However, the predictive power of these models is presently limited by the immature state of the cells1, 2, 5, 6. Here we show that this fundamental limitation can be overcome if cardiac tissues are formed from early-stage iPSC-derived cardiomyocytes soon after the initiation of spontaneous contractions and are subjected to physical conditioning with increasing intensity over time. After only four weeks of culture, for all iPSC lines studied, such tissues displayed adult-like gene expression profiles, remarkably organized ultrastructure, physiological sarcomere length (2.2 µm) and density of mitochondria (30%), the presence of transverse tubules, oxidative metabolism, a positive force-frequency relationship and functional calcium handling. Electromechanical properties developed more slowly and did not achieve the stage of maturity seen in adult human myocardium. Tissue maturity was necessary for achieving physiological responses to isoproterenol and recapitulating pathological hypertrophy, supporting the utility of this tissue model for studies of cardiac development and disease.


Conflict of interest statement

The authors declare the following competing financial interests: GVN and KRB are cofounders of TARA Biosystems, a Columbia spinout commercializing the use of bioengineered human cardiac tissue for drug testing.

Figures

Extended Data Figure 1
Extended Data Figure 1. Experimental design and the overall appearance of cardiac tissues
a A schematic of the pillars (purple) placed via interlocking mating components between the bioreactor wells (gray) and pillar lid (yellow) with tissues (pink) formed around the pillars, and electrodes (black) placed perpendicular to the cardiac tissues. A glass slide (blue) is epoxied to the bottom of the bioreactor to enable facile video acquisition. b A schematic of the assembled bioreactor. c Photographs of the cardiac tissues cultured within the bioreactor. d The tissue pillar. e Increase in the electrical stimulation frequency throughout the intensity training regimen. Photographs of the tissues attached to pillars at the end of 4-week cultivation: f–g Side view. h Bottom view. Scale bars: 500 μm. g–j Serial immunofluorescent sections of the early stage intensity trained tissue with dotted yellow and red lines indicating corresponding pillar placement within tissue. Scale bars: 500 μm. k–p Serial immunofluorescent sections of the early stage intensity trained tissue photographed in i at four different magnifications from different regions. WGA: green; alpha-actinin: pink; nuclei: blue. Scale bars: (i–l) 500 μm, m 100 μm, n 20 μm, o–p 50 μm. Images were selected to include landmark features that facilitate localization and comparisons. Similar results were obtained from 3 independent experiments.
Extended Data Figure 2
Extended Data Figure 2. Enhanced gene expression and conduction within intensity trained cardiac tissues over time
a Quantitative gene expression of FCTs and C2A hiPS cardiac tissues as determined by qPCR after 2 weeks of culture, fold change relative to late-stage tissues at the start of stimulation. b Quantitative gene expression of early-stage cardiac tissues, normalized to GAPDH, from 3 different hiPS lines as determined by qPCR after 4 weeks of culture. n = 12 biologically independent samples per group, Mean ± 95% CI, no significance at p<0.05 between different cell lines by 2-way ANOVA. c–f Representative conduction velocity activation maps for c early-stage control, d late-stage intensity, and e early-stage intensity trained cardiac tissues and f Surrogate of conduction velocity within early- and late-stage C2A hiPS cardiac tissues after 4 weeks of culture, assessed by calcium propagation. Mean ± SEM, n=45 biologically independent samples per group. g–h Representative immunofluorescent images of gap junction (Connexin-43 (Cx43), green) expression within early-stage intensity-trained hiPS cardiac tissue (cardiac troponin T (cTnT), red), nuclei (DAPI, blue)) after 4 weeks of culture at g, lo magnification (scale bar = 10 μm) and h high magnification (scale bar = 5 μm). Similar results were obtained from 4 independent experiments.
Extended Data Figure 3
Extended Data Figure 3. Electrophysiological characterization of human engineered cardiomyocytes
a Representative traces of action potentials in early control (n=9), late intensity (n=9) and early intensity (n=14) groups, where n is biologically independent sample obtained during 2 independent experiments. b Representative traces of IK1 current for early intensity group using voltage clamp mode. c–f Electrophysiological data after 4 weeks of culture detailing the c Resting membrane potentials, d Peak amplitude, e Action potential duration and f Upstroke velocity obtained during 2 independent experiments resulting in biologically independent data from early control (n=9), late intensity (n=9) and early intensity (n=14) groups. **P<0.01, *P<0.05 using One-way ANOVA Barlette’s test with multiple comparison, n.s.=not significant. g–i Representative continuous organ bath force recordings under electrical pacing from 16 Hz from three biologically independent early-stage intensity trained tissues (C2A cells) during one experiment. j–k Representative continuous recordings from an early-stage intensity trained tissue (C2A cells) under electrical pacing from 1–6 Hz of j calcium and k surrogate force as determined by tissue displacement normalized to 1 Hz.
Extended Data Figure 4
Extended Data Figure 4. Enhanced maturation and synchronicity of cardiac tissues in response to training regimen as a function of time
Representative contraction profiles of a fetal cardiac tissues (FCT), b early-stage and c late-stage cardiac tissues (C2A cell line) over time. d Frequency of contractions in cardiac tissues over 4 weeks of culture (n = 35 biologically independent samples over 16 independent experiments) Mean ± 95% CI, *p<0.05 compared to control group by two-way ANOVA with Tukey’s HSD test. Early-stage intensity training is significant against other training regimens by two-way ANOVA with Tukey’s HSD test. e Characterization of cardiac cell population within cardiac tissues (C2A line) after 4 weeks of culture by FACS analysis. Characterization of cells isolated from early-stage intensity trained cardiac tissues (C2A line) by FACS analysis after 4 weeks of culture for f cardiac cells (cardiac troponin T, cTnT) and g supporting fibroblast cells (vimentin) and endothelial cells (von Willebrand Factor, vWF). hj Representative immunofluorescent images obtained from whole tissues via confocal microscopy detailing the enhanced cardiac ultrastructure: a-actinin (green), cardiac troponin T (red), nuclei (blue) within early-stage cardiac tissues from the h C2A line, i WTC11 cell line, and j, IMR90 cell line after 4 weeks of culture (scale bar = 5 μm, experiment repeated independently 14 times with similar results). k Representative immunofluorescent images detailing the cell population: cardiac troponin T (cTnT, green), vimentin (red), nuclei (blue) within a histological section from early-stage cardiac tissue (C2A line) after 4 weeks of culture (scale bar = 50 μm, experiment repeated independently 2 times with similar results).
Extended Data Figure 5
Extended Data Figure 5. Physiological hypertrophy within cardiac tissues enhances contractility
Physiological hypertrophy of CM’s cultured within the electromechanically conditioned cardiac tissue format increases as a function of time and training regimen beyond FCT levels, as detailed by a cell elongation ratio and b sarcomere length (n=326 biological replicates from 15 independent samples during one independent experiment). c This enables the change in area while being electrically paced at 1 Hz, an indirect measure of fractional shortening, to similarly increase beyond FCT levels as a function of time and training regimen. Data represent the ratio of the change in area for a given time point and the change in area at day 6; n=6 biologically independent samples per group, Mean ± 95% CI, * = p<0.05 compared to FCT group at week 4 by ANOVA with Tukey’s HSD test and — = p<0.05 compared to other training regimens by 2-way ANOVA with Tukey’s HSD test). The enhanced cardiac ultrastructure within intensity trained early-stage cardiac tissues is documented by the d quantification of sarcomere distribution within cardiac tissues (n=12 biologically independent samples per group, Mean ± 95% CI), Representative immunofluorescent images of e gap junction (Connexin-43 (Cx43), white) expression within early-stage hiPS cardiac tissue (b-Myosin heavy chain (bMHC, green), cardiac troponin T (cTnT, red), nuclei (DAPI, blue)) and f cardiac ultrastructure within early-stage hiPS cardiac tissue (a-actinin, green), cardiac troponin T (cTnT, red), nuclei (DAPI, blue)) after 4 weeks of culture (scale bar: 50 μm, experiment repeated independently 3 times with similar results) and g immunofluorescent images of α–actinin (white) within cardiac tissues after 4 weeks of culture (scale bar = 10 μm, experiment repeated independently 2 times with similar results).
Extended Data Figure 6
Extended Data Figure 6. Enhanced ultrastructural properties of cardiac tissues via intensity training
a Representative TEM images for FCTs, adult cardiac tissue, and early-stage cardiac tissues (C2A line) using different electromechanical conditioning regimens after 4 weeks of culture (scale bar = 500 nm). b TEM images of intensity trained early-stage cardiac tissues (C2A line) after 4 weeks of culture detailing various ultrastructural elements (scale bar: 500 nm). Similar results to those in ab were obtained independently as follows: FCT (n=8), Adult (n=2), Control (n=3), Constant (n=3), Intensity (n=4).
Extended Data Figure 7
Extended Data Figure 7. Intensity training of early-stage cardiac tissues is required to enhance mitochondrial development
a Representative immunofluorescent images detailing various ultrastructural proteins (WGA (green), α-actinin (red), mitochondria (blue), oxidative phosphorylation (yellow)) for early-stage cardiac tissues (C2A cell line) at different culture times during exposure to the intensity training electromechanical conditioning regimen (scale bar: 20 μm). b Representative immunofluorescent images detailing ultrastructural proteins (WGA (green), α-actinin (red), mitochondria (blue), oxidative phosphorylation (yellow)) of cardiac tissues cultured under intensity training for 4 weeks from early-stage hiPS-CMs (C2A cell line), late-stage hiPS-CMs (C2A cell line), and 19 week old fetal cardiac tissue (FCT) (scale bar: 20 μm). Similar results to those in ab were obtained independently as follows: FCT (n=5), Early-stage intensityl (n=3), Late-stage intensity (n=3). cd Representative TEM images for c, early-stage and d, late-stage cardiac tissues (C2A cell line) after 2 weeks of exposure to the intensity training electromechanical conditioning regimen (scale bar: 1 μm, experiment not repeated independently).
Extended Data Figure 8
Extended Data Figure 8. Formation of T-tubules within early-stage intensity trained cardiac tissues
a Axial tissue cross sections from intensity trained cardiac tissues (C2A line) after 4 weeks of culture detailing t-tubules, as stained with WGA (green), and nuclei, as stained with DAPI (blue) at a low magnification (scale bar: 100 μm), bc medium magnification (scale bar: 10 μm) and de high magnification (scale bar: 5 μm), fg Axial tissue cross sections detailing t-tubules (as stained with WGA (green), actin (red) and DAPI (blue)) within f intensity trained cardiac tissues (C2A line) after 4 weeks of culture and g 19 week old FCT. (scale bar: 10 μm). h Immunofluorescent stains of paraffin embedded and sectioned cardiac tissues from 3 different hiPS cell lines (C2A, WT11, IMR90) after 4 weeks of intensity training detailing the formation of T-tubules (confirmed by both WGA staining and di-8-ANEPPS staining), and striated ultrastructure (actin) (scale bar: 10 μm). Similar results to those in ah were obtained independently in a minimum of 4 independent experiments.
Extended Data Figure 9
Extended Data Figure 9. Intensity training upregulates cardiac maturation within early-stage tissues through enhanced calcium handling
a,b Intensity training promotes t-tubule formation within early-stage hiPS-CM tissues as demonstrated by immunofluorescence imaging of ryanodine 2 receptor (RyR2, green), di-8-ANEPPs/t-tubules (red), and bridging integrator 1 (BIN1, blue) (scale bar = 10 μm). c Gene expression, normalized to GAPDH, of (i) ATP2A2 and (ii) SLC8A1, responsible for maintaining proper calcium homeostasis, within early-stage tissues as determined by qPCR over 4 weeks of culture for the designated stimulation regimen (independent biological replicates per group: FCT (n=8), Control/Constant (n=6), Intensity (n=14), Adult (n=1)), Mean ± 95% CI, *p<0.05 versus FCT group at week 4 by ANOVA with Tukey’s HSD test and —p<0.05 compared to other training regimens by 2-way ANOVA with Tukey’s HSD test. d Relaxation times within early-stage tissues as characterized by the Full-Width Half-Max (FWHM) values and the Decay Time (90% of the time from the maximal peak of the calcium transient). Independent biological replicates per group: FCT (n=8), C2A (n=12), WTC11 (n=6), IMR90 (n=6). Mean± 95% CI, *p<0.05 versus FCT group by ANOVA with Tukey’s HSD and — p<0.05 between cell lines by two-way ANOVA). e Representative calcium traces of early-stage tissues treated with 1 μM nifedipine. f–g Representative traces of calcium release after stimulation with 5mM caffeine in early-stage tissues and FCTs treated with f 1 mM verapamil or g 2 μM thapsigargin. h Representative traces of calcium release after stimulation with 5 mM caffeine for early-stage tissues and FCTs. i Calcium spikes (by immunofluorescent calcium dyes) in early and late-stage tissues (C2A line) after 4 weeks of culture at two [Ca2+] levels. j Intensity-trained early-stage but not late-stage tissues (C2A line) after 4 weeks of culture respond to ryanodine (1μmol/L). k The force-frequency relationship of early-stage intensity-trained cardiac tissues (C2A line) after 4 weeks of culture treated with the ryranodine blocker ryanodine (1μM) or the SERCA2a blocker thapsigargin (1μM) (directly measured force data, n=13 biologically independent samples for Intensity group and n=3 biologically independent samples for other groups), Mean ± 95% CI, —P<0.05 by two-way ANOVA.
Extended Data Figure 10
Extended Data Figure 10. Intensity training within early-stage tissues enables physiologically relevant drug responses and the development of a pathological hypertrophy disease model
a Calcium intensity measurements and b Relaxation time obtained by measuring the time from the peak to 90% of the relaxation (R90) during electrical pacing at 1 Hz within early-stage intensity trained tissues (C2A line) after 4 weeks of culture for increasing doses of Isoproterenol. n = 20 biological replicates from 6 independent experiments. Mean ± 95% CI, * p<0.05 versus baseline response by ANOVA with Tukey’s HSD test. c Cell Area over 4 weeks of culture for the designated stimulation regimen. n = 10 biological replicates from 5 independent experiments. Mean ± 95% CI, lines: p<0.05 compared to other training regimens by 2-way ANOVA with Tukey’s HSD test. d Frequency of contractions in healthy (C2A) and hypertrophic (HCM) heart tissues over 4 weeks of culture. n = 12 independent biological samples from 5 independent experiments, Mean ± 95% CI. e Relaxation times within early-stage tissues (C2A line) and early stage hypertrophy tissues (HCM) as characterized by the Full-Width Half-Max (FWHM) values and the Decay Time (90% of the time from the maximal peak of the calcium transient). n = 20 biological replicates from 4 independent experiments, Mean ± 95% CI; lines: p<0.05 compared to other training regimens by 2-way ANOVA with Tukey’s HSD test. f Early-stage intensity trained hypertrophy tissues demonstrate impaired frequency-dependent acceleration of relaxation (FDAR), as shown for each stimulation frequency by individual traces of calcium peaks.
Figure 1
Figure 1. Intensity-training of early-stage cardiac tissues enhances maturation
Data are shown as mean ± 95% CI; sample sizes detailed in SI: Main Figure Data Sample Sizes. a Experimental design: early-stage or late-stage iPS-CMs and supporting fibroblasts were encapsulated in fibrin hydrogel to form tissues stretched between two elastic pillars and forced to contract by electrical stimulation. Gradual increase in frequency to supra-physiological levels (intensity regime) was compared to stimulation at constant frequency (constant regime), unstimulated controls, and human adult and fetal heart ventricles. b Gene expression data for six groups of cardiac tissues, adult and fetal heart ventricles. c Action potential for the early/intensity group. d IK1 current-voltage (I–V) curves (mean ± s.d.). e Early/intensity tissues, but not the other groups, developed a positive force-frequency relationship for all three iPS lines (C2A, WTC11, IMR90) after 4 weeks of culture. f Cell area over time.
Figure 2
Figure 2. Enhanced cardiac ultrastructure, bioenergetics, and t-tubule formation in early/intensity tissues
Data after 4 weeks of culture (C2A cell line) are shown as mean ± 95% CI; sample sizes detailed in SI Main Figure Data Sample Sizes. a Transmission electron micrographs (scale bar: 1 μm). b Registers of sarcomeres with A- and I-bands, and M- and Z-lines, sarcoplasmic reticulum and t-tubules (scale bar: 1 μm). c Density of mitochondria; shaded area represents values from adult human heart. d Lipid droplets (red asterisk, scale bar: 1 μm). e Oxygen consumption rate. f Extracellular acidification rate. g Sections taken to evaluate t-tubules (bright field, scale bar: 500 μm). h–i t-tubule system (green: WGA; red: cTnT; blue: nuclei; scale bar: 10 μm). j–k Calcium handling ultrastructure (scale bar: 15 μm). k Regular spacing of calcium handling proteins.
Figure 3
Figure 3. Mature calcium handling in early/intensity tissues
Data after 4 weeks of culture (C2A cell line) are shown as mean ± 95% CI; sample sizes detailed in SI Main Figure Data Sample Sizes; * = p<0.05 versus FCT using one-way ANOVA followed by Tukey’s HSD test; lines = p<0.05 versus other training regimens using two-way ANOVA followed by Tukey’s HSD test. a Force of contraction during the CICR. b–c FDAR, shown by traces of calcium. d Calcium release after stimulation with 5 mM caffeine. e Force traces during post-rest potentiation with 10 seconds of rest. f Ionotropic, g Lusitropic, and h Chronotropic dose-dependent responses. i–j Cardiac tissue models of pathological hypertrophy (HCM) reveal i decreased CICR over time, and j reversal of the positive FFR at higher pacing rates.

Comment in

References

    1. Bellin M, Marchetto MC, Gage FH, Mummery CL. Induced pluripotent stem cells: the new patient? Nature reviews Molecular cell biology. 2012;13:713–726. - PubMed
    1. Matsa E, Burridge PW, Wu JC. Human stem cells for modeling heart disease and for drug discovery. Science translational medicine. 2014;6:239ps236. - PMC - PubMed
    1. Wang G, McCain ML, Yang L, He A, Pasqualini FS. Modeling the mitochondrial cardiomyopathy of Barth syndrome with induced pluripotent stem cell and heart-on-chip technologies. Nature medicine. 2014;20:616–623. - PMC - PubMed
    1. Yazawa M, et al. Using induced pluripotent stem cells to investigate cardiac phenotypes in Timothy syndrome. Nature. 2011;471:230–234. - PMC - PubMed
    1. Yang X, Pabon L, Murry CE. Engineering adolescence: maturation of human pluripotent stem cell-derived cardiomyocytes. Circulation research. 2014;114:511–523. - PMC - PubMed

Publication types