. 2018 Mar 21:9:91.
doi: 10.3389/fendo.2018.00091. eCollection 2018.

Mathematical Modeling of the Pituitary-Thyroid Feedback Loop: Role of a TSH-T3-Shunt and Sensitivity Analysis

Affiliations

Mathematical Modeling of the Pituitary-Thyroid Feedback Loop: Role of a TSH-T3-Shunt and Sensitivity Analysis

Julian Berberich et al. Front Endocrinol (Lausanne). .

Abstract

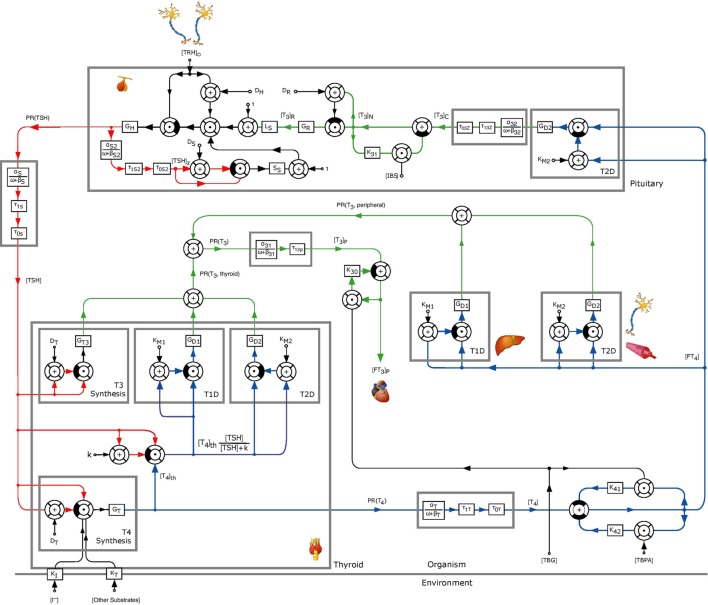
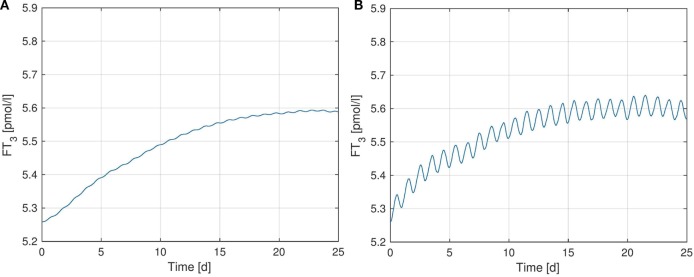
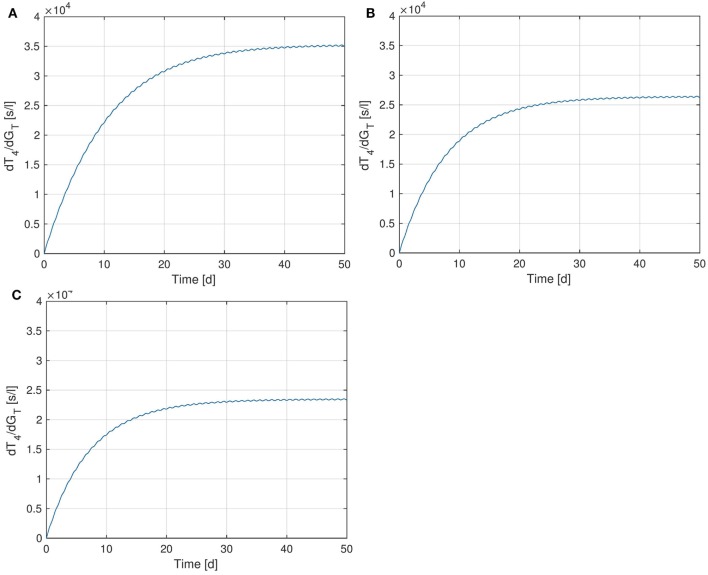
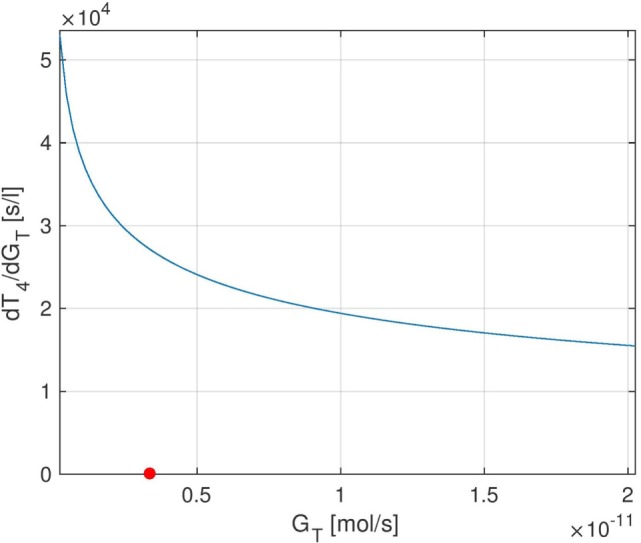
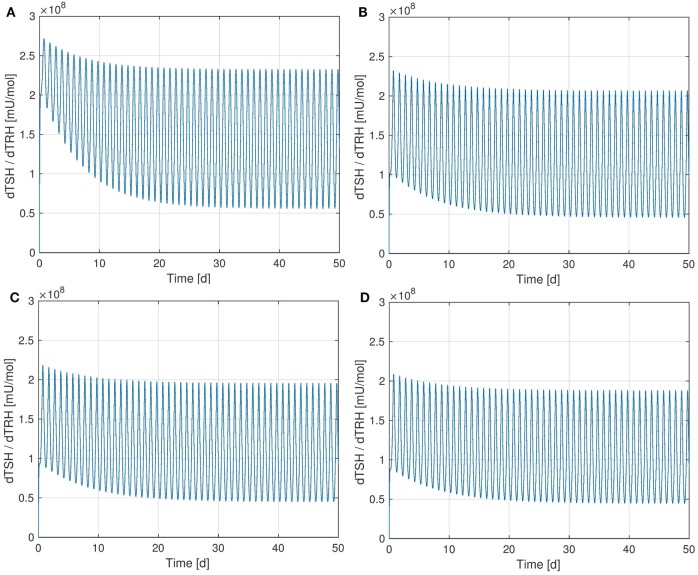
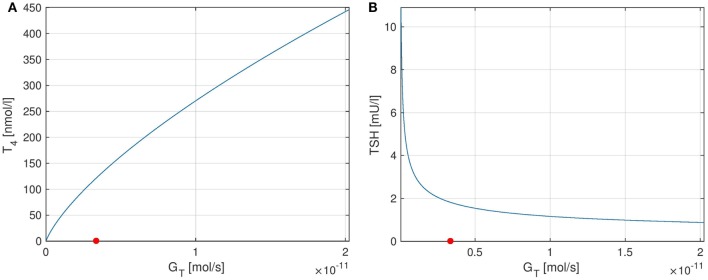
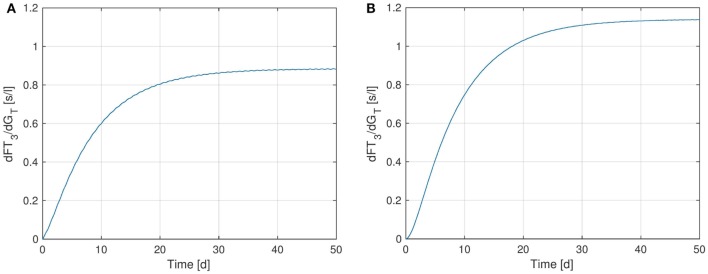
Despite significant progress in assay technology, diagnosis of functional thyroid disorders may still be a challenge, as illustrated by the vague upper limit of the reference range for serum thyrotropin (TSH). Diagnostical problems also apply to subjects affected by syndrome T, i.e., those 10% of hypothyroid patients who continue to suffer from poor quality of life despite normal TSH concentrations under substitution therapy with levothyroxine (L-T4). In this paper, we extend a mathematical model of the pituitary-thyroid feedback loop in order to improve the understanding of thyroid hormone homeostasis. In particular, we incorporate a TSH-T3-shunt inside the thyroid, whose existence has recently been demonstrated in several clinical studies. The resulting extended model shows good accordance with various clinical observations, such as a circadian rhythm in free peripheral triiodothyronine (FT3). Furthermore, we perform a sensitivity analysis of the derived model, revealing the dependence of TSH and hormone concentrations on different system parameters. The results have implications for clinical interpretation of thyroid tests, e.g., in the differential diagnosis of subclinical hypothyroidism.

Keywords: TSH-T3-shunt; diagnosis; mathematical modeling; pituitary–thyroid feedback loop; sensitivity analysis; thyroid hormones.


Figures

Figure 1
Figure 1
Block diagram of the thyrotropic feedback control loop with an additional TSH-T3-shunt, adapted from Ref. (1, 2). Except for GT3, k, and GD1, all parameters were adopted from the model in Ref. (1, 2). The parameters GD1 and GT3 were estimated to obtain an optimal (in a least squares sense) fit to measured in vivo FT3-concentrations. To this end, the value of k was normalized to 1 mU/l.
Figure 2
Figure 2
Set of optimal (in a least-squares sense) parameters GT3 and GD1 when normalizing the parameter k to 1 mU/l. Due to the affine dependence of FT3,eq (GT3, k, GD1) on GT3 and GD1, the set of optimal parameters is contained in a one-dimensional affine subspace of R2.
Figure 3
Figure 3
FT3-plots [pmoll] over a simulation horizon of 25 days for several configurations of the TSH-T3-Shunt. The parameters GT3 and GD1 are identified via least squares optimization, separately for each model configuration. (A) No shunt included. (B) Full TSH-T3-shunt.
Figure 4
Figure 4
Sensitivity of T4 w.r.t. GT for different values of GT. (A) GT=1.21012mols, (B) GT=3.3751012mols - nominal value, (C) GT=51012mols.
Figure 5
Figure 5
Stationary sensitivity of T4 w.r.t. GT as a GT-dependent function. The red point indicates the nominal GT-value from Ref. (1).
Figure 6
Figure 6
Sensitivity of TSH w.r.t. TRH for different values of SS. (A) SS=0lmU, (B) SS=50lmU, (C) SS=100lmU - nominal value, (D) SS=200lmU.
Figure 7
Figure 7
Plots of equilibrium T4 and TSH levels depending on the thyroid’s secretory capacity GT. The red point in the figures indicates the nominal GT-value from Ref. (1). (A) Equilibrium T4, (B) equilibrium TSH.
Figure 8
Figure 8
Sensitivity of FT3 w.r.t. GT for two versions of the HPT axis model: one incorporating the TSH-T3-shunt and one without this extension. (A) Full TSH-T3-shunt, (B) no shunt included.
Figure 9
Figure 9
Plots of the stationary sensitivity of FT3 w.r.t. the parameter GT as a function of the thyroid’s secretory capacity GT. Two configurations of the model are shown: one including the TSH-T3-shunt and one without the shunt. The red point in the Figures indicates the nominal GT-value from Ref. (1). (A) Full TSH-T3-shunt, (B) no shunt included.

Similar articles

Cited by

References

    1. Dietrich JW. Der Hypophysen-Schilddrüsen-Regelkreis: Entwicklung und klinische Anwendung eines nichtlinearen Modells. In: Schardt F, editor. Spektrum medizinischer Forschung (Vol. 2), Berlin: Logos-Verlag; (2002).
    1. Dietrich JW, Tesche A, Pickardt CR, Mitzdorf U. Thyrotropic feedback control: evidence for an additional ultrashort feedback loop from fractal analysis. Cybern Syst (2004) 35(4):315–31.10.1080/01969720490443354 - DOI
    1. Eisenberg M, Samuels M, DiStefano JJ, III. Extensions, validation, and clinical applications of a feedback control system simulator of the hypothalamo-pituitary-thyroid axis. Thyroid (2008) 18(10):1071–85.10.1089/thy.2007.0388 - DOI - PMC - PubMed
    1. Dietrich JW, Landgrafe G, Fotiadou EH. TSH and thyrotropic agonists: key actors in thyroid homeostasis. J Thyroid Res (2012) 2012:29.10.1155/2012/351864 - DOI - PMC - PubMed
    1. Hoermann R, Midgley JE, Larisch R, Dietrich JW. Homeostatic control of the thyroid-pituitary axis: perspectives for diagnosis and treatment. Front Endocrinol (2015) 6:177.10.3389/fendo.2015.00177 - DOI - PMC - PubMed

LinkOut - more resources