

CRISPR/Cas9-induced shank3b mutant zebrafish display autism-like behaviors
- PMID: 29619162
- PMCID: PMC5879542
- DOI: 10.1186/s13229-018-0204-x
CRISPR/Cas9-induced shank3b mutant zebrafish display autism-like behaviors
Abstract
Background: Human genetic and genomic studies have supported a strong causal role of SHANK3 deficiency in autism spectrum disorder (ASD). However, the molecular mechanism underlying SHANK3 deficiency resulting in ASD is not fully understood. Recently, the zebrafish has become an attractive organism to model ASD because of its high efficiency of genetic manipulation and robust behavioral phenotypes. The orthologous gene to human SHANK3 is duplicated in the zebrafish genome and has two homologs, shank3a and shank3b. Previous studies have reported shank3 morphants in zebrafish using the morpholino method. Here, we report the generation and characterization of shank3b mutant zebrafish in larval and adult stages using the CRISPR/Cas9 genome editing technique.
Methods: CRISPR/Cas9 was applied to generate a shank3b loss-of-function mutation (shank3b-/- ) in zebrafish. A series of morphological measurements, behavioral tests, and molecular analyses were performed to systematically characterize the behavioral and molecular changes in shank3b mutant zebrafish.
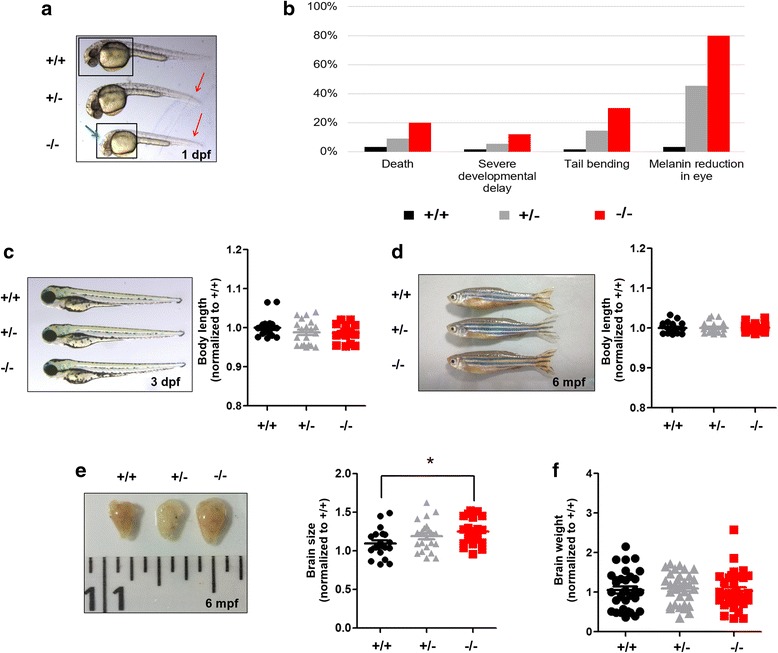
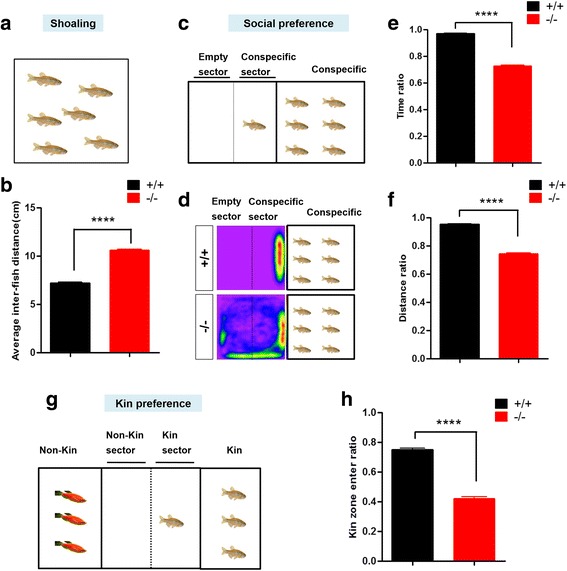
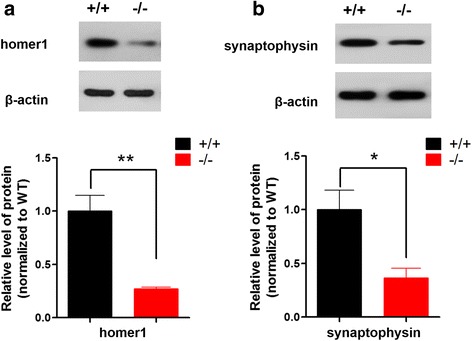
Results: shank3b-/- zebrafish exhibited abnormal morphology in early development. They showed reduced locomotor activity both as larvae and adults, reduced social interaction and time spent near conspecifics, and significant repetitive swimming behaviors. Additionally, the levels of both postsynaptic homer1 and presynaptic synaptophysin were significantly reduced in the adult brain of shank3b-deficient zebrafish.
Conclusions: We generated the first inheritable shank3b mutant zebrafish model using CRISPR/Cas9 gene editing approach. shank3b-/- zebrafish displayed robust autism-like behaviors and altered levels of the synaptic proteins homer1 and synaptophysin. The versatility of zebrafish as a model for studying neurodevelopment and conducting drug screening will likely have a significant contribution to future studies of human SHANK3 function and ASD.
Keywords: ASD; Animal model; CRISPR/Cas9; Social behavior; Zebrafish; shank3.
Conflict of interest statement
The study was approved by the Institutional Review Board of Children’s Hospital of Fudan University, China ([2013]024).The authors declare that they have no competing interests.Springer Nature remains neutral with regard to jurisdictional claims in published maps and institutional affiliations.
Figures


Similar articles
-
Intestinal dysmotility in a zebrafish (Danio rerio) shank3a;shank3b mutant model of autism.Mol Autism. 2019 Jan 31;10:3. doi: 10.1186/s13229-018-0250-4. eCollection 2019. Mol Autism. 2019. PMID: 30733854 Free PMC article.
-
Replicable in vivo physiological and behavioral phenotypes of the Shank3B null mutant mouse model of autism.Mol Autism. 2017 Jun 15;8:26. doi: 10.1186/s13229-017-0142-z. eCollection 2017. Mol Autism. 2017. PMID: 28638591 Free PMC article.
-
Two knockdown models of the autism genes SYNGAP1 and SHANK3 in zebrafish produce similar behavioral phenotypes associated with embryonic disruptions of brain morphogenesis.Hum Mol Genet. 2015 Jul 15;24(14):4006-23. doi: 10.1093/hmg/ddv138. Epub 2015 Apr 16. Hum Mol Genet. 2015. PMID: 25882707 Free PMC article.
-
Zebrafish as a tool for autism research: unraveling the roles of Shank3, Cntnap2, Neuroligin3, and Arid1b in synaptic and behavioral abnormalities.Neurogenetics. 2025 Jun 6;26(1):48. doi: 10.1007/s10048-025-00828-5. Neurogenetics. 2025. PMID: 40478461 Review.
-
Comparison of SHANK3 deficiency in animal models: phenotypes, treatment strategies, and translational implications.J Neurodev Disord. 2021 Nov 16;13(1):55. doi: 10.1186/s11689-021-09397-8. J Neurodev Disord. 2021. PMID: 34784886 Free PMC article. Review.
Cited by
-
Age-related alterations in the behavioral response to a novel environment in the African turquoise killifish (Nothobranchius furzeri).Front Behav Neurosci. 2024 Jan 8;17:1326674. doi: 10.3389/fnbeh.2023.1326674. eCollection 2023. Front Behav Neurosci. 2024. PMID: 38259633 Free PMC article.
-
Modelling Autism Spectrum Disorder (ASD) and Attention-Deficit/Hyperactivity Disorder (ADHD) Using Mice and Zebrafish.Int J Mol Sci. 2022 Jul 7;23(14):7550. doi: 10.3390/ijms23147550. Int J Mol Sci. 2022. PMID: 35886894 Free PMC article. Review.
-
Zebrafish Larvae as a Behavioral Model in Neuropharmacology.Biomedicines. 2019 Mar 26;7(1):23. doi: 10.3390/biomedicines7010023. Biomedicines. 2019. PMID: 30917585 Free PMC article. Review.
-
Understanding autism spectrum disorders with animal models: applications, insights, and perspectives.Zool Res. 2021 Nov 18;42(6):800-824. doi: 10.24272/j.issn.2095-8137.2021.251. Zool Res. 2021. PMID: 34755500 Free PMC article. Review.
-
An integrated systems-level model of ochratoxin A toxicity in the zebrafish (Danio rerio) embryo based on NMR metabolic profiling.Sci Rep. 2022 Apr 15;12(1):6341. doi: 10.1038/s41598-022-09726-4. Sci Rep. 2022. PMID: 35428752 Free PMC article.
References
Publication types
MeSH terms
Substances
Grants and funding
LinkOut - more resources
Full Text Sources
Other Literature Sources
Molecular Biology Databases
