. 2017 Nov 3;9(2):495-501.
doi: 10.1039/c7sc03784h. eCollection 2018 Jan 14.

Deformylation reaction-based probe for in vivo imaging of HOCl

Affiliations

Deformylation reaction-based probe for in vivo imaging of HOCl

Peng Wei et al. Chem Sci. .

Abstract

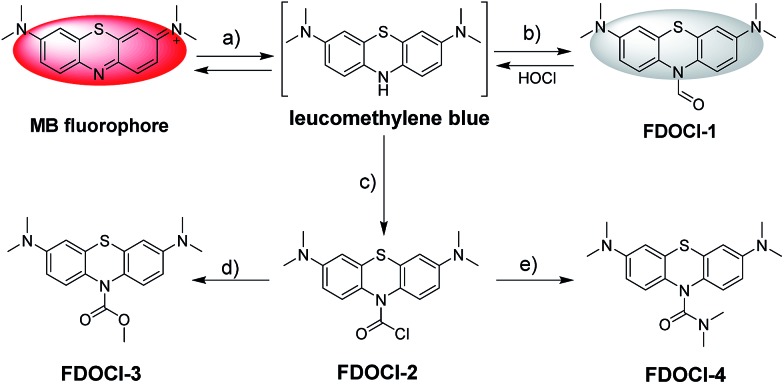
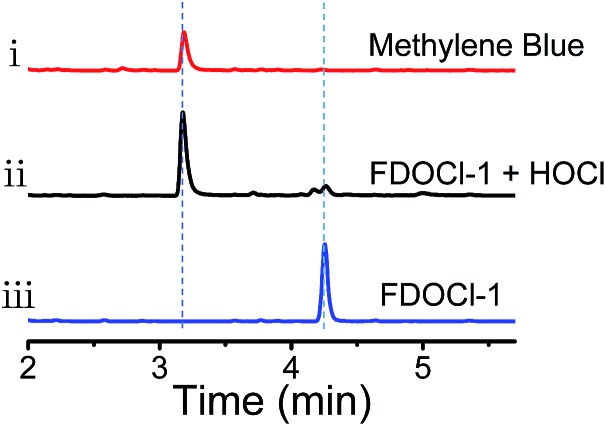
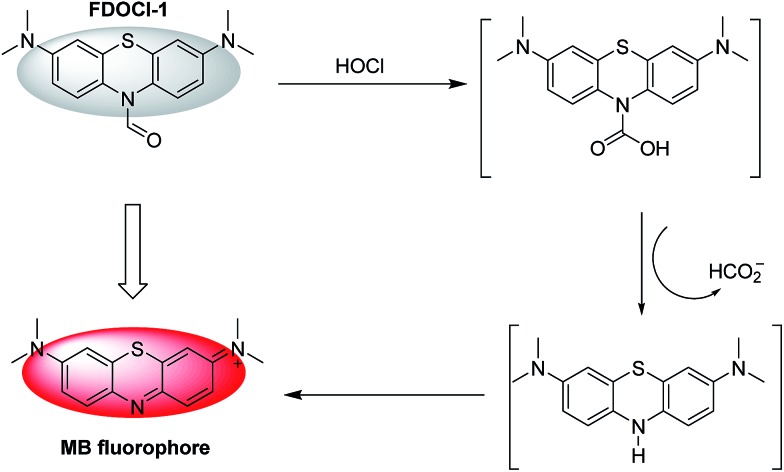
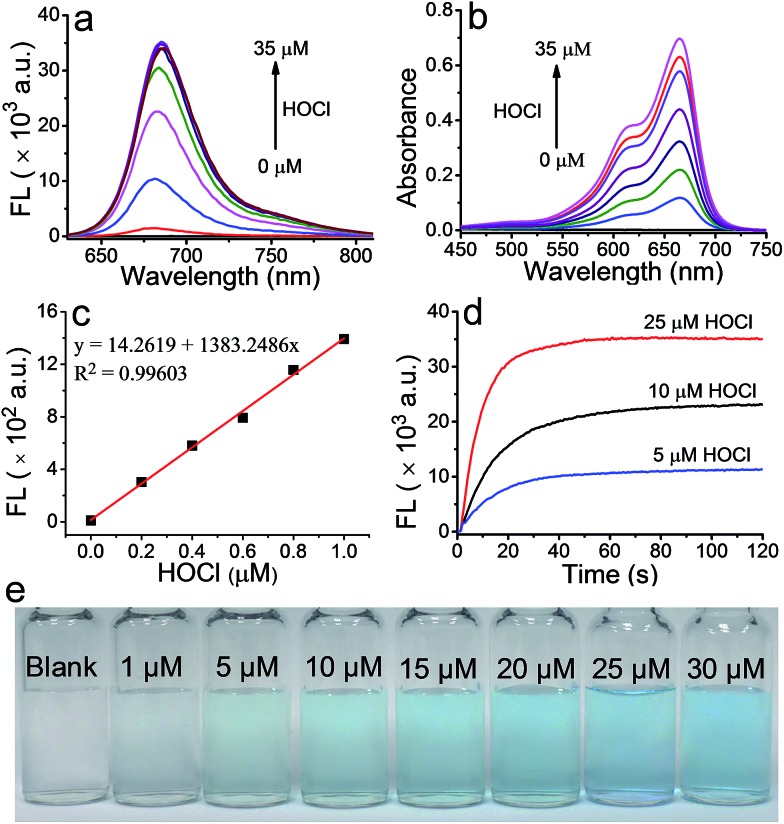
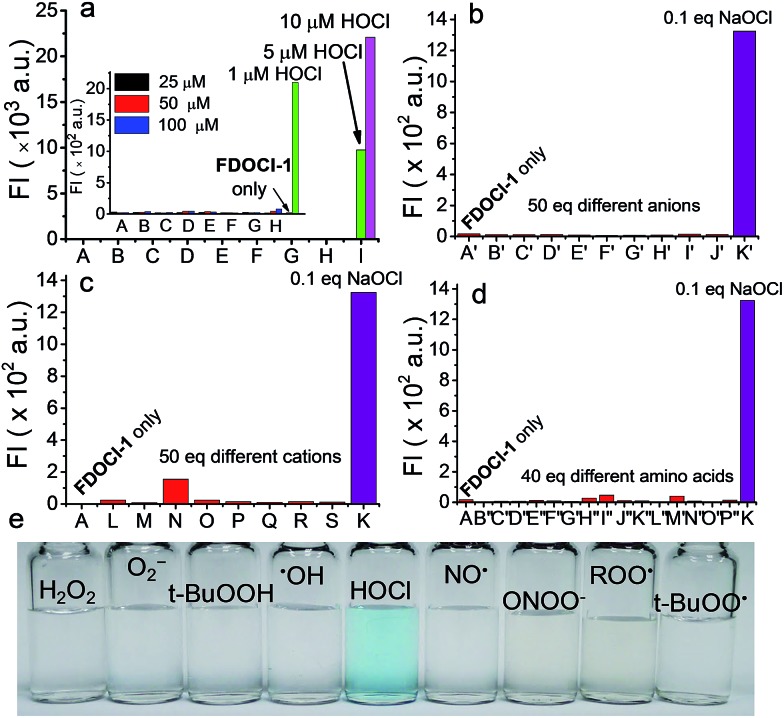
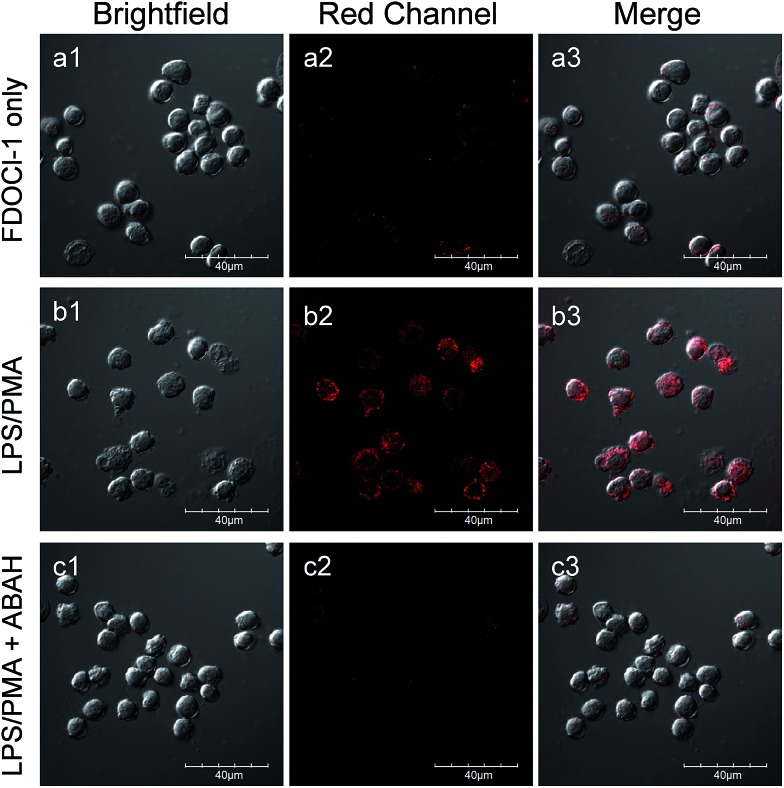
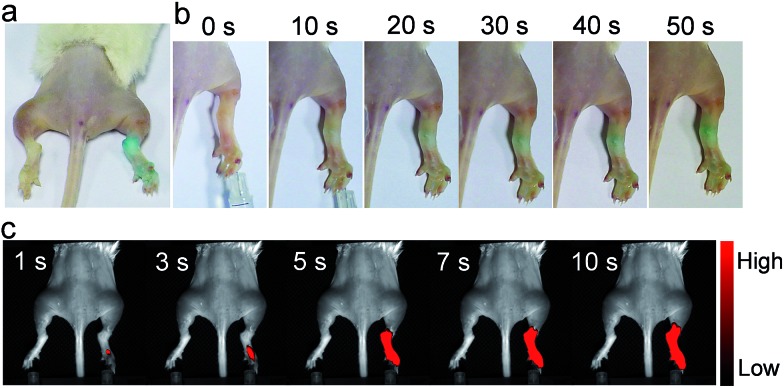
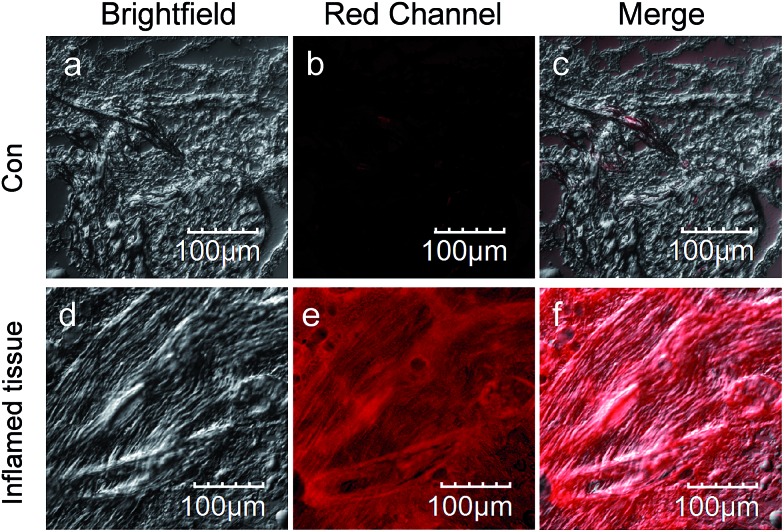
The detection of hypochlorous acid (HOCl) in vivo is vitally important because the local concentration of HOCl is highly correlated with some diseases such as atherosclerosis and rheumatoid arthritis. However, in vivo detection of HOCl remains a challenge due to the lack of a suitable probe. We report here a near-infrared (NIR) emissive "turn-on" probe (FDOCl-1) based on a methylene blue derivative, which can quickly detect HOCl via a newly found deformylation mechanism. FDOCl-1 displays remarkable selectivity and sensitivity towards HOCl. The dramatic changes in colour and NIR emission were used to detect HOCl in vitro and in vivo in a mouse arthritis model.


Figures

Scheme 1
Scheme 1. Structures and detecting mechanisms of prepared probes for HOCl. The reagents are: (a) Na2S2O4 and Na2CO3; (b) the Vilsmeier–Haack reagent; (c) bis(trichloromethyl) carbonate; (d) 4-dimethylaminopyridine, Na2CO3 and MeOH; and (e) Na2CO3 and dimethylamine.
Fig. 1
Fig. 1. HPLC analysis of the aqueous solution from (i) 10 μM methylene blue, (ii) 10 μM FDOCl-1 + 25 μM HOCl and (iii) 10 μM FDOCl-1 (254 nm).
Scheme 2
Scheme 2. The proposed mechanism of the reaction of FDOCl-1 with HOCl.
Fig. 2
Fig. 2. (a) Fluorescence and (b) absorption spectra of FDOCl-1 (10 μM in 10 mM PBS, pH 7.2) in the presence of different concentrations of HOCl; (c) the linear relationship between the fluorescence intensity at 686 nm and the concentration of HOCl; (d) time-dependent changes in the fluorescence intensity of FDOCl-1 (10 μM) at 686 nm after adding different concentrations of HOCl; and (e) colour changes of FDOCl-1 (10 μM) after adding different concentrations of HOCl (time range 0–120 s, λex = 620 nm).
Fig. 3
Fig. 3. Fluorescence intensity of FDOCl-1 (10 μM in 10 mM PBS, pH 7.2) at 686 nm after (a) adding various ROS/RNS (from (A) to (H): H2O2, O2–, t-BuOOH, ˙OH, NO, ONOO, ROO˙ and t-BuOO˙ with concentrations of 25, 50 and 100 μM and (I): HOCl with a concentration of 1, 5 and 10 μM; the inset shows magnified data comparing A to H with 1 μM HOCl), (b) adding various anions (from (A′) to (K′): blank, CH3COO, CO32–, SO42–, Cl, ClO4, F, I, NO2, S2O32– and OCl), (c) adding various cations (from (L) to (S): Al3+, Ca2+, Cu2+, Fe3+, K+, Mg2+, NH4+ and Ni+) and (d) adding various amino acids (from (B′′) to (P′′): Leu, Pro, Gly, Gln, Glu, Met, Lys, Trp, Ser, Thr, Asp, Ile, Val, His and Ala). (e) Colour changes of FDOCl-1 (10 μM) after adding HOCl (25 μM) and other different ROS/RNS (100 μM) with λex = 620 nm.
Fig. 4
Fig. 4. CLSM images of live RAW 264.7 macrophages incubated with FDOCl-1 (10 μM) for 60 min, washed with PBS buffer (a1–a3) then stimulated with (b1–b3) LPS (1 μg mL–1)/PMA (500 ng mL–1) or (c1–c3) LPS (1 μg mL–1)/PMA (500 ng mL–1)/ABAH (250 μM) for 1 h. CLSM imaging was performed on an Olympus FV1000 confocal scanning system with a 60× immersion objective lens. Red channel: 700 ± 50 nm, λex = 633 nm.
Fig. 5
Fig. 5. In vivo images of the mouse model of arthritis. Colour changes observed by the naked eye (a) more than 2 min after injection of FDOCl-1 and (b) 0–50 s after injection of FDOCl-1; (c) fluorescence images taken 1–10 s after injection of FDOCl-1. The arthritis model was generated by injecting λ-carrageenan (100 μL, 5 mg mL–1 in PBS) into the right tibiotarsal joint (right ankle); the left tibiotarsal joint (left ankle) was used as a control. The fluorescence signal was collected at λem = 720 ± 60 nm under excitation by a 635 nm continuous wave (CW) laser with a power density of 0.3 mW cm–2; FDOCl-1: 100 μL and 1 mM.
Fig. 6
Fig. 6. CLSM images of frozen sections prepared from mice with λ-carrageenan (100 μL, 5 mg mL–1 in PBS) induced arthritis. Inflamed tissue: sections isolated from the arthritic area. Con: sections isolated from the normal area. CLSM imaging was performed on an Olympus FV1000 confocal scanning system with a 20× immersion objective lens. Red channel: 700 ± 50 nm, λex = 633 nm.

References

    1. Chen X., Wang F., Hyun J. Y., Wei T., Qiang J., Ren X., Shin I., Yoon J. Chem. Soc. Rev. 2016;45:2976–3016. - PubMed
    1. Nathan C. J. Clin. Invest. 2003;111:769–778. - PMC - PubMed
    1. Yang Y., Zhao Q., Feng W., Li F. Chem. Rev. 2013;113:192–270. - PubMed
    1. Meng L., Wu Y., Yi T. Chem. Commun. 2014;50:4843–4845. - PubMed
    1. Wen Y., Liu K., Yang H., Li Y., Lan H., Liu Y., Zhang X., Yi T. Anal. Chem. 2014;86:9970–9976. - PubMed