. 2018 Feb 28;2(4):393-406.
doi: 10.1002/hep4.1165. eCollection 2018 Apr.

The Role of Intestinal C-type Regenerating Islet Derived-3 Lectins for Nonalcoholic Steatohepatitis

Affiliations

The Role of Intestinal C-type Regenerating Islet Derived-3 Lectins for Nonalcoholic Steatohepatitis

Sena Bluemel et al. Hepatol Commun. .

Abstract

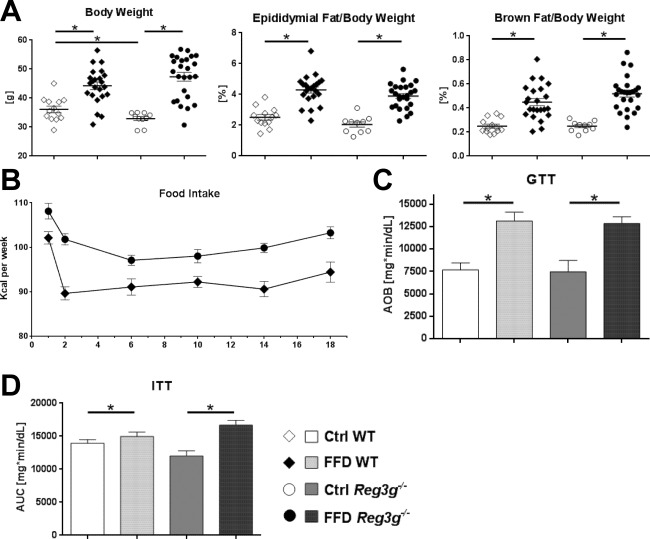
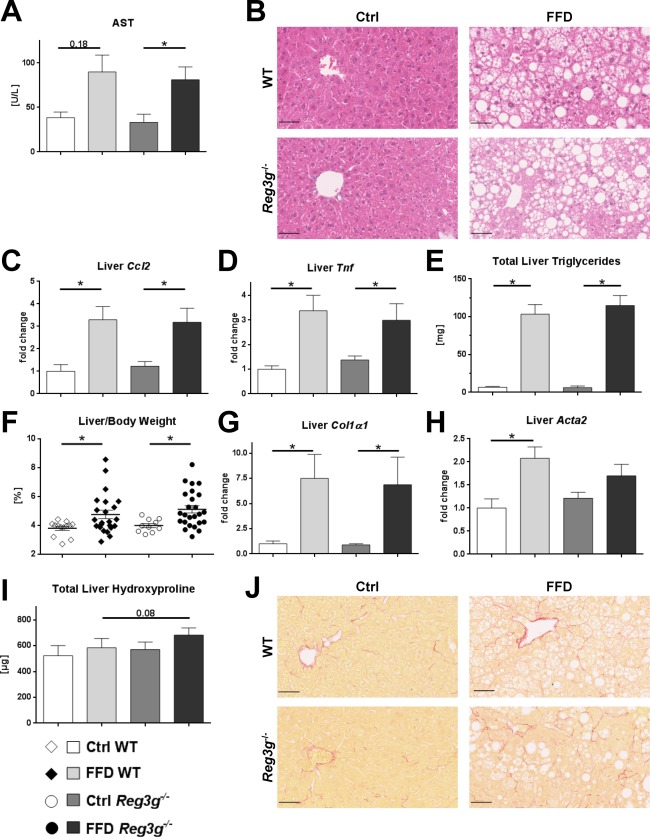
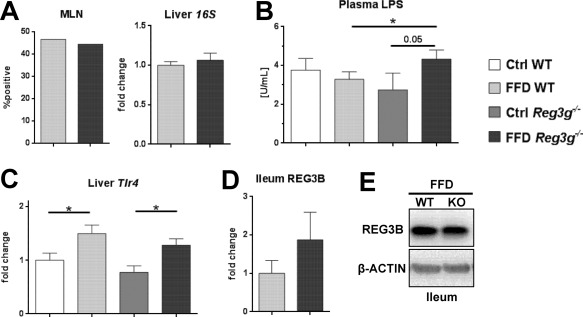
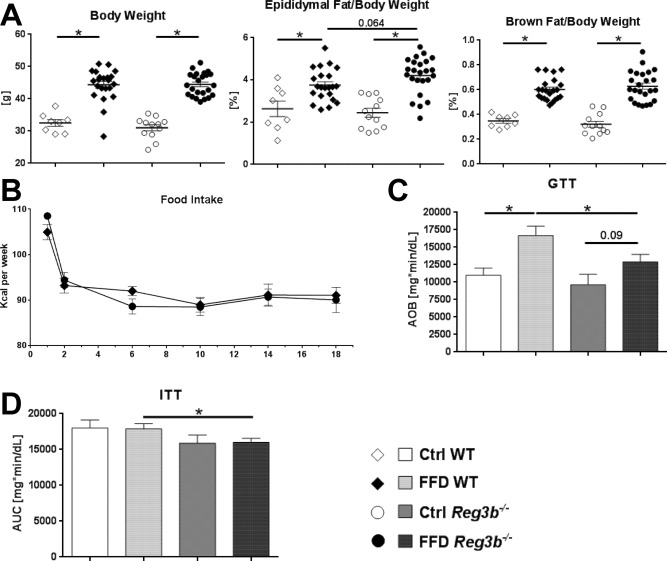
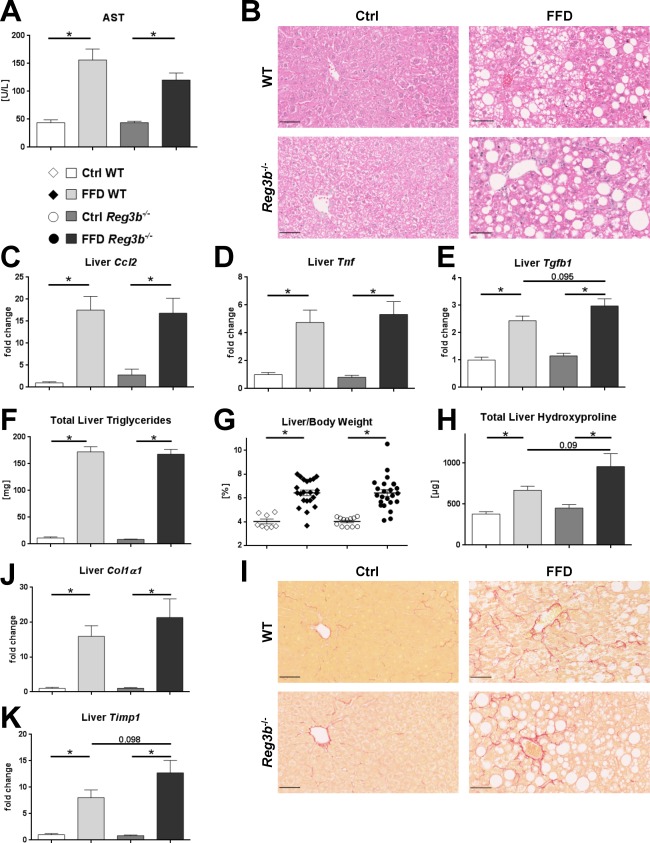
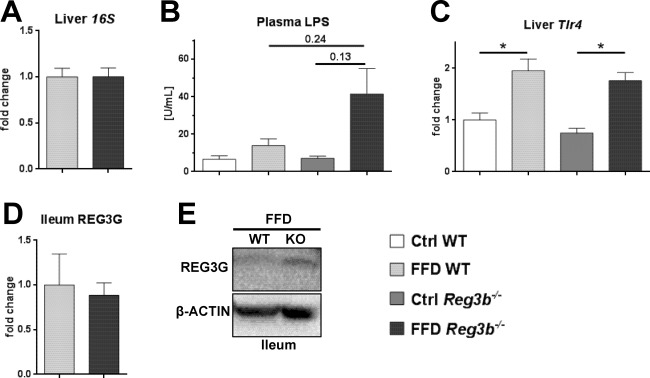
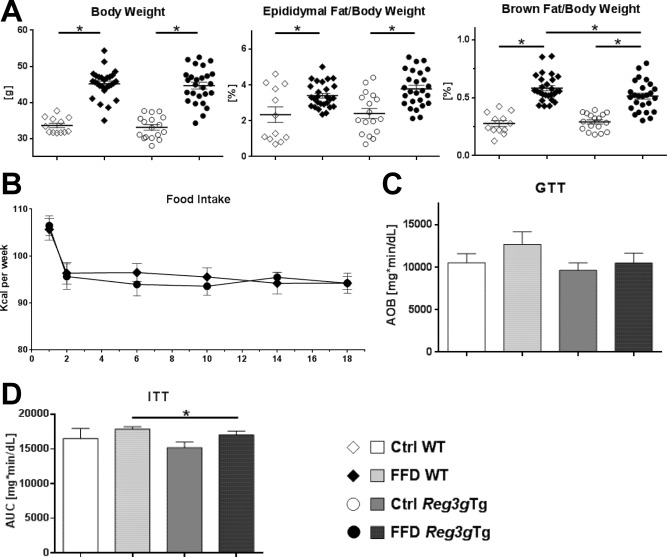
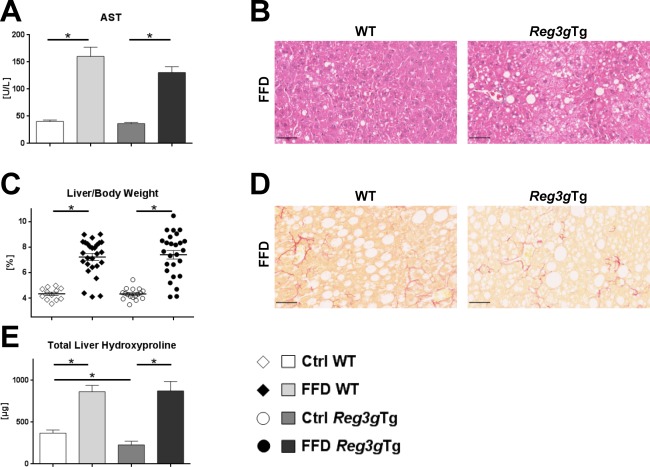
C-type regenerating islet derived-3 (Reg3) lectins defend against pathogens and keep commensal bacteria at a distance. Deficiency of Reg3g and Reg3b facilitates alcohol-induced bacterial translocation and alcoholic liver disease. Intestinal Reg3g is down-regulated in animal models of diet-induced obesity, but the functional consequences for nonalcoholic steatohepatitis (NASH) are unknown. The aim of this study was to investigate the role of Reg3 lectins in NASH. NASH was induced by a Western-style fast-food diet in mice deficient for Reg3g or Reg3b and in transgenic mice overexpressing Reg3g in intestinal epithelial cells (Reg3gTg). Glucose tolerance was assessed after 18 weeks and insulin resistance after 19 weeks of feeding. After 20 weeks, mice were assessed for features of the metabolic syndrome. Obesity was not different in genetically modified mice compared with their respective wild-type littermates. Glucose intolerance, liver injury, hepatic inflammation, steatosis, fibrosis, and bacterial translocation to mesenteric lymph nodes and to the liver were not different in Reg3g-deficient mice compared with wild-type littermates. Plasma endotoxin levels were higher in Reg3g-deficient mice. Reg3b deficiency protected against glucose intolerance, but liver disease, bacterial translocation, and plasma endotoxin levels were similar to wild-type littermates. Absence of either REG3G or REG3B protein in the ileum was not compensated for by up-regulation of the respective other REG3 protein. Transgenic Reg3g mice also developed liver injury, steatosis, and fibrosis similar to their wild-type littermates. Conclusion: In contrast to alcoholic liver disease, loss of intestinal Reg3 lectins is not sufficient to aggravate diet-induced obesity and NASH. This supports a multi-hit pathogenesis in NASH. Only glucose metabolism is affected by Reg3b deficiency. (Hepatology Communications 2018;2:393-406).


Figures

Figure 1
Figure 1
Effect of Reg3g deficiency on body weight and metabolic function. (A) Body weight, and relative weights of epididymal and brown fat tissues after 20 weeks of feeding. (B) Food intake per group over the course of the experiment. (C) Glucose tolerance test performed after 18 weeks of feeding. (D) Insulin tolerance test performed after 19 weeks of feeding. Data represent mean ± SEM; *P < 0.05. Refer to http://onlinelibrary.wiley.com/doi/10.1002/hep4.1165/full for numbers of biological replicates. Abbreviation: AUC, area under the curve.
Figure 2
Figure 2
Effect of Reg3g deficiency on liver phenotype. (A) AST plasma levels. (B) Representative hematoxylin and eosin‐stained liver sections. (C,D) Expression of inflammatory genes in liver samples. (E) Total amount of triglycerides per liver. (F) Relative liver weight. (G,H) Expression of fibrosis‐related genes in liver samples. (I) Total amount of hydroxyproline per liver. (J) Representative sirius red‐stained liver sections. Scale bars, 50 μm. Data represent mean ± SEM; *P < 0.05. Refer to http://onlinelibrary.wiley.com/doi/10.1002/hep4.1165/full for numbers of biological replicates.
Figure 3
Figure 3
Effect of Reg3g deficiency on bacterial translocation. (A) Results of anaerobic mesenteric lymph node cultures and total bacteria in liver specimens. (B) Plasma lipopolysaccharide levels. (C) Expression of Tlr4 in liver samples. (D) REG3B protein expression in ileal samples. (E) Representative REG3B expression in ileal samples of FFD‐fed WT and Reg3g−/− mice. Data represent mean ± SEM; *P < 0.05. Refer to http://onlinelibrary.wiley.com/doi/10.1002/hep4.1165/full for numbers of biological replicates. Abbreviation: KO, knockout.
Figure 4
Figure 4
Effect of Reg3b deficiency on body weight and metabolic function. (A) Body weight and relative weights of epididymal and brown fat tissues after 20 weeks of feeding. (B) Food intake per group over the course of the experiment (C) Glucose tolerance test performed after 18 weeks of feeding. (D) Insulin tolerance test performed after 19 weeks of feeding. Data represent mean ± SEM; *P < 0.05. Refer to http://onlinelibrary.wiley.com/doi/10.1002/hep4.1165/full for numbers of biological replicates. Abbreviations: AOB, area over baseline; AUC, area under the curve.
Figure 5
Figure 5
Effect of Reg3b deficiency on liver phenotype. (A) AST plasma levels. (B) Representative hematoxylin and eosin‐stained liver sections. (C‐E) Expression of inflammatory genes in liver samples. (F) Total amount of triglycerides per liver. (G) Relative liver weight. (H) Total amount of hydroxyproline per liver. (I) Representative sirius red‐stained liver sections. (J,K) Expression of fibrosis‐related genes in liver samples. Scale bars, 50 μm. Data represent mean ± SEM; *P < 0.05. Refer to http://onlinelibrary.wiley.com/doi/10.1002/hep4.1165/full for numbers of biological replicates.
Figure 6
Figure 6
Effect of Reg3b deficiency on bacterial translocation. (A) Total bacteria in liver specimens. (B) Plasma LPS levels. (C) Expression of Tlr4 in liver samples. (D) REG3G protein expression in ileal samples. (E) Representative REG3G expression in ileal samples of FFD‐fed WT and Reg3g−/− mice. Data represent mean ± SEM; *P < 0.05. Refer to http://onlinelibrary.wiley.com/doi/10.1002/hep4.1165/full for numbers of biological replicates. Abbreviation: KO, knockout.
Figure 7
Figure 7
Effect of Reg3g overexpression on body weight and metabolic function. (A) Body weight and relative weights of epididymal and brown fat tissues after 20 weeks of feeding. (B) Food intake per group over the course of the experiment. (C) Glucose tolerance test performed after 18 weeks of feeding. (D) Insulin tolerance test performed after 19 weeks of feeding. Data represent mean ± SEM; *P < 0.05. Refer to http://onlinelibrary.wiley.com/doi/10.1002/hep4.1165/full for numbers of biological replicates. Abbreviations: AOB, area over baseline; AUC, area under the curve.
Figure 8
Figure 8
Effect of Reg3g overexpression on liver phenotype and bacterial translocation. (A) AST plasma levels. (B) Representative hematoxylin and eosin‐stained liver sections. (C) Relative liver weight. (D) Representative sirius red‐stained liver sections. (E) Total amount of hydroxyproline per liver. Scale bars, 50 μm. Data represent mean ± SEM; *P < 0.05. Refer to http://onlinelibrary.wiley.com/doi/10.1002/hep4.1165/full for numbers of biological replicates.

References

    1. Diehl AM, Day C. Cause, pathogenesis, and treatment of nonalcoholic steatohepatitis. N Engl J Med 2017;377:2063‐2072. - PubMed
    1. Llopis M, Cassard AM, Wrzosek L, Boschat L, Bruneau A, Ferrere G, et al. Intestinal microbiota contributes to individual susceptibility to alcoholic liver disease. Gut 2016;65:830‐839. - PubMed
    1. Boursier J, Mueller O, Barret M, Machado M, Fizanne L, Araujo‐Perez F, et al. The severity of nonalcoholic fatty liver disease is associated with gut dysbiosis and shift in the metabolic function of the gut microbiota. Hepatology 2016;63:764‐775. - PMC - PubMed
    1. Hartmann P, Seebauer CT, Mazagova M, Horvath A, Wang L, Llorente C, et al. Deficiency of intestinal mucin‐2 protects mice from diet‐induced fatty liver disease and obesity. Am J Physiol Gastrointest Liver Physiol 2016;310:G310‐G322. - PMC - PubMed
    1. Le Roy T, Llopis M, Lepage P, Bruneau A, Rabot S, Bevilacqua C, et al. Intestinal microbiota determines development of non‐alcoholic fatty liver disease in mice. Gut 2013;62:1787‐1794. - PubMed