

Characterization of the mechanical properties of cancer cells in 3D matrices in response to collagen concentration and cytoskeletal inhibitors
- PMID: 29620778
- PMCID: PMC5916796
- DOI: 10.1039/c8ib00044a
Characterization of the mechanical properties of cancer cells in 3D matrices in response to collagen concentration and cytoskeletal inhibitors
Abstract
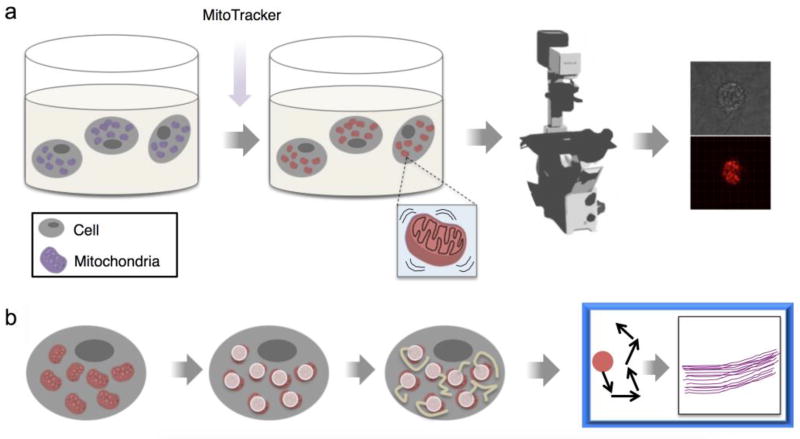
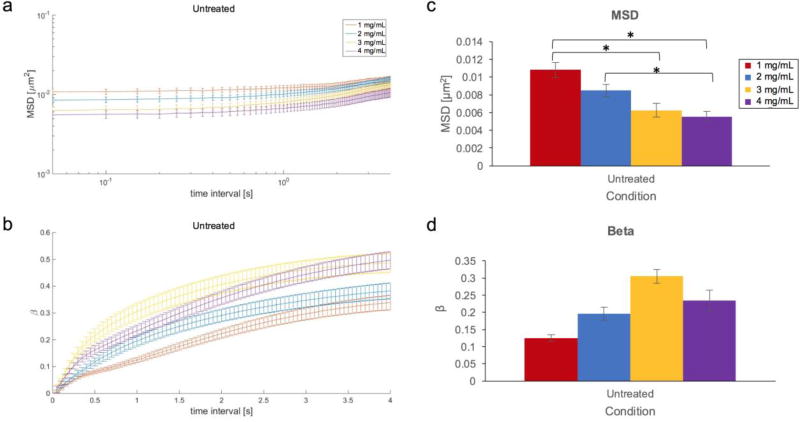
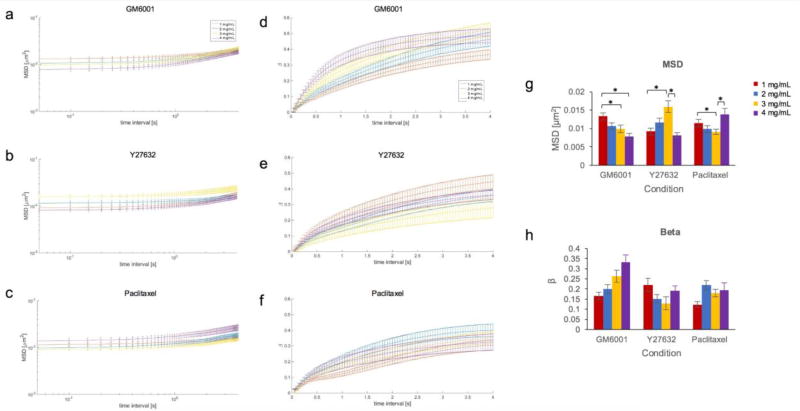
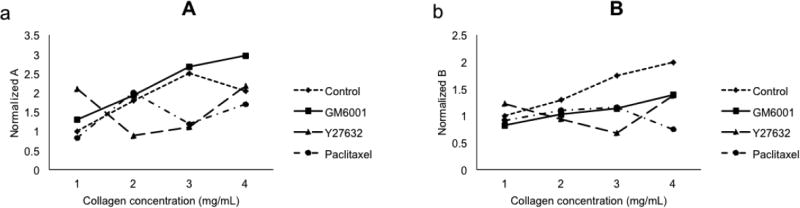
Cellular processes, such as cell migration, adhesion, and proliferation depend on the interaction between the intracellular environment and the extracellular matrix (ECM). While many studies have explored the role of the microenvironment on cell behavior, the influence of 3D matrix mechanics on intracellular activity is not completely understood. To characterize the relationship between the mechanical components of the microenvironment and intracellular behavior, we use particle-tracking microrheology of metastatic breast cancer cells embedded in 3D collagen gels to quantify the intracellular activity from which the molecular motor activity and stiffness can be determined. Our results show that increasing collagen concentration of the 3D environments leads to an increase in intracellular stiffness and motor activity. Furthermore, our studies demonstrate that intracellular fluctuations depend on collagen concentration, even in the presence of a number of frontline chemotherapeutic and anti-MMP drugs, indicating that ECM concentration is an important and indispensable parameter to consider in drug screening.
Figures
Similar articles
-
Cellular contractility and extracellular matrix stiffness regulate matrix metalloproteinase activity in pancreatic cancer cells.FASEB J. 2014 Aug;28(8):3589-99. doi: 10.1096/fj.13-245613. Epub 2014 May 1. FASEB J. 2014. PMID: 24784579
-
Integrated Analysis of Intracellular Dynamics of MenaINV Cancer Cells in a 3D Matrix.Biophys J. 2017 May 9;112(9):1874-1884. doi: 10.1016/j.bpj.2017.03.030. Biophys J. 2017. PMID: 28494958 Free PMC article.
-
Microfabricated collagen tracks facilitate single cell metastatic invasion in 3D.Integr Biol (Camb). 2013 Mar;5(3):606-16. doi: 10.1039/c3ib20196a. Integr Biol (Camb). 2013. PMID: 23388698 Free PMC article.
-
Toward single cell traction microscopy within 3D collagen matrices.Exp Cell Res. 2013 Oct 1;319(16):2396-408. doi: 10.1016/j.yexcr.2013.06.009. Epub 2013 Jun 25. Exp Cell Res. 2013. PMID: 23806281 Free PMC article. Review.
-
Cell-matrix adhesions in 3D.Matrix Biol. 2011 Sep;30(7-8):363-8. doi: 10.1016/j.matbio.2011.06.001. Epub 2011 Jun 23. Matrix Biol. 2011. PMID: 21723391 Free PMC article. Review.
Cited by
-
Unravelling cell migration: defining movement from the cell surface.Cell Adh Migr. 2022 Dec;16(1):25-64. doi: 10.1080/19336918.2022.2055520. Cell Adh Migr. 2022. PMID: 35499121 Free PMC article. Review.
-
A simple 3D cellular chemotaxis assay and analysis workflow suitable for a wide range of migrating cells.MethodsX. 2019 Nov 16;6:2807-2821. doi: 10.1016/j.mex.2019.11.001. eCollection 2019. MethodsX. 2019. PMID: 31871915 Free PMC article.
-
Mechanical Properties of the Extracellular Environment of Human Brain Cells Drive the Effectiveness of Drugs in Fighting Central Nervous System Cancers.Brain Sci. 2022 Jul 15;12(7):927. doi: 10.3390/brainsci12070927. Brain Sci. 2022. PMID: 35884733 Free PMC article. Review.
-
Cancer cells' ability to mechanically adjust to extracellular matrix stiffness correlates with their invasive potential.Mol Biol Cell. 2018 Oct 1;29(20):2378-2385. doi: 10.1091/mbc.E18-05-0319. Epub 2018 Aug 9. Mol Biol Cell. 2018. PMID: 30091653 Free PMC article.
-
Exploring Mechanical Features of 3D Head and Neck Cancer Models.J Funct Biomater. 2025 Feb 20;16(3):74. doi: 10.3390/jfb16030074. J Funct Biomater. 2025. PMID: 40137353 Free PMC article. Review.
References
-
- Dos Remedios CG, et al. Actin Binding Proteins: Regulation of Cytoskeletal Microfilaments. Physiol. Rev. 2003;83:433 LP–473. - PubMed
-
- Janmey PA. The Cytoskeleton and Cell Signaling: Component Localization and Mechanical Coupling. Physiol. Rev. 1998;78:763 LP–781. - PubMed
-
- Heidemann SR, Wirtz D. Towards a regional approach to cell mechanics. Trends Cell Biol. 2004;14:160–166. - PubMed
-
- Paszek MJ, W V M. The tension mounts: mechanics meets morphogenesis and malignancy. J. Mammary Gland Biol. Neoplasia. 2004;9:325–342. - PubMed
Publication types
MeSH terms
Substances
Grants and funding
LinkOut - more resources
Full Text Sources
Other Literature Sources
Medical
