. 2018 Apr 4;98(1):192-207.e10.
doi: 10.1016/j.neuron.2018.02.019.

A Hypothalamic Midbrain Pathway Essential for Driving Maternal Behaviors

Affiliations

A Hypothalamic Midbrain Pathway Essential for Driving Maternal Behaviors

Yi-Ya Fang et al. Neuron. .

Abstract

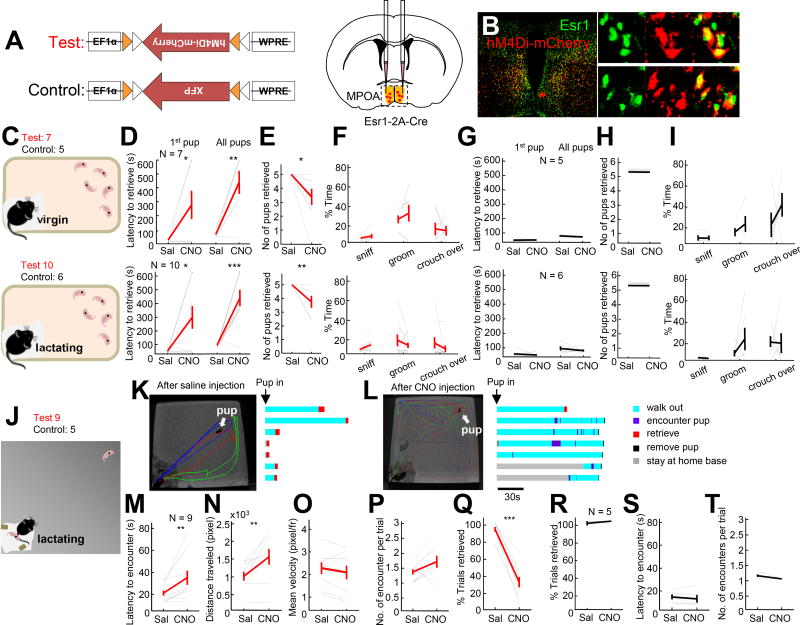
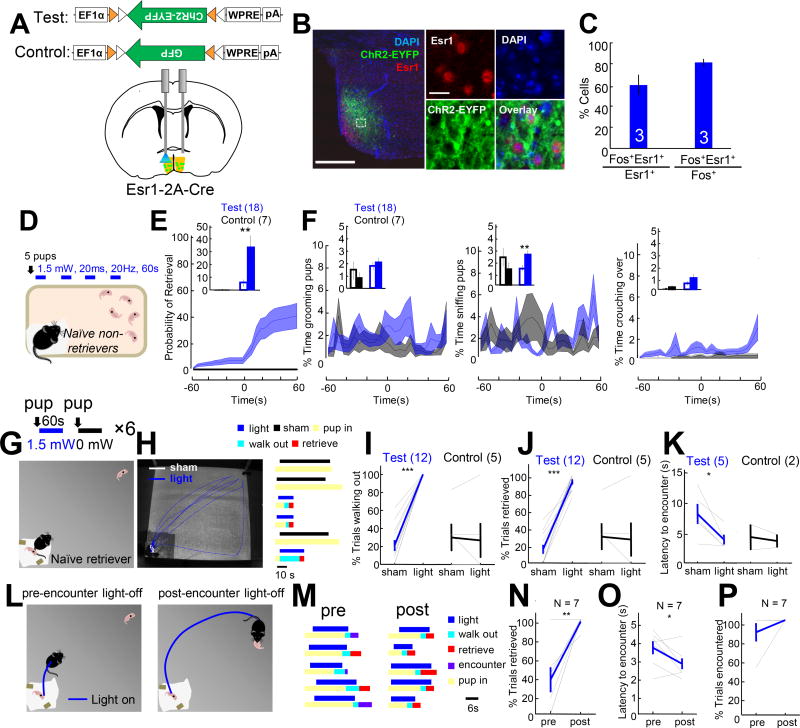
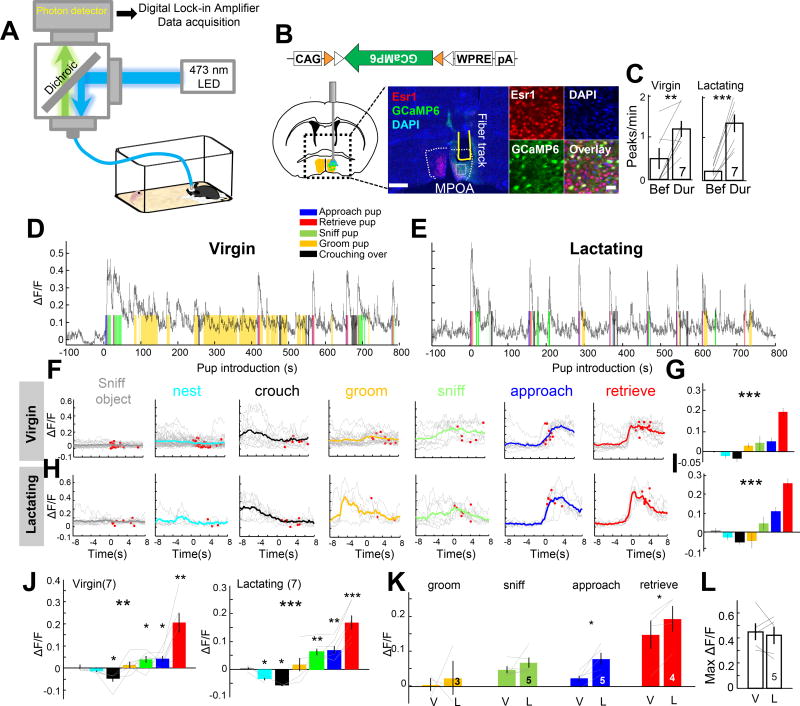
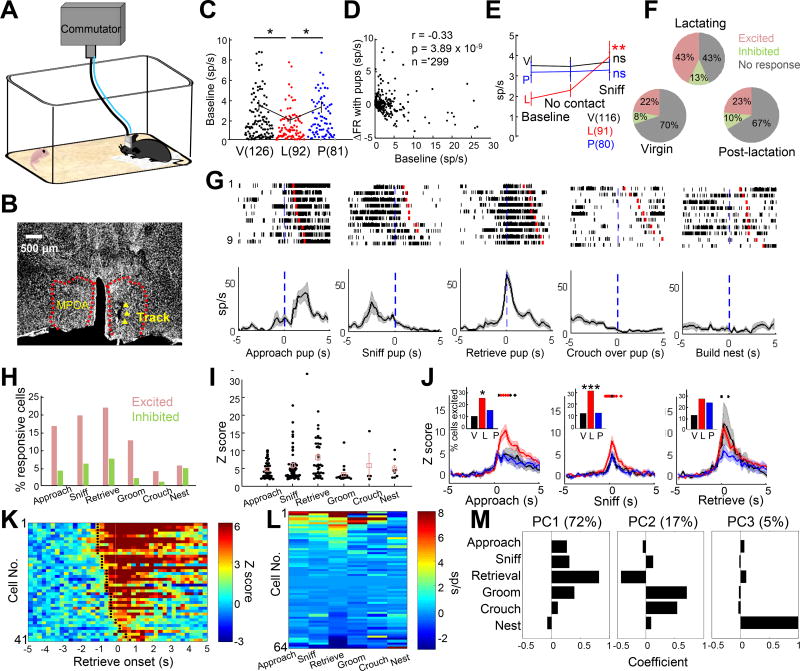
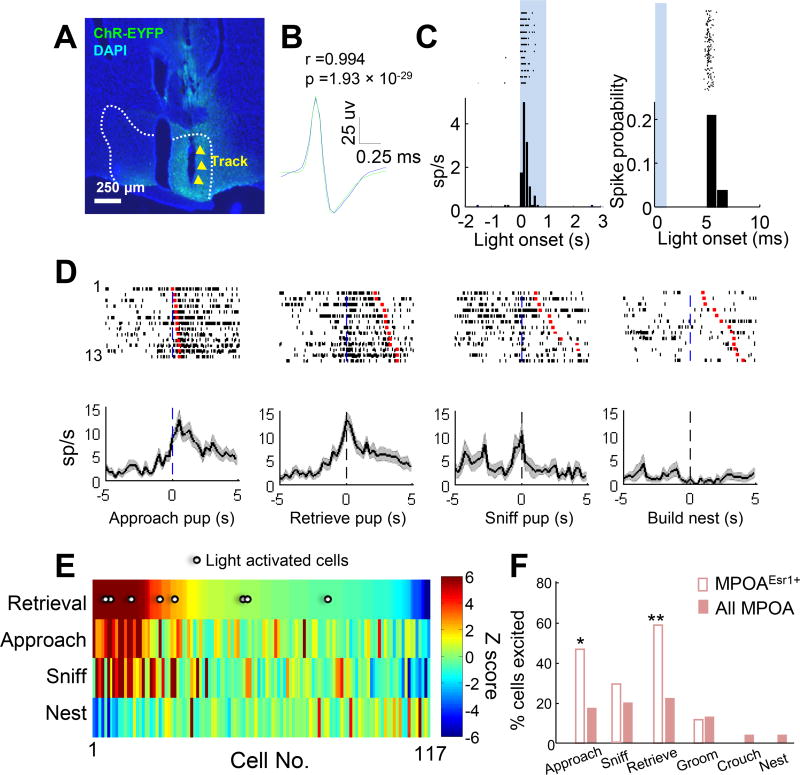
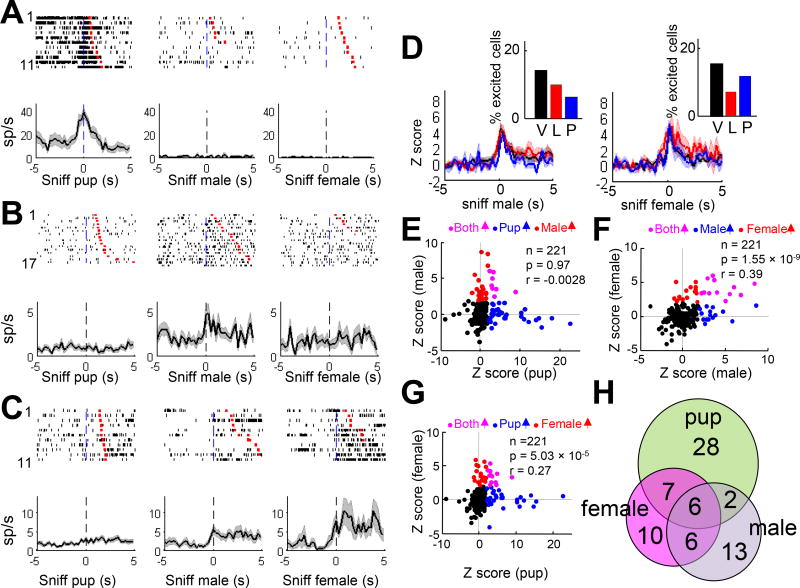
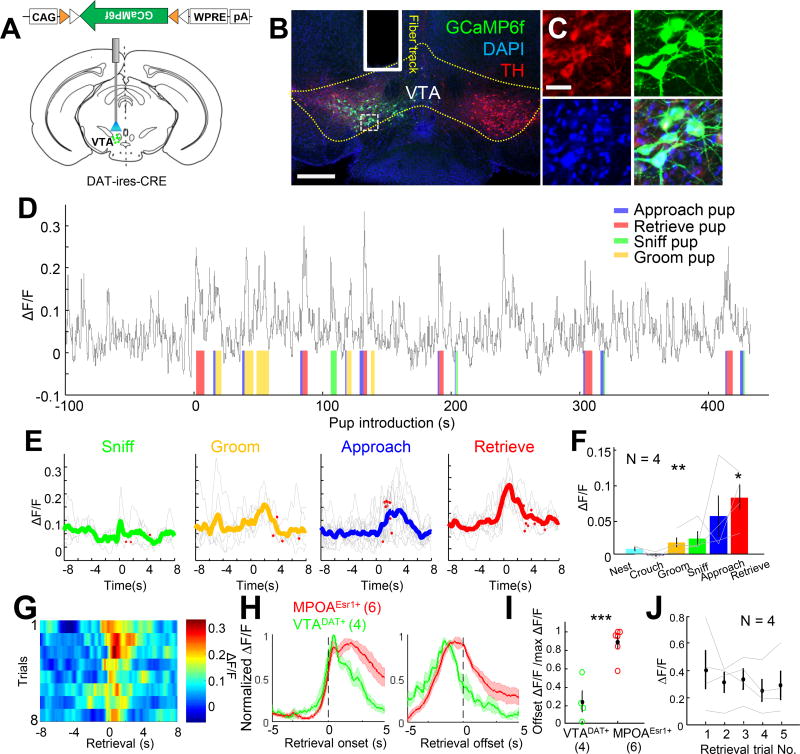
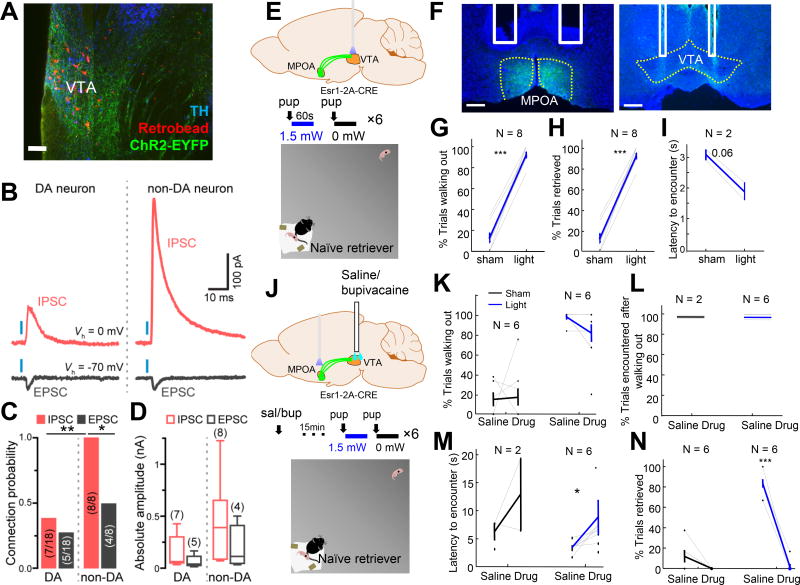
Maternal behaviors are essential for the survival of the young. Previous studies implicated the medial preoptic area (MPOA) as an important region for maternal behaviors, but details of the maternal circuit remain incompletely understood. Here we identify estrogen receptor alpha (Esr1)-expressing cells in the MPOA as key mediators of pup approach and retrieval. Reversible inactivation of MPOAEsr1+ cells impairs those behaviors, whereas optogenetic activation induces immediate pup retrieval. In vivo recordings demonstrate preferential activation of MPOAEsr1+ cells during maternal behaviors and changes in MPOA cell responses across reproductive states. Furthermore, channelrhodopsin-assisted circuit mapping reveals a strong inhibitory projection from MPOAEsr1+ cells to ventral tegmental area (VTA) non-dopaminergic cells. Pathway-specific manipulations reveal that this projection is essential for driving pup approach and retrieval and that VTA dopaminergic cells are reliably activated during those behaviors. Altogether, this study provides new insight into the neural circuit that generates maternal behaviors.

Keywords: dopamine; electrophysiology; estrogen receptor alpha; hypothalamus; maternal behaviors; medial preoptic area; neural circuit; optogenetics; pup retrieval; ventral tegmental area.


Conflict of interest statement

Declaration of Interests

The authors declare no competing interests.

Figures

Figure 1
Figure 1. Inactivation of Esr1+ cells in MPOA impaired pup approach and retrieval
(A) Experimental design. (B) Overlap between the Esr1 (green) and hM4Di-mCherry (Red). Right shows the boxed areas on the left. Scale bars: 250 and 30 µm. (C) Experimental design. (D, E, F) Latency to retrieve the first pup (D, left) and all pups (D, right), the total number of pups successfully retrieved (E) and the total percentage of time the females spent on pup sniffing, grooming and crouching over (F) after CNO or saline injections. (G, H, I) Results from the control animals. (J) Experimental design. (K, L) Left shows tracking traces after saline (K) or CNO (L) injection. Each color indicates one trial. White arrows indicate the pup location. Raster plots show the behaviors of the female after pup introduction. (M–Q) The average latency to encounter the pup after the females walked out of the nest (M), the average distance traveled by the female before encountering the pup (N), the mean movement velocity (O), the average number of encounters per trial (P) and the percentage of successfully retrieved trials (Q) after CNO and saline injection in the test group. (R–T) the results from the control group. Error bars: ± SEM. Paired t-test. ***p<0.001, **p<0.01, *p<0.05. See also Figure S1 and Movie S1 and S2.
Figure 2
Figure 2. Optogenetic activation of MPOAEsr1+ cells induced pup retrieval
(A) Experimental schematics. (B) The overlap between ChR2-EYFP (green) and Esr1 (red) in MPOA. Right images show the boxed area. Scale bars: 250 and 40 µm. (C) Quantification of overlap between Esr1+ and light-induced Fos in MPOA. (D) Experimental design. (E) PETH of accumulated retrieval probability in test (blue) and control (black) animals. Insets show the percentage of trials the animal retrieved before and during stimulation. (F) PETHs showing the percentage of time spent on pup grooming, sniffing and crouching of test (blue) and control (black) animals before and during light. Insets compare the average percentage spent on a maternal behavior before and during light stimulation. (G) Experiment design. (H) Left shows tracking results during three stimulation (blue) and three sham trials (white). Right shows the behavioral changes during each trial. (I–K) Percentage of sham and stimulation trials the animals walked out the home base (I) and retrieved the pup (J), and the latency to encounter the pup after walking out the home base (K) in test and control animals. In K, only animals with at least two walk-out trials during sham and real stimulation were included. (L) Experimental design. (M) Behaviors during pre-encounter and post-encounter termination trials. (N–P) The percentage of trials that the pup was retrieved (N), the latency to encounter after walking out of the home base (O), and the percentage of trials encountered a pup (P) in pre-encounter and post-encounter-termination trials. Paired t-tests. *p<0.05; **p<0.01; ***p<0.001. Error bars: ± SEM. See also Figures S2 and Movie S3.
Figure 3
Figure 3. MPOAEsr1+ cells are highly active during pup approach and retrieval in both virgin and lactating females
(A) Fiber photometry setup. (B) Viral construct, targeted brain area a histological image with a fiber track (yellow line) in MPOA (dashed white line). Green: unstained GCaMP6. Red: Esr1; Blue: DAPI. Right shows the boxed area. Scale bars: 500 and 50 µm. (C) The peak frequency before and during pup presentation in virgin and lactating females. (D, E) Traces showing GCaMP6 signal (ΔF/F) during pup presentation when the female was under virgin (d) or lactating state (E). Color shades indicate various maternal behaviors. Pup is introduced at time 0. (F, H) Averaged PETHs aligned to the onset of various maternal behaviors from the session shown in d and e. Gray lines indicate individual trials and color lines indicate the average. Red dots indicate the end of trials. (G, I) Average ΔF/F during various maternal behaviors shown in F and H. One-way ANOVA. (J–L) ΔF/F during various maternal behaviors and in virgin and lactating females. One-way ANOVA and t-test. Color convention in G–K as that in F. (K–L) Average ΔF/F during various maternal behaviors (K) and maximum ΔF/F (L) in the same females under virgin (V) and lactating (L) states. Paired t-test. *p<0.05; **p<0.01; ***p< 0.001. Error bars: ± SEM. See also Figure S3–S6.
Figure 4
Figure 4. Electrophysiological recording of individual MPOA cells during maternal behaviors in virgin and lactating females
(A) Recording schematics. (B) Histology showing the electrode track in MPOA (red dashed lines). Scale bar: 500 µm. (C) Average spontaneous firing rate of MPOA cells in females of different reproductive states. Each dot represents one cell. V: virgin; L: lactating; P: post-lactation. Student t-test. (D) The firing rate change in the presence of a pup is negatively correlated with the baseline firing rate. Pearson’s cross-correlation. (E) The average firing rate before pup introduction, during no interaction period in the presence of a pup and during pup sniffing. One way ANOVA with repeated measures. (F) The percentage of excited (red), inhibited (blue) and non-responsive (gray) cells in animals of different reproductive states. (G) Raster plots and PETHs of an example cell aligned to various maternal behaviors. (H) The percentage of excited and inhibited cells during various maternal behaviors. (I) The Z scored responses of excited cells (Z>2) across maternal behaviors. One way ANOVA. p< 0.05. (J) Average Z scored PETHs of excited cells (Z>2) aligned to pup approach, retrieval and sniffing in virgin (black), lactating (red) and post-lactation (blue) females. One-way ANOVA for each time point. Red dots: p< 0.05; black dots: p< 0.1. Insets show the percentage of excited cells in females of different reproductive states. Fisher’s exact test. (K) Heat map showing the PETHs of all cells excited during pup retrieval. Black dots indicate the first time bin with Z >2. (L) Response matrix of firing rate change sorted by the score of the first principal component (PC). N = 64 cells with data from all six behaviors. (M) The coefficients of the first three PCs that explained 72%, 17% and 5% of the variability in the response matrix shown in L. V: virgin; L: lactating: P: post-lactation. *p< 0.05; ***p< 0.001. See also Figure S7.
Figure 5
Figure 5. Optrode recording shows preferential responses of MPOAEsr1+ cells during pup approach and retrieval
(A) The optrode track (yellow arrow heads) in MPOA (white dashed lines). Green: unstained ChR2-EYFP; Blue: DAPI. Scale bar: 250 µm. (B) Average waveforms of spontaneous spikes (green) and light evoked spikes (blue) from a representative light-excited cell. Scale bars: 25 µV (vertical) and 0.25 ms (horizontal). Pearson’s cross correlation. (C) Raster plots and PETHs showing the cell responses to 1s (left) and 1ms (right) light stimulation. Bin sizes: 100 ms (left) and 1 ms (right). Shades represent light-on periods. (D) Raster plots and PETHs of a putative Esr1+ cell aligned to the onset of various maternal behaviors. Red marks indicate the behavioral offset. (E) Heat map shows the Z scored responses of MPOA cells during pup retrieval, approach, sniffing, and nest building, sorted by responses during pup retrieval. Putative Esr1+ cells are indicated with white dots. N = 117 cells that contain data from all four behaviors. (F) The percentage of Esr1+ cells (open) and total cells (filled) that are excited (Z > 2) during each maternal behavior. Fisher’s exact test. *p<0.05. See also Figure S8.
Figure 6
Figure 6. The relationship among MPOA cell responses to pups, adult male and adult female
(A–C) Raster plots and PETHs aligned to the onset of sniffing pup, male and female from three representative cells. (D) Average Z scored PETHs aligned to the onsets of male (left) and female sniffing (right) in virgin (black), lactating (red) and post-lactation (blue) females. Shades show ± SEM. Insets show the percentage of behavior-excited cells in females under different reproductive states. Fisher’s exact 2 × 3 tests, p > 0.05. V: virgin; L: lactating; P: post-lactation. (E–G) The relationships of cell responses (Z score) during pup, male and female sniffing. Each dot represents one cell. Color represents response type. Pearson’s cross correlation. (H) Venn-diagram showing the number of responsive cells to male, female and pup.
Figure 7
Figure 7. Responses of VTA dopaminergic neurons during maternal behaviors
(A) Experimental schematics. (B) A histology image showing the fiber track and GCaMP6f expression in the VTA. Scale bar: 1 mm. (C) Zoomed in of the boxed area in B. Green: GCaMP6f; Red: tyrosine hydroxylase (TH); Blue: DAPI. Scale bar: 40 µm. (D) ΔF/F during a pup session. Color shades indicate manually annotated behavior episodes. (E) PETHs of ΔF/F aligned to the onset of various maternal behaviors. (F) The average GCaMP6 responses during various maternal behaviors. One way ANOVA with repeated measures and t-test. (G) Heat maps showing the GCaMP6 signal during repeated retrieval trials in D. (H) Average PETHs of GCaMP6 signals from MPOAEsr1+ cells (red, N = 6 virgin females) and VTADAT+ cells (green, N = 4 virgin females) aligned to the onset (left) and offset (right) of pup retrieval. (I) The ratio between the offset ΔF/F to the maximum ΔF/F during the first 2 s after retrieval onset. Student t-test. (J) The peak ΔF/F over repeated pup retrieval trials. One way ANOVA with repeated measures. p > 0.05. *p<0.05; **p< 0.01; ***p<0.001. Error bars: ± SEM. See also Figure S9–S11.
Figure 8
Figure 8. MPOAEsr1+ to VTA projection is essential for driving pup approach and retrieval
(A) Image from a recorded brain slice (horizontal section) that contains ChR2-EFYP fiber from MPOAEsr1+ cells (green), retrobeads (red) from the nucleus accumbens and TH staining (blue). Scale bar: 100 µm. All recording attempts were made from regions containing ChR2-EYFP fibers and bead+ cells. (B) Examples of excitatory (black) and inhibitory (red) postsynaptic currents measured in putative dopaminergic (DA) and non-dopaminergic (non-DA) VTA neurons voltage-clamped at the reversal potential for GABAergic (−70 mV) and glutamatergic (0 mV) conductances upon optogenetic stimulation (blue bar, 1 ms) of MPOAEsr1+ afferents. (C) Proportion of recorded cells (in parentheses) in which light stimulation reliably evoked EPSCs and IPSCs >10 pA in amplitude. Chi-square tests. (D) Box plots of absolute light-evoked EPSC and IPSC amplitudes in putative VTA DA and non-DA neurons. (E) Experimental schematics. (F) Histology images showing expression of ChR2-EYFP and the fiber tracks (white lines) at MPOA and VTA (dashed yellow lines). Scale bars: 250 µm. (G–I) The percentage of trials the animals walked out (G) and retrieved (H), and the latency to encounter the pup after walking out the home base (I) during sham and real stimulation. In I, only animals with at least two walk-out trials during sham stimulation were included in the analysis. (J) Experimental schematics. (K–N) The percentage of trials animals walked out of the home base (K) and encountered pup after walking out (L), the latency to encounter the pup after walking out of the home base (M), and the percentage of trials animals retrieved the pup (N) after saline and drug injection in sham (black) and light stimulation trials (blue). Paired t-test. *p< 0.05 and *** p< 0.001. Error bars: ± SEM. See also Figure S12 and Movie S4.

Comment in

References

    1. Armbruster BN, Li X, Pausch MH, Herlitze S, Roth BL. Evolving the lock to fit the key to create a family of G protein-coupled receptors potently activated by an inert ligand. P Natl Acad Sci USA. 2007;104:5163–5168. - PMC - PubMed
    1. Arrati PG, Carmona C, Dominguez G, Beyer C, Rosenblatt JS. GABA receptor agonists in the medial preoptic area and maternal behavior in lactating rats. Physiology & behavior. 2006;87:51–65. - PubMed
    1. Boyden ES, Zhang F, Bamberg E, Nagel G, Deisseroth K. Millisecond-timescale, genetically targeted optical control of neural activity. Nature neuroscience. 2005;8:1263–1268. - PubMed
    1. Bridges RS. A quantitative analysis of the roles of dosage, sequence, and duration of estradiol and progesterone exposure in the regulation of maternal behavior in the rat. Endocrinology. 1984;114:930–940. - PubMed
    1. Bridges RS, DiBiase R, Loundes DD, Doherty PC. Prolactin stimulation of maternal behavior in female rats. Science. 1985;227:782–784. - PubMed

Publication types

MeSH terms

Substances

LinkOut - more resources