. 2018 Apr 5;19(1):47.
doi: 10.1186/s13059-018-1426-0.

Mapping human pluripotent stem cell differentiation pathways using high throughput single-cell RNA-sequencing

Affiliations

Mapping human pluripotent stem cell differentiation pathways using high throughput single-cell RNA-sequencing

Xiaoping Han et al. Genome Biol. .

Abstract

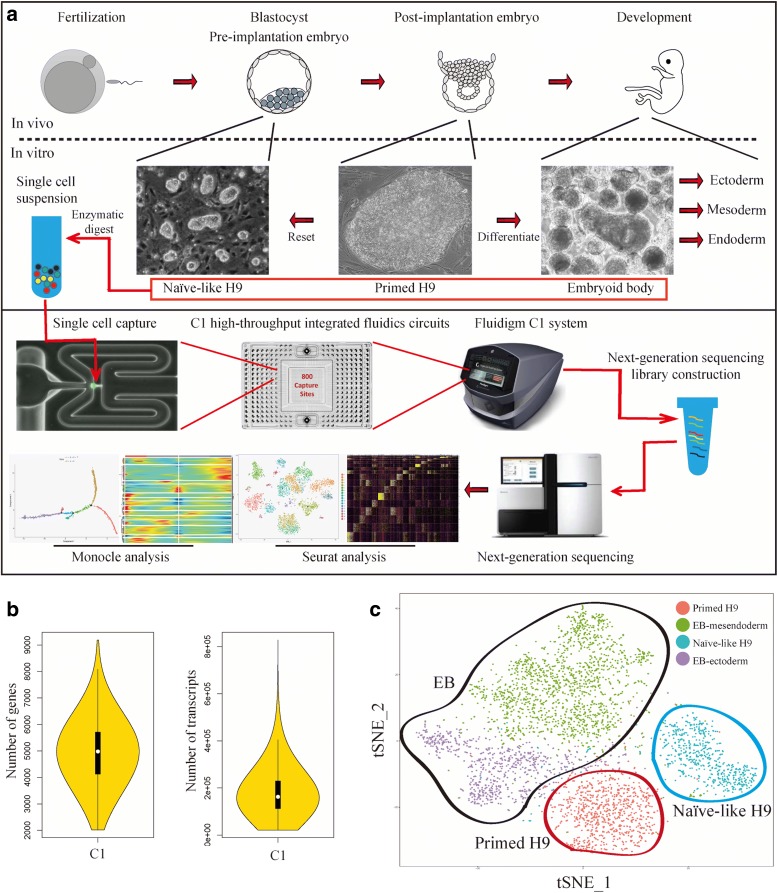
Background: Human pluripotent stem cells (hPSCs) provide powerful models for studying cellular differentiations and unlimited sources of cells for regenerative medicine. However, a comprehensive single-cell level differentiation roadmap for hPSCs has not been achieved.

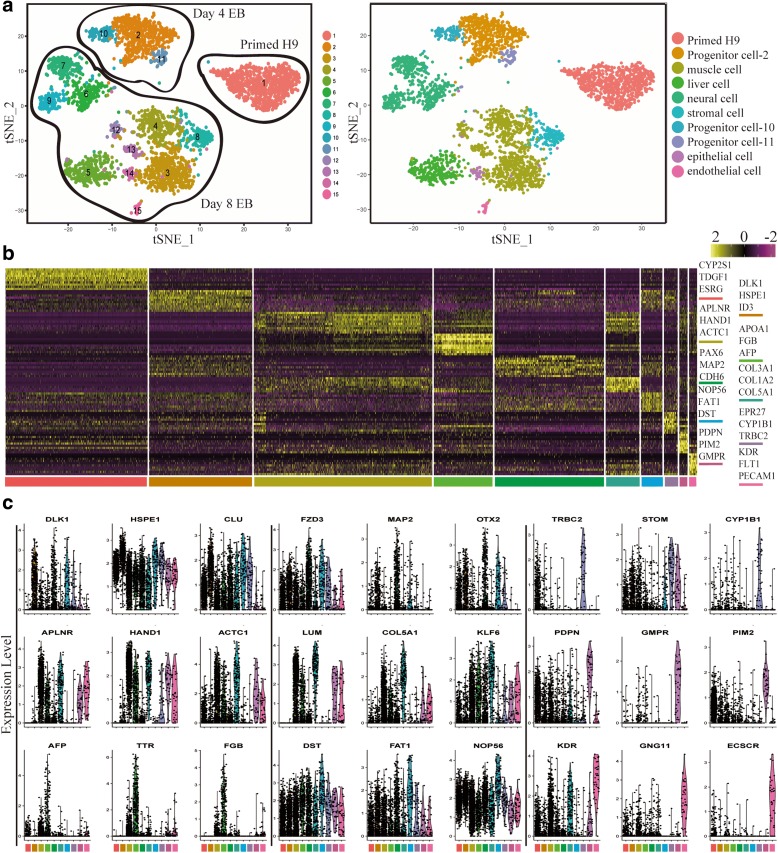
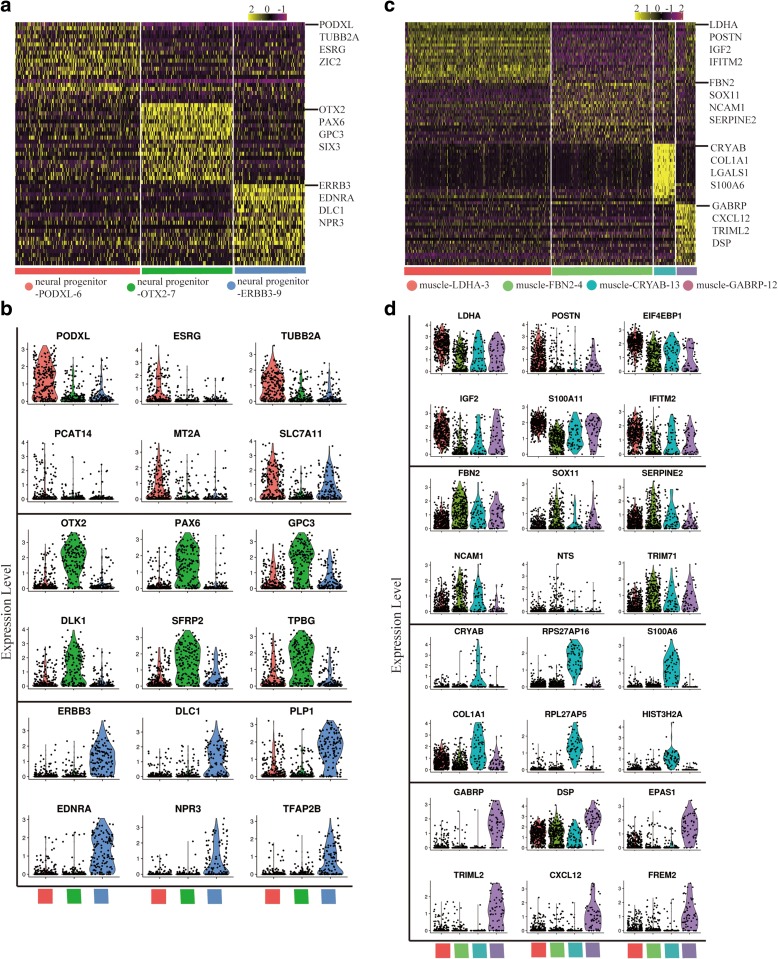
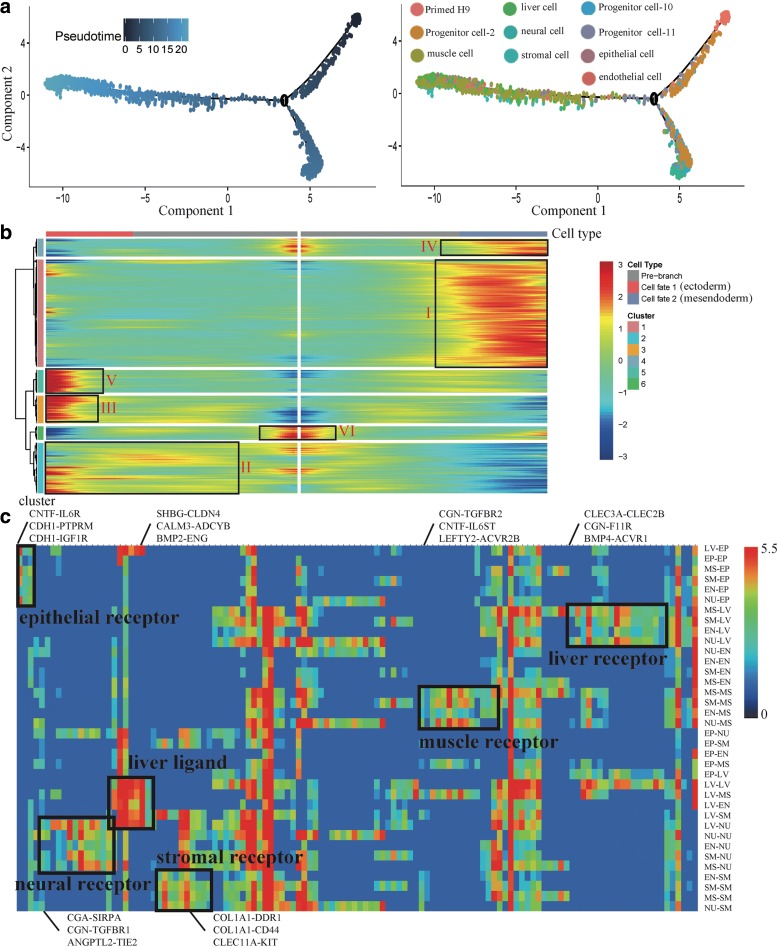
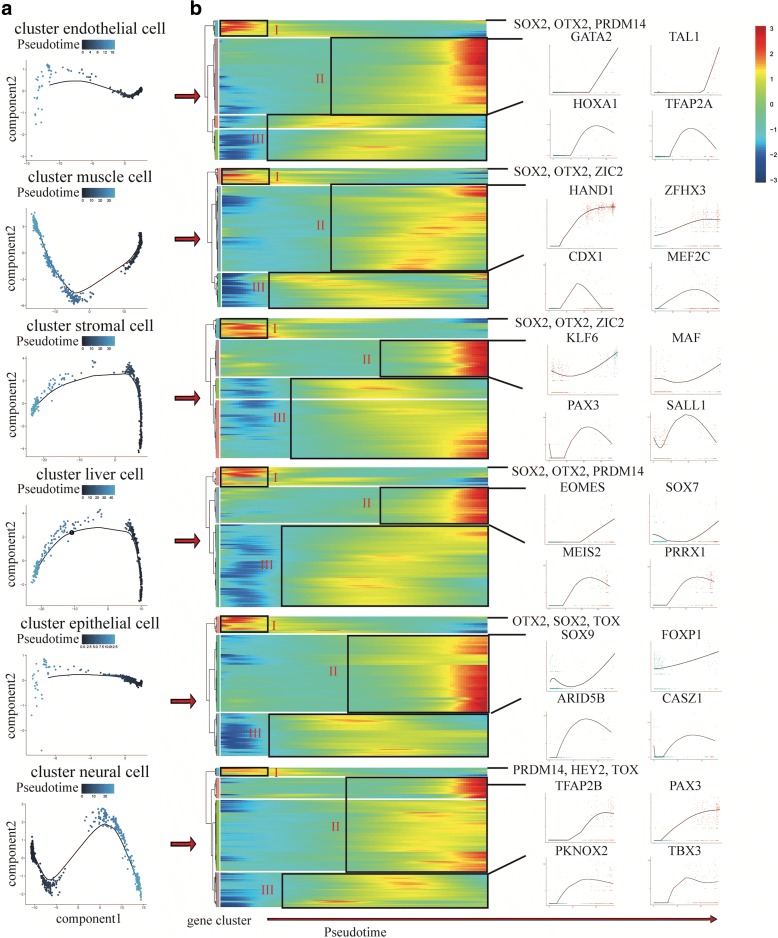
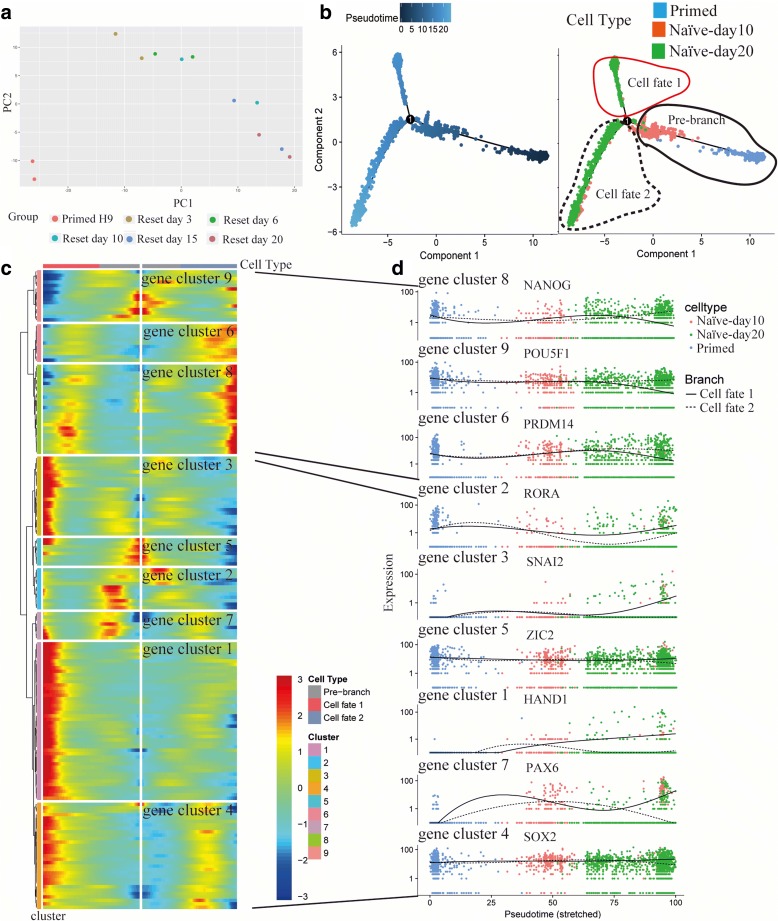
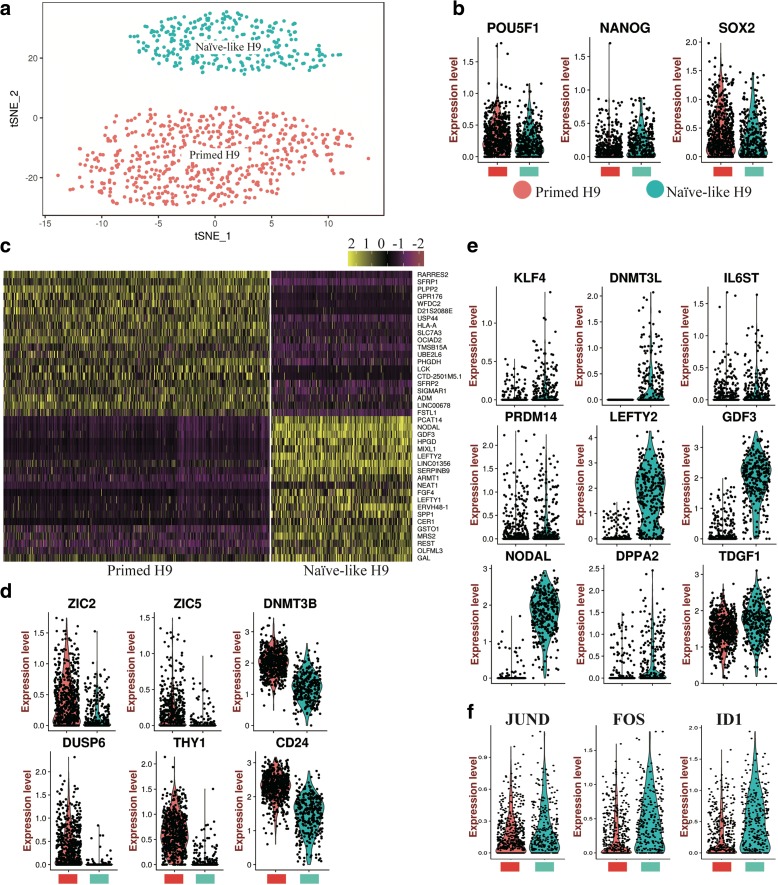
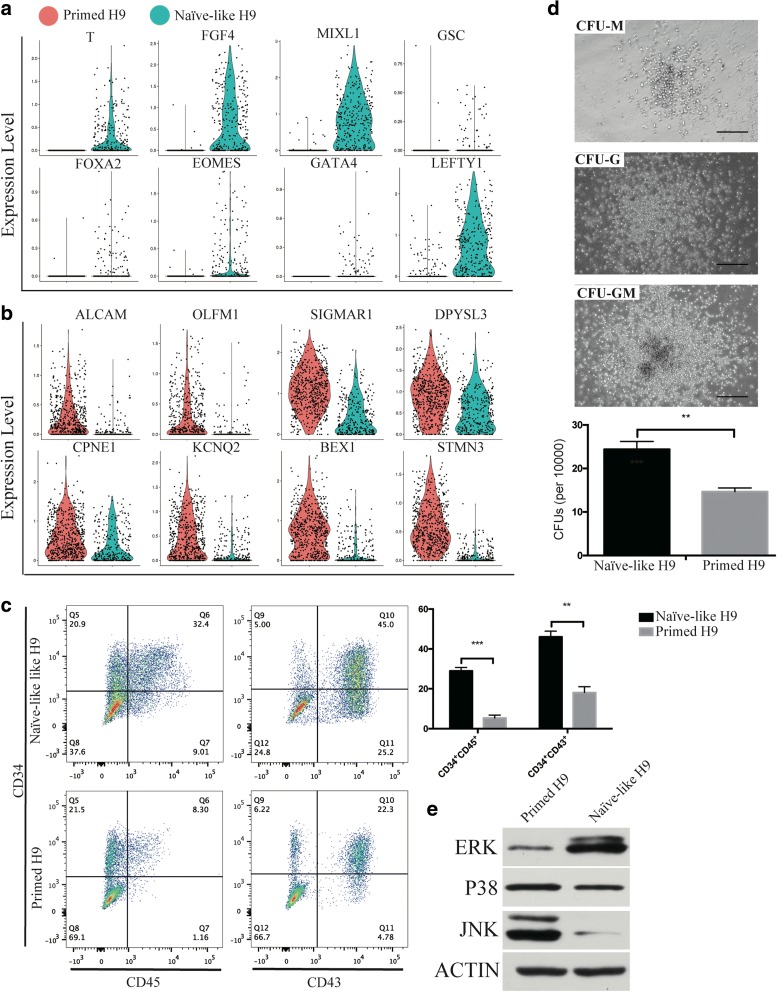
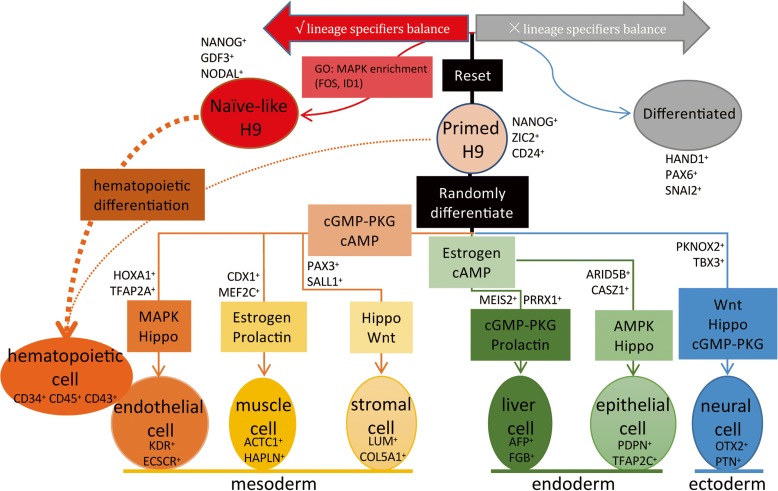
Results: We use high throughput single-cell RNA-sequencing (scRNA-seq), based on optimized microfluidic circuits, to profile early differentiation lineages in the human embryoid body system. We present a cellular-state landscape for hPSC early differentiation that covers multiple cellular lineages, including neural, muscle, endothelial, stromal, liver, and epithelial cells. Through pseudotime analysis, we construct the developmental trajectories of these progenitor cells and reveal the gene expression dynamics in the process of cell differentiation. We further reprogram primed H9 cells into naïve-like H9 cells to study the cellular-state transition process. We find that genes related to hemogenic endothelium development are enriched in naïve-like H9. Functionally, naïve-like H9 show higher potency for differentiation into hematopoietic lineages than primed cells.

Conclusions: Our single-cell analysis reveals the cellular-state landscape of hPSC early differentiation, offering new insights that can be harnessed for optimization of differentiation protocols.

Keywords: Embryoid body; Naïve human pluripotent stem cell; Primed human pluripotent stem cell; Single-cell RNA-sequencing.


Conflict of interest statement

Ethics approval and consent to participate

Not applicable.

Consent for publication

Not applicable.

Competing interests

The authors declare that they have no competing interests.

Publisher’s Note

Springer Nature remains neutral with regard to jurisdictional claims in published maps and institutional affiliations.

Figures

Fig. 1
Fig. 1
Overview of scRNA-seq analysis on hPSC early differentiation. a Process flow diagram of scRNA-seq analysis on hPSC early differentiation. Single-cell samples of Naïve-like H9, Primed H9, and EBs were prepared by Fluidigm C1 system with HT IFCs for sequencing. Data analysis was performed using Seurat and Monocle. b Violin plots show the distribution of transcripts and genes detected per cell. c t-SNE plot of single-cell samples profiled. Naïve-like H9 cluster (blue circle), EB clusters (black circle), Primed H9 cluster (red circle)
Fig. 2
Fig. 2
scRNA-seq analysis reveals lineage progenitors in EBs. a t-SNE plots of Primed H9 and EBs (day 4 EBs and day 8 EBs). We defined three progenitor clusters in day 4 EBs, including progenitor cell-2, progenitor cell-10, and progenitor cell-11. We defined six progenitor clusters in day 8 EBs, including muscle cell, liver cell, neural cell, stromal cell, epithelial cell, and endothelial cell. b Heatmap shows the expression pattern of top 15 differential genes in each progenitor cell. Differential genes of each cell type are listed in Additional file 4: Table S3. c Violin plots show the expression level distributions of marker genes across cell types. Cell types are represented by different colors in (a), (b), and (c)
Fig. 3
Fig. 3
Sub-clusters of neural and muscle progenitors. a, c Heatmaps show the differential gene expression pattern of each sub-cluster from neural cell cluster (a) and muscle cell cluster (c). Top 20 differential genes of each sub-cluster are shown. Differential genes of each sub-cluster are listed in Additional file 5: Table S4. b, d Violin plots show the expression distributions of specific marker genes across sub-clusters: neural sub-clusters (b) and muscle sub-clusters (d). Cell types are represented by different colors
Fig. 4
Fig. 4
EBs simulate the early development in vivo. a Differentiation trajectory of EBs constructed by Monocle. b Heatmap shows the gene expression dynamics during EB differentiation. Genes (row) are clustered and cells (column) are ordered according to the pseudotime development. Genes are listed in Additional file 6: Table S5. Gene clusters I–VI were selected for further analysis. c Heatmap shows the mean number of cell–cell interactions. LV liver cell, EP epithelial cell, MS muscle cell, SM stromal cell, EN endothelial cell, NU neural cell. List of ligand-receptor pairings (column) and cell–cell pairings (row) are listed in Additional file 7: Table S6
Fig. 5
Fig. 5
Differentiation trajectories of progenitor cells derived from hPSC. a Differentiation trajectories of progenitor cells constructed by Monocle. b Heatmaps show TFs expression dynamics during differentiation. Genes are listed in Additional file 8: Table S7. Genes (row) are clustered and cells (column) are ordered according to the pseudotime development. In each heatmap, TFs are divided into three clusters (I, II, and III). Specific TFs are listed on the right to show their expression dynamics
Fig. 6
Fig. 6
Construction of naïve hPSC reset trajectory by pseudotime analysis. a PCA analysis of bulk RNA-seq shows the correlation of hPSCs with different states. Reset H9 was sampled at day 3, day 6, day 10, day 15, and day 20. b H9 reset trajectory constructed by Monocle. c Heatmap shows TFs expression dynamics during the cellular-state transition process. Genes (row) are clustered and cells (column) are ordered according to the pseudotime development. Genes are listed in Additional file 9: Table S8. d TFs expression dynamics. Full line: cell fate 1; Imaginary line: cell fate 2
Fig. 7
Fig. 7
Comparison of Primed and Naïve-like H9 at single-cell level. a scRNA-seq t-SNE plot of Primed and Naïve-like H9. Naïve-like H9 was selected from day 20 Reset H9. b Violin plots show the expression level distributions of pluripotent transcription factors (POU5F1, NANOG, and SOX2). c Heatmap shows the distinct gene expression pattern of Primed and Naïve-like H9. Top 20 differential genes are shown. Genes used are listed in Additional file 10: Table S9. df Violin plots show the expression level distributions of primed genes (d), naïve genes (e), and MAPK related genes (f)
Fig. 8
Fig. 8
Hematopoietic differentiation bias of Naïve-like H9. a, b Violin plots show the expression level distributions of mesendoderm genes (T, FGF4, MIXL, GSC, FOXA2, EOMES, GATA4, and LEFTY1) (a) and neural genes (ALCAM, OLFM1, SIGMAR1, DPYSL3, CPNE1, KCNQ2, BEX1, and STMN3) (b). c Flow cytometry analysis of hematopoietic progenitors derived from hPSCs. Significant difference was assessed by the t-test. ***p < 0.001, **p < 0.01, *p < 0.05. d The morphology and number of hematopoietic CFUs. Scale bars = 100 μm. e Western blot analysis of MAPK (ERK1/2, JNK, and P38) in naïve and primed H9
Fig. 9
Fig. 9
Snapshot of scRNA-seq profiling on progenitor cells and hPSCs. Differentiation trajectories of six progenitor cells derived from Primed H9 show key signaling pathways and TFs involved in the differentiation. The balance of lineage specifiers decides the reset result of Primed H9. MAPK-ERK1/2 signaling pathway related genes are enriched in Naïve-like H9, which may contribute to the hematopoietic differentiation bias

References

    1. Thomson JA, Itskovitz-Eldor J, Shapiro SS, Waknitz MA, Swiergiel JJ, Marshall VS, et al Embryonic stem cell lines derived from human blastocysts. Science. 1998;282:1145–1147. doi: 10.1126/science.282.5391.1145. - DOI - PubMed
    1. Tabar V, Studer L. Pluripotent stem cells in regenerative medicine: challenges and recent progress. Nat Rev Genet. 2014;15:82–92. doi: 10.1038/nrg3563. - DOI - PMC - PubMed
    1. Vodyanik MA, Bork JA, Thomson JA, Slukvin II. Human embryonic stem cell-derived CD34+ cells: efficient production in the coculture with OP9 stromal cells and analysis of lymphohematopoietic potential. Blood. 2005;105:617–626. doi: 10.1182/blood-2004-04-1649. - DOI - PubMed
    1. Doulatov S, Vo LT, Chou SS, Kim PG, Arora N, Li H, et al. Induction of multipotential hematopoietic progenitors from human pluripotent stem cells via respecification of lineage-restricted precursors. Cell Stem Cell. 2013;13:459–470. 10.1016/j.stem.2013.09.002. - PMC - PubMed
    1. Kroon E, Martinson LA, Kadoya K, Bang AG, Kelly OG, Eliazer S, et al. Pancreatic endoderm derived from human embryonic stem cells generates glucose-responsive insulin-secreting cells in vivo. Nat Biotechnol. 2008;26:443–452. 10.1038/nbt1393. - PubMed

Publication types

MeSH terms