. 2018 Apr;30(4):925-945.
doi: 10.1105/tpc.17.00810. Epub 2018 Apr 5.

Repression of Nitrogen Starvation Responses by Members of the Arabidopsis GARP-Type Transcription Factor NIGT1/HRS1 Subfamily

Affiliations

Repression of Nitrogen Starvation Responses by Members of the Arabidopsis GARP-Type Transcription Factor NIGT1/HRS1 Subfamily

Takatoshi Kiba et al. Plant Cell. 2018 Apr.

Abstract

Nitrogen (N) is often a limiting nutrient whose availability determines plant growth and productivity. Because its availability is often low and/or not uniform over time and space in nature, plants respond to variations in N availability by altering uptake and recycling mechanisms, but the molecular mechanisms underlying how these responses are regulated are poorly understood. Here, we show that a group of GARP G2-like transcription factors, Arabidopsis thaliana NITRATE-INDUCIBLE, GARP-TYPE TRANSCRIPTIONAL REPRESSOR1/HYPERSENSITIVE TO LOW Pi-ELICITED PRIMARY ROOT SHORTENING1 proteins (NIGT1/HRS1s), are factors that bind to the promoter of the N starvation marker NRT2.4 and repress an array of N starvation-responsive genes under conditions of high N availability. Transient assays and expression analysis demonstrated that NIGT1/HRS1s are transcriptional repressors whose expression is regulated by N availability. We identified target genes of the NIGT1/HRS1s by genome-wide transcriptome analyses and found that they are significantly enriched in N starvation response-related genes, including N acquisition, recycling, remobilization, and signaling genes. Loss of NIGT1/HRS1s resulted in deregulation of N acquisition and accumulation. We propose that NIGT1/HRS1s are major regulators of N starvation responses that play an important role in optimizing N acquisition and utilization under fluctuating N conditions.


Figures

Figure 1.
Figure 1.
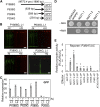
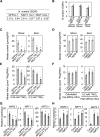
Deletion Analysis of the Arabidopsis NRT2.4 Promoter and Isolation of NIGT1/HRS1/HHO Protein Family Members That Can Interact with the Deleted Promoter. (A) Schematic of the full length and three truncated ProNRT2.4:GFP fusion constructs. P1886G represents the full-length 5′ upstream NRT2.4 promoter (1886 bp) fused with GFP. Deletion constructs are named for the length of the remaining promoter region. (B) and (C) GFP florescence (B) and expression (C) in transgenic seedlings harboring the full-length or one of the three truncated NRT2.4 promoter:GFP constructs. Two independent lines (L1 and L2) of 7-d-old transgenic seedlings were grown for 3 d on MGRL agar plates with 10 mM nitrate (+N) or without an added nitrogen source (−N). (B) The GFP fluorescence image (green) was merged with the chlorophyll autofluorescence image (red), and representative merged images are presented. Bar = 2 cm. (C) GFP transcript levels were measured by qRT-PCR and normalized using the stably expressed At4g34270 as an internal control. Error bars represent sd (n = 4 independent pools of more than 10 whole plants). (D) Y1H analysis of interactions between NIGT1 subfamily members and the NRT2.4 promoter. The NRT2.4 P389 promoter was used for bait. NIGT1.1, NIGT1.2, and NIGT1.3 cDNAs were cloned into pGAD424 as prey. Transformed yeast strains were grown either on permissive medium (without aureobasidin A [−AbA]) or on selective medium (with aureobasidin A [+AbA]). (E) Interactions between NIGT1/HRS1/HHO family members and the NRT2.4 promoter in transient assays. Transient assays were conducted using constructs harboring the NRT2.4 P389 promoter fused with the luciferase gene (P389:FLUC) as a reporter. Constructs expressing GFP or NIGT1-related transcription factors fused with two stringent transcriptional activation domains VP16 (VP) were used as effectors. Promoter activities are given as FLUC/RLUC activity ratios. A vector with the CaMV 35S promoter fused to the RLUC reporter was used as an internal control for normalization of bombardment efficiency. Error bars represent sd (n = 4 independent pools of more than 8 seedlings). Asterisks indicate statistically significant differences (P < 0.05; Student’s t test). Each experiment was conducted twice with similar results.
Figure 2.
Figure 2.
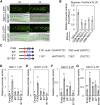
Arabidopsis NIGT1 Subfamily Members Are Nuclear-Localized Transcriptional Repressors and Interact with the NRT2.4 Promoter in a Sequence-Specific Manner. (A) Localization of GFP in roots of 5-d-old transgenic seedlings expressing NIGT1.1-GFP (NIGT1.1-GFP) or NIGT1.2-GFP (NIGT1.2-GFP) under the control of the CaMV 35S promoter grown on 0.5× MS agar plates with (+N) or without a nitrogen source (−N). BF/GFP represents merged images of bright field and GFP. Bar = 25 μm. (B) The effect of NIGT1 subfamily members on GAL4 promoter activity in transient assays. GAL4 promoter activity from ProGAL4:FLUC was measured when cobombarded with the GAL4 DNA binding domain (GDB) fused to GFP or NIGT1.1-1.4. Promoter activities are given as FLUC/RLUC activity ratios. A vector containing RLUC driven by the CaMV 35S promoter (ProCAMV35S:RLUC) was used as an internal control for normalization of bombardment efficiency. (C) to (G) Interactions between NIGT1 subfamily members and mutated NRT2.4 promoters in transient assays. (C) Schematic of the NRT2.4 P389 promoter and mutated promoters (B1m, B2m, and B1mB2m). (D) to (G) Transient assays were conducted using constructs harboring the promoters illustrated in (C) fused with FLUC or FLUC only (Empty) as reporters. As effectors, constructs expressing NIGT1.1 (D), NIGT1.2 (E), NIGT1.3 (F), and NIGT1.4 (G) fused with two VP16 domains (VP) were used. ProCAMV35S:RLUC was used as an internal control for normalization of bombardment efficiency. The promoter activities are shown as FLUC/RLUC activity ratios. B1m and B2m represent mutated NRT2.4 promoters at the B1 and B2 motifs, respectively. Different lowercase letters indicate statistically significant differences as indicated by Tukey’s HSD test (P < 0.05). Error bars represent sd of four ([B], [D], and [E]) and three ([F] and [G]) independent pools of more than eight seedlings. Each experiment was conducted twice with similar results.
Figure 3.
Figure 3.
Arabidopsis NIGT1 Subfamily Members Are Associated with the NRT2.4 Promoter. NIGT1 interaction with the NRT2.4 promoter was analyzed using ChIP assays. (A) Diagrams of NRT2.4 and control (At2g28390 and At4g34270) loci and the locations of B1 (GAATATTC, red line) and B2 (GAATC, blue lines) motifs. Black bars and numbers 1 to 7 indicate DNA regions used in the ChIP assay. (B) ChIP-qPCR assays were performed using 10-d-old transgenic seedlings. Left graph: Transgenic lines expressing GFP (GFPox), NIGT1.1-GFP (NIGT1.1ox), or NIGT1.2-GFP (NIGT1.2ox) fusion genes under control of the CaMV 35S promoter were used and immunoprecipitated with an anti-GFP antibody. Right graph: Transgenic lines expressing GFP-FLAG (eGFPox), NIGT1.3-FLAG (eNIGT1.3ox), or NIGT1.4-FLAG (eNIGT1.4ox) fusion genes under control of the β-estradiol-inducible promoter treated with 10 μM β-estradiol for 24 h were used and immunoprecipitated with an anti-FLAG antibody. The percentages of the DNA coimmunoprecipitated with antibody relative to input DNA are indicated. Numbers on the x axis indicate DNA regions shown in (A). Error bars represent sd (n = 3 independent pools of more than 10 whole plants). Asterisks indicate statistically significant differences (*P < 0.01, Student’s t test). Each experiment was conducted twice with similar results.
Figure 4.
Figure 4.
Expression of Arabidopsis NRT2.4 Is Downregulated in Overexpressing Lines of NIGT1.1-1.4 and Upregulated in nigt1.1 nigt1.2 nigt1.3 nigt1.4 Quadruple Mutants. (A) Expression of NRT2.4 in roots of transgenic lines expressing NIGT1.1 (eNIGT1.1ox-4), NIGT1.2 (eNIGT1.2ox-4), NIGT1.3 (eNIGT1.3ox-3), or NIGT1.4 (eNIGT1.4ox-4) under control of the Est-inducible promoter. eVC-3 is an empty vector control. Seven-day-old 0.5× MS-grown seedlings were transferred and incubated on MGRL plates without an exogenous N source but containing 1 μM Est for 3 d. Error bars represent sd (n = 3 independent pools of more than 10 roots). (B) NRT2.4 promoter activity in transgenic lines harboring the 1886 bp NRT2.4 promoter:GFP construct (P1886G) and eNIGT1.2ox-4 or eVC-3. Eight-day-old 0.5× MS-grown seedlings were transferred to and incubated on MGRL plates without an exogenous nitrogen source but containing 1 μM Est for 3 d. GFP fluorescence (green) was merged with chlorophyll autofluorescence (red) and representative pictures are presented. qRT-PCR analysis of GFP expression is presented in Supplemental Figure 3B. Bar = 1 cm. (C) and (D) Expression levels of NRT2.4 in nigt1 multiple mutants. (C) NRT2.4 expression in whole seedlings of 10-d-old 0.5× MS-grown wild-type (Col-0), nigt1 single, double, triple, and quadruple (nigtQ) mutants. Double and triple mutants are combinations of nigt1.1-1, nigt1.2-1, nigt1.3-1, and nigt1.4-1, except for nigt124. The nigt124 represents nigt1.1-1 nigt1.2-2 nigt1.4-1. The nigtQ-1, nigtQ-2, nigtQ-3, and nigtQ-4 represent nigt1.1-1 nigt1.2-1 nigt1.3-2 nigt1.4-1, nigt1.1-1 nigt1.2-1 nigt1.3-1 nigt1.4-1, nigt1.1-1 nigt1.2-2 nigt1.3-2 nigt1.4-1, and nigt1.1-1 nigt1.2-2 nigt1.3-1 nigt1.4-1, respectively. (D) NRT2.4 expression in the root of Col-0, nigtQ-1, and nigtQ-4 seedlings incubated under 0.5× MS (high N availability) or N starvation conditions. Seven-day-old 0.5× MS-grown seedlings were transferred to and incubated on 0.5× MS or MGRL plates without nitrogen (N starvation) for 3 d before harvest. Error bars represent sd (n = 4 independent pools of indicated tissue from more than ten plants). Asterisks indicate statistically significant differences (*P < 0.01 and **P < 0.001, Student’s t test). Expression levels were analyzed by qRT-PCR and normalized using At4g34270 as an internal control. Each experiment was conducted twice with similar results.
Figure 5.
Figure 5.
Expression Patterns of Arabidopsis NIGT1 Subfamily Members. (A) Expression of NIGT1 subfamily members (NIGT1s) and NRT2.4 in shoots (upper panel) and roots (lower panel). Seven-day-old 0.5× MS-grown wild-type (Col-0) seedlings were transferred to MGRL plates with either 5 mM NH4NO3 (NH4NO3) or no nitrogen (N starvation) and incubated for 3 d. Genes that are significantly downregulated under N starvation conditions compared with added NH4NO3 are marked with asterisks (P < 0.01, Student’s t test). U.Q., under the quantification detection limit. Error bars represent sd (n = 6 independent pools of indicated tissue from more than 10 plants). (B) Expression of NIGT1s in whole seedlings in response to different nitrogen species. Seven-day-old 0.5× MS-grown Col-0 seedlings were transferred to MGRL plates containing 3 mM potassium nitrate (NO), 3 mM ammonium chloride (NH), 1.5 mM ammonium nitrate (NHNO), 1.5 mM glutamine (GLN), 1.5 mM urea (UREA), or no nitrogen (−N) and incubated for 3 d. Error bars represent sd (n = 4 independent pools of more than 10 whole plants). Different lowercase letters indicate statistically significant differences (P < 0.05, Tukey’s HSD test). (C) and (D) Time-course analysis of expression of NIGT1s in roots after changes in nitrogen availability. (C) Expression levels of NIGT1s and NRT2.4 in roots during N starvation. Seven-day-old 0.5× MS-grown Col-0 seedlings were transferred to MGRL plates containing 5 mM NH4NO3 (NH4NO3) or no nitrogen (N starvation) and harvested at the indicated times. (D) Expression levels of NIGT1s and NRT2.4 in roots in response to nitrogen supplement. Ten-day-old Col-0 seedlings N starved for 3 d were transferred to NH4NO3 plates or exposed to N starvation conditions and harvested for the indicated times. Error bars represent sd (n = 3 independent pools of more than 10 roots). Expression levels were analyzed by qRT-PCR and normalized using At4g34270 as an internal control. Each experiment was conducted twice with similar results.
Figure 6.
Figure 6.
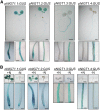
Spatial Expression Patterns of NIGT1 Subfamily Members. (A) Spatial patterns of NIGT1 subfamily gene expression as detected by GUS staining in ProNIGT1.1:GUS (pNIGT1.1:GUS), ProNIGT1.2:GUS (pNIGT1.2:GUS), ProNIGT1.3:GUS (pNIGT1.3:GUS), and ProNIGT1.4:GUS (pNIGT1.4:GUS) transgenic seedlings grown for 3 d on MGRL agar plates containing 5 mM NH4NO3. Lower panels are enlarged pictures of the root tip (left) and mature root region (right). Bars = 4 mm in upper panels and 200 μm in lower panels. (B) GUS activity under high N availability or N starvation conditions. Seven-day-old seedlings were incubated on agar plates containing 5 mM NH4NO3 (+N) or no nitrogen (−N) for 3 d before GUS staining. Bar = 200 μm.
Figure 7.
Figure 7.
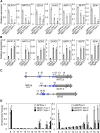
Identification of Target Genes of NIGT1 Subfamily Members. (A) and (B) Venn diagram of NIGT1.2ox downregulated and pER-NIGT1.2-VP upregulated probes in roots (A) and shoots (B). To obtain NIGT1.2ox downregulated probes, 10-d-old NIGT1.2ox (overexpressing NIGT1.2 under control of the CaMV 35S promoter) and wild-type seedlings incubated under N starvation conditions for 3 d were compared. Significantly downregulated probes in NIGT1.2ox were recovered (Welch’s t test, P < 0.05; Benjamini-Hochberg procedure, FDR < 0.1; FC < 0). To obtain pER-NIGT1.2-VP upregulated probes, 9-d-old pER-NIGT1.2-VP seedlings incubated with or without 10 μM Est for 24 h under high N availability were compared, and significantly upregulated probes by Est treatment were recovered (P < 0.05, FDR < 0.1, FC > 0). (C) Representative significantly enriched gene ontology terms common in roots and shoots. Numbers represent ranked P values by Fisher’s exact test. See Supplemental Data Sets 7 and 8 for a complete list. (D) Classification of NIGT1 direct target genes by their response to N starvation. Microarray data obtained from 10-d-old wild-type seedlings incubated in MGRL plates with 5 mM NH4NO3 or without a nitrogen source for 3 d were used. Genes were classified into upregulated (P < 0.05, FDR < 0.1, FC > 0), downregulated (P < 0.05, FDR < 0.1, FC < 0), and not changed (P ≥ 0.05, FDR ≥ 0.1).
Figure 8.
Figure 8.
Validation of NIGT1 Target Genes. (A) Expression of arbitrarily selected genes from the NIGT1 direct target list (GLN1;4, NRT2.5, DUR3, AMT1;1, NLP3, and SPX1) in transgenic plants constitutively expressing NIGT1.1-GFP (NIGT1.1ox) or NIGT1.2-GFP (NIGT1.2ox) fusion genes, or GFP (GFPox) under control of the CaMV 35S promoter under N starvation conditions. Seven-day-old 0.5× MS-grown seedlings were transferred to and incubated on MGRL plates without a nitrogen source for 3 d. Error bars represent sd (n = 3 independent pools of more than 10 whole plants). (B) Expression levels of GLN1;4, NRT2.5, DUR3, AMT1;1, NLP3, and SPX1 in wild type (Col-0) and nigt1.1 nigt1.2 nigt1.3 nigt1.4 quadruple mutants (nigtQ-1 and nigtQ-4) under high N availability. Ten-day-old 0.5× MS-grown seedlings were analyzed. Error bars represent sd (n = 5 independent pools of more than 10 whole plants). (C) and (D) NIGT1s interactions with NRT2.5, GLN1;4, and GDH3 promoters in ChIP assays. (C) Diagrams of the NRT2.5, GLN1;4, and GDH3 loci, the locations of B1 (GAATATTC, red lines) and B2 (GAATC, blue lines) motifs, and the locations of amplicons used in the ChIP assays. (D) ChIP-qPCR assays were performed using 10-d-old transgenic seedlings. Left side: Transgenic lines expressing GFP (GFPox), NIGT1.1-GFP (NIGT1.1ox), or NIGT1.2-GFP (NIGT1.2ox) fusion genes under control of the CaMV 35S promoter were used and immunoprecipitated with anti-GFP antibody. Right side: Transgenic lines expressing GFP-FLAG (eGFPox), NIGT1.3-FLAG (eNIGT1.3ox), or NIGT1.4-FLAG (eNIGT1.3ox) fusion genes under control of the β-estradiol-inducible promoter treated with 10 μM β-estradiol for 24 h were used and immunoprecipitated with an anti-FLAG antibody. The percentages of the DNA coimmunoprecipitated with antibody relative to input DNA are indicated. Numbers on the x axis indicate DNA regions shown in (C). Error bars represent sd (n = 3 independent pools of more than 10 whole plants). Asterisks indicate statistically significant differences (*P < 0.05 and **P < 0.01, Student’s t test). Each experiment was conducted twice with similar results.
Figure 9.
Figure 9.
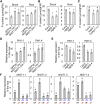
Validation of NIGT1-NIGT1 Promoter Interactions. (A) Expression of NIGT1s in transgenic seedlings constitutively expressing NIGT1.1-GFP (NIGT1.1ox) or NIGT1.2-GFP (NIGT1.2ox) fusion genes or GFP (GFPox) expressed under the control of the CaMV 35S promoter. Ten-day-old 0.5× MS-grown seedlings were used. Error bars represent sd (n = 3 independent pools of more than 10 whole plants). (B) and (C) NIGT1.1 and NIGT1.2 interact with NIGT1 promoters in a ChIP assay. (B) Diagrams of NIGT1 loci, the locations of B1 (GAATATTC, red lines) and B2 (GAATC, blue lines) motifs, and the locations of amplicons used in ChIP assays. (C) ChIP-qPCR assays were performed using 0.5× MS-grown 10-d-old seedlings of GFPox, NIGT1.1ox, or NIGT1.2ox. Percentages of the DNA coimmunoprecipitated with anti-GFP antibody relative to input DNA are indicated. Error bars represent sd (n = 3 independent pools of more than 10 whole plants). Asterisks indicate statistically significant differences (P < 0.01, Student’s t test). Experiments were conducted twice with similar results.
Figure 10.
Figure 10.
Nitrogen and Nitrate Content, and Nitrate Uptake Are Altered in the NIGT1 Overexpressor and nigt1.1 nigt1.2 nigt1.3 nigt1.4 Quadruple Mutant. (A) and (B) N contents of NIGT1 overexpressors grown under N starvation conditions (A) and the nigt1.1 nigt1.2 nigt1.3 nigt1.4 (nigtQ) quadruple mutant grown under high N availability (B). Error bars represent sd (n = 7 independent pools of more than 10 whole plants). (C) and (D) Nitrate contents in shoots and roots of NIGT1 overexpressors grown under N starvation (C) and nigtQ grown under high N availability (D). Error bars represent sd of three (C) and five (D) independent pools of the indicated tissue from more than 10 plants. (E) and (F) Nitrate influx in NIGT1 overexpressors grown under N starvation (E) and nigtQ grown under high N availability (F). Influx was measured after short-term labeling with complete nutrient solution containing 15N-labeled nitrate at the indicated concentrations. LATS activity was calculated by subtracting the influx measured at 0.2 mM nitrate from the influx measured at 6 mM nitrate. Error bars represent sd of five (E) and four (F) independent pools of more than 10 whole plants. (G) and (H) Expression levels of high-affinity nitrate transport-related genes NAR2.1/NRT3.1 (NAR2.1), NRT1.1/NPF6.3 (NRT1.1), and NRT2.1 in roots of NIGT1 overexpressors grown under N starvation conditions (G) and the nigt1.1 nigt1.2 nigt1.3 nigt1.4 (nigtQ) quadruple mutant grown under high N availability (H). Error bars represent sd of four (G) and five (H) in dependent pools of more than ten roots. (A), (C), (E), and (G) Transgenic plants constitutively expressing NIGT1.1-GFP (NIGT1.1ox) or NIGT1.2-GFP (NIGT1.2ox) fusion genes or GFP (GFPox) under control of the CaMV 35S promoter grown for 7 d on 0.5× MS agar plates were transferred to and incubated on MGRL plates without N source for 3 d. (B), (D), (F), and (H) Ten-day-old (F) and 14-d-old ([B], [D], and [H]) 0.5× MS-grown seedlings were used in the assay. Asterisks indicate statistically significant differences (P < 0.05, Student’s t test). Each experiment was conducted twice with similar results.
Figure 11.
Figure 11.
Phosphate Starvation-Related Phenotypes Are Altered in NIGT1 Overexpressors and in the nigt1.1 nigt1.2 nigt1.3 nigt1.4 Quadruple Mutant. (A) and (B) Phosphate (P) content in shoots and roots of the NIGT1 overexpressor (A) and the nigt1.1 nigt1.2 nigt1.3 nigt1.4 quadruple (nigtQ) mutant (B). Fourteen-day-old 0.5× MS-grown seedlings were used in the assay. (C) P content in wild-type (Col-0), the nigt1.1 nigt1.2 nigt1.3 nigt1.4 quadruple mutant, and a complemented line (Comp1-1.2). Fourteen-day-old 0.5× MS-grown seedlings were used in the assay. (D) and (E) Expression levels of phosphate transporter genes involved in phosphate acquisition in roots of 10-d-old 0.5× MS agar plate-grown NIGT1 overexpressor (D) and N-replete nigt1.1 nigt1.2 nigt1.3 nigt1.4 quadruple mutant (E). (F) Expression levels of NIGT1.1 through 1.4 in roots in response to changes in N and P availability. Seven-day-old 0.5× MS-grown wild-type seedlings were transferred to and incubated on MGRL plates with 5 mM NH4NO3 and 1.75 mM phosphate (+N+P), without a nitrogen source (-N+P), without phosphate (+N-P), or without nitrogen and phosphate (-N-P) for 5 d. (A) and (D) Transgenic seedlings constitutively expressing NIGT1.1-GFP (NIGT1.1ox) or NIGT1.2-GFP (NIGT1.2ox) fusion genes or GFP (GFPox) under the control of the CaMV 35S promoter were analyzed. Expression levels were analyzed by qRT-PCR and normalized using At4g34270 as an internal control. Asterisks indicate statistically significant differences (P < 0.05; Student’s t test). Different lowercase letters indicate statistically significant differences as indicated by Tukey’s HSD test (P < 0.01). Error bars represent sd of five ([A], [B], [D], and [E]) and four ([C] and [F]) independent pools of indicated tissues from more than 10 plants. The experiment was conducted twice with similar results.
Figure 12.
Figure 12.
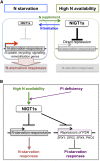
A Model for NIGT1 Functions. (A) A model is proposed for NIGT1 function in the regulation of N starvation responses. Under N starvation, low NIGT1 expression allows N starvation-responsive genes such as genes involved in N uptake, recycling, remobilization, and signaling to be upregulated, leading to N starvation responses. Upon N supplementation, NIGT1s are rapidly induced and directly repress N starvation-responsive genes and attenuate N starvation responses. (B) A model for the role of NIGT1s in balancing N starvation and Pi starvation responses (PSR). NIGT1 expression is positively regulated by Pi deficiency only under high N availability. NIGT1s have a dual role both as a direct repressor of N starvation responses and as an indirect sensitizer of Pi starvation responses by directly repressing repressors of PSR (SPX1, SPX2, SPX4, and PHO2) to balance N and Pi starvation responses.
None

References

    1. Araya T., Miyamoto M., Wibowo J., Suzuki A., Kojima S., Tsuchiya Y.N., Sawa S., Fukuda H., von Wirén N., Takahashi H. (2014). CLE-CLAVATA1 peptide-receptor signaling module regulates the expansion of plant root systems in a nitrogen-dependent manner. Proc. Natl. Acad. Sci. USA 111: 2029–2034. - PMC - PubMed
    1. Avila-Ospina L., Moison M., Yoshimoto K., Masclaux-Daubresse C. (2014). Autophagy, plant senescence, and nutrient recycling. J. Exp. Bot. 65: 3799–3811. - PubMed
    1. Benjamini Y., Hochberg Y. (1995). Controlling the false discovery rate - a practical and powerful approach to multiple testing. J. R. Stat. Soc. Series B Stat. Methodol. 57: 289–300.
    1. Camañes G., Bellmunt E., García-Andrade J., García-Agustín P., Cerezo M. (2012). Reciprocal regulation between AtNRT2.1 and AtAMT1.1 expression and the kinetics of NH4+ and NO3- influxes. J. Plant Physiol. 169: 268–274. - PubMed
    1. Carter C., Pan S., Zouhar J., Avila E.L., Girke T., Raikhel N.V. (2004). The vegetative vacuole proteome of Arabidopsis thaliana reveals predicted and unexpected proteins. Plant Cell 16: 3285–3303. - PMC - PubMed

Publication types

MeSH terms