

Genome-Wide Associations of Global Electrical Heterogeneity ECG Phenotype: The ARIC (Atherosclerosis Risk in Communities) Study and CHS (Cardiovascular Health Study)
- PMID: 29622589
- PMCID: PMC6015433
- DOI: 10.1161/JAHA.117.008160
Genome-Wide Associations of Global Electrical Heterogeneity ECG Phenotype: The ARIC (Atherosclerosis Risk in Communities) Study and CHS (Cardiovascular Health Study)
Abstract
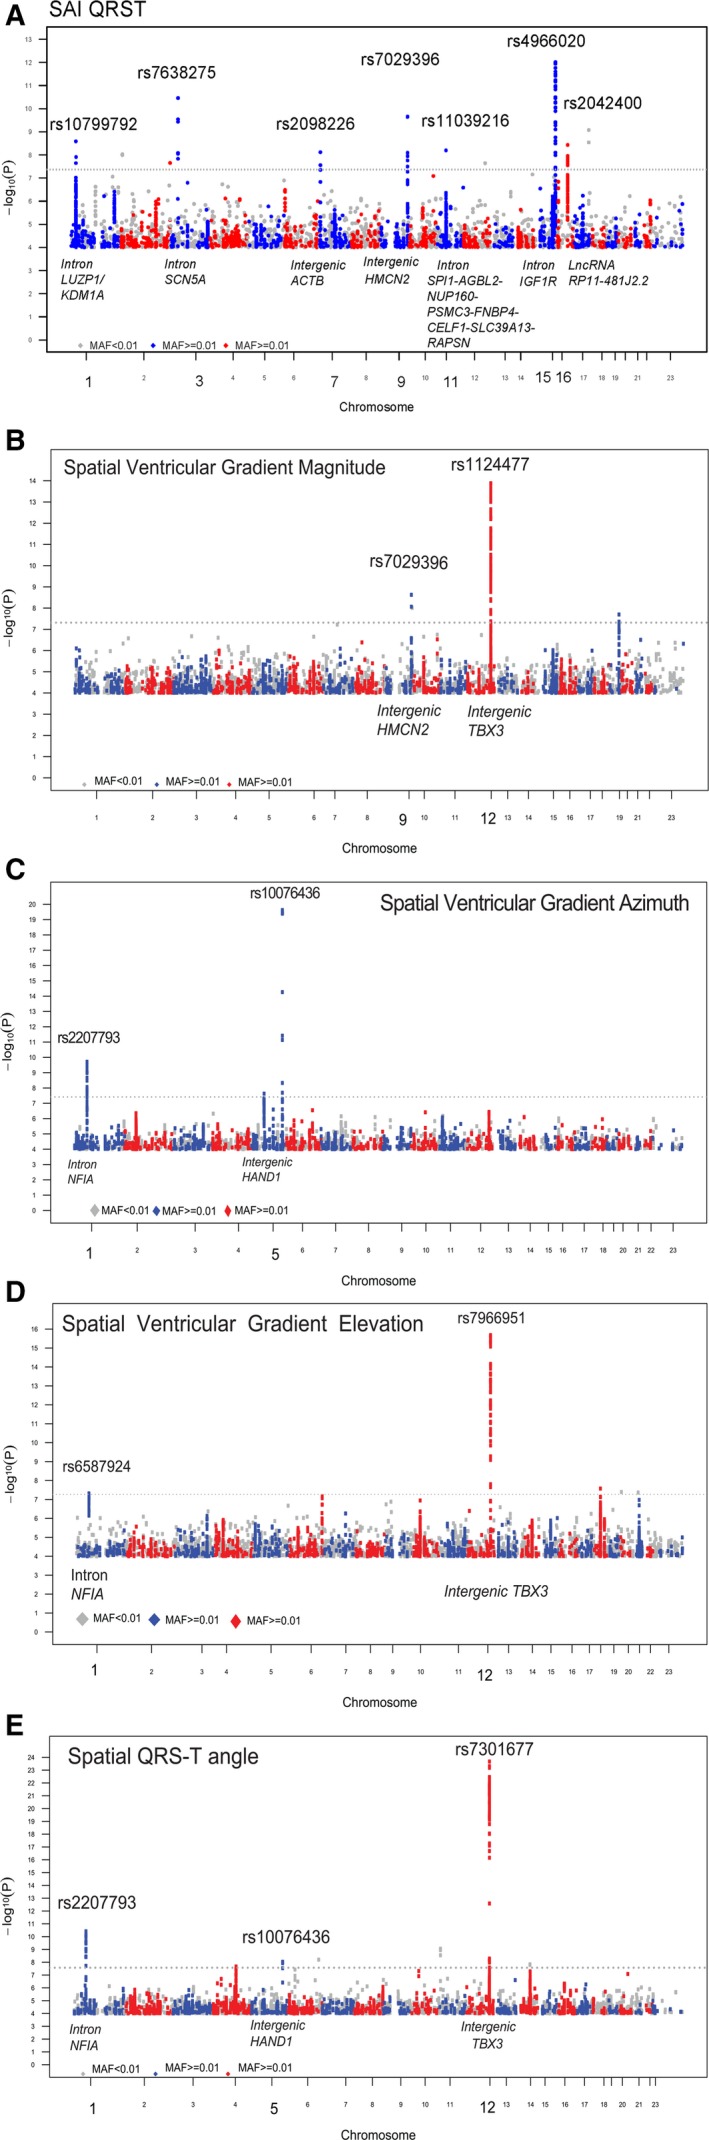
Background: ECG global electrical heterogeneity (GEH) is associated with sudden cardiac death. We hypothesized that a genome-wide association study would identify genetic loci related to GEH.
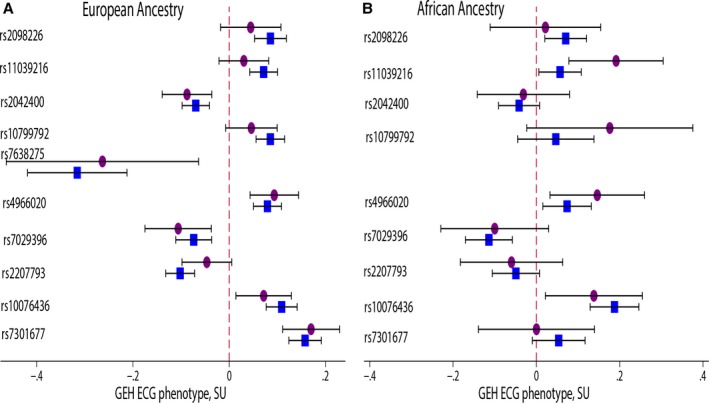
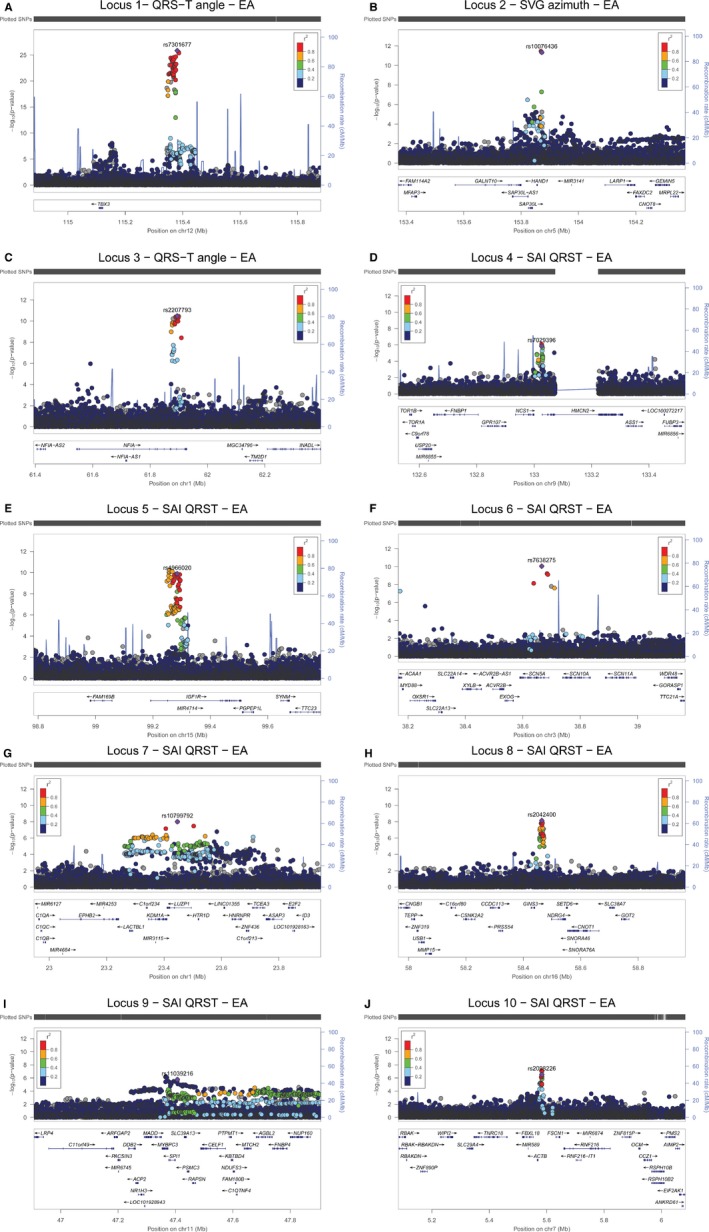
Methods and results: We tested genotyped and imputed variants in black (N=3057) and white (N=10 769) participants in the ARIC (Atherosclerosis Risk in Communities) study and CHS (Cardiovascular Health Study). GEH (QRS-T angle, sum absolute QRST integral, spatial ventricular gradient magnitude, elevation, azimuth) was measured on 12-lead ECGs. Linear regression models were constructed with each GEH variable as an outcome, adjusted for age, sex, height, body mass index, study site, and principal components to account for ancestry. GWAS identified 10 loci that showed genome-wide significant association with GEH in whites or joint ancestry. The strongest signal (rs7301677, near TBX3) was associated with QRS-T angle (white standardized β+0.16 [95% CI 0.13-0.19]; P=1.5×10⁻²⁶), spatial ventricular gradient elevation (+0.11 [0.08-0.14]; P=2.1×10⁻¹²), and spatial ventricular gradient magnitude (-0.12 [95% CI -0.15 to -0.09]; P=5.9×10⁻¹⁵). Altogether, GEH-SNPs explained 1.1% to 1.6% of GEH variance. Loci on chromosomes 4 (near HMCN2), 5 (IGF1R), 11 (11p11.2 region cluster), and 7 (near ACTB) are novel ECG phenotype-associated loci. Several loci significantly associated with gene expression in the left ventricle (HMCN2 locus-with HMCN2; IGF1R locus-with IGF1R), and atria (RP11-481J2.2 locus-with expression of a long non-coding RNA and NDRG4).
Conclusions: We identified 10 genetic loci associated with ECG GEH. Replication of GEH GWAS findings in independent cohorts is warranted. Further studies of GEH-loci may uncover mechanisms of arrhythmogenic remodeling in response to cardiovascular risk factors.
Keywords: ECG; electrocardiography; genome wide association study; global electrical heterogeneity; spatial ventricular gradient; sum absolute QRST integral.
© 2018 The Authors. Published on behalf of the American Heart Association, Inc., by Wiley.
Figures


References
-
- Wilson FN, Macleod AG, Barker PS, Johnston FD. The determination and the significance of the areas of the ventricular deflections of the electrocardiogram. Am Heart J. 1934;10:46–61.
-
- Burch GE, Winsor T. A Primer of Electrocardiography. Philadelphia: Lea & Febiger; 1945.
-
- Burger HC. A theoretical elucidation of the notion ventricular gradient. Am Heart J. 1957;53:240–246. - PubMed
-
- Wilson FN, MacLeod AG, Barker PS. The T deflection of the electrocardiogram. Trans Assoc Am Physicians. 1931;46:29–38.
-
- Vassallo JA, Cassidy DM, Kindwall KE, Marchlinski FE, Josephson ME. Nonuniform recovery of excitability in the left ventricle. Circulation. 1988;78:1365–1372. - PubMed
Publication types
MeSH terms
Grants and funding
- R01 HL120393/HL/NHLBI NIH HHS/United States
- N01 HC085082/HL/NHLBI NIH HHS/United States
- R01 HL087652/HL/NHLBI NIH HHS/United States
- R01 HL105756/HL/NHLBI NIH HHS/United States
- N01HC55222/HL/NHLBI NIH HHS/United States
- N01 HC085079/HL/NHLBI NIH HHS/United States
- HHSN268201000021C/HL/NHLBI NIH HHS/United States
- UL1 TR001881/TR/NCATS NIH HHS/United States
- HHSN268201700003I/HL/NHLBI NIH HHS/United States
- R01 HL103612/HL/NHLBI NIH HHS/United States
- N01 HC085080/HL/NHLBI NIH HHS/United States
- N01HC85080/HL/NHLBI NIH HHS/United States
- UL1 RR025005/RR/NCRR NIH HHS/United States
- U01 HL080295/HL/NHLBI NIH HHS/United States
- HHSN268201700004C/HB/NHLBI NIH HHS/United States
- U01 HL130114/HL/NHLBI NIH HHS/United States
- HHSN268200800007C/HL/NHLBI NIH HHS/United States
- N01 HC085086/HL/NHLBI NIH HHS/United States
- R01 HL085251/HL/NHLBI NIH HHS/United States
- N01 HC085083/HL/NHLBI NIH HHS/United States
- U01 HG004402/HG/NHGRI NIH HHS/United States
- N01HC85082/HL/NHLBI NIH HHS/United States
- UL1 TR000124/TR/NCATS NIH HHS/United States
- P30 DK063491/DK/NIDDK NIH HHS/United States
- N01HC85079/HL/NHLBI NIH HHS/United States
- R01 HL118277/HL/NHLBI NIH HHS/United States
- N01HC85083/HL/NHLBI NIH HHS/United States
- HHSN268201200036C/HL/NHLBI NIH HHS/United States
- HHSN268201700001I/HL/NHLBI NIH HHS/United States
- N01 HC055222/HL/NHLBI NIH HHS/United States
- N01HC85086/HL/NHLBI NIH HHS/United States
- HHSN268201700004I/HL/NHLBI NIH HHS/United States
- HHSN268201700005C/HL/NHLBI NIH HHS/United States
- HHSN268201700001C/HL/NHLBI NIH HHS/United States
- HHSN268201700002C/HB/NHLBI NIH HHS/United States
- HHSN268201700003C/HL/NHLBI NIH HHS/United States
- HHSN268201700002I/HL/NHLBI NIH HHS/United States
- HHSN268201700005I/HL/NHLBI NIH HHS/United States
- HHSN268201700021C/HL/NHLBI NIH HHS/United States
- N01HC85081/HL/NHLBI NIH HHS/United States
- R01 AG023629/AG/NIA NIH HHS/United States
- N01 HC085081/HL/NHLBI NIH HHS/United States
- R01 HL111089/HL/NHLBI NIH HHS/United States
- R01 HL116747/HL/NHLBI NIH HHS/United States
LinkOut - more resources
Full Text Sources
Other Literature Sources
Medical
Miscellaneous
