. 2018 Apr 6;360(6384):99-102.
doi: 10.1126/science.aan8795.

Cell cycle heterogeneity directs the timing of neural stem cell activation from quiescence

Affiliations

Cell cycle heterogeneity directs the timing of neural stem cell activation from quiescence

L Otsuki et al. Science. .

Abstract

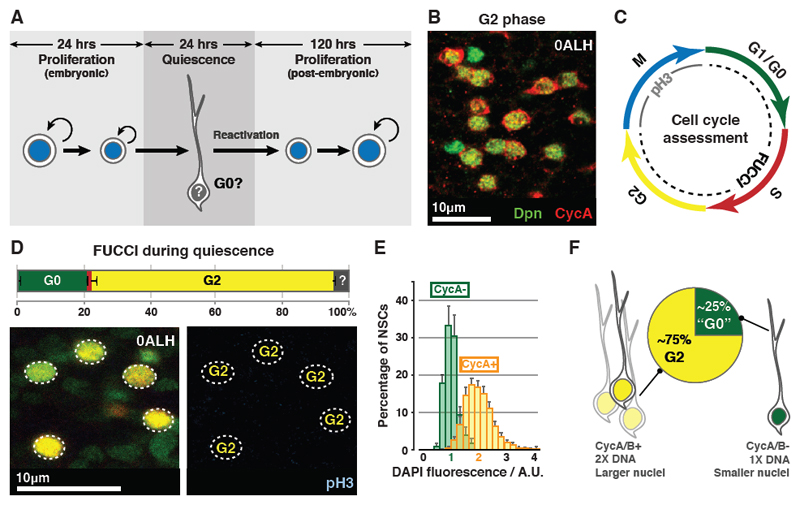
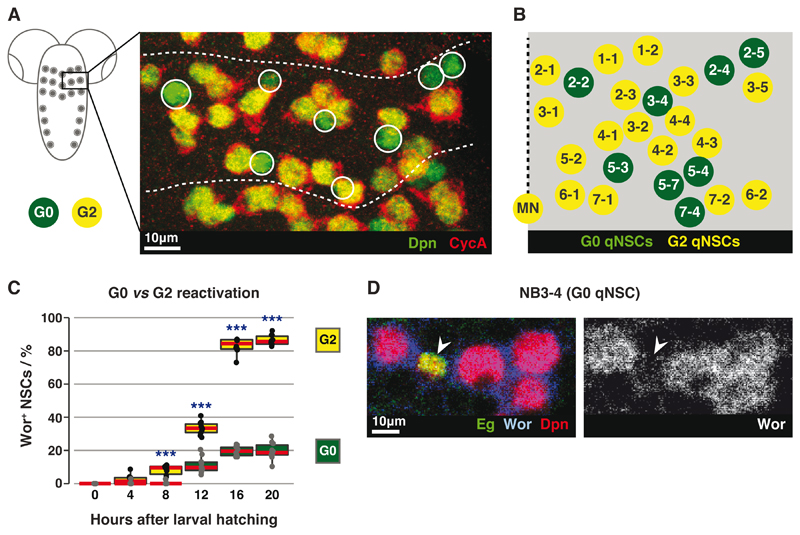
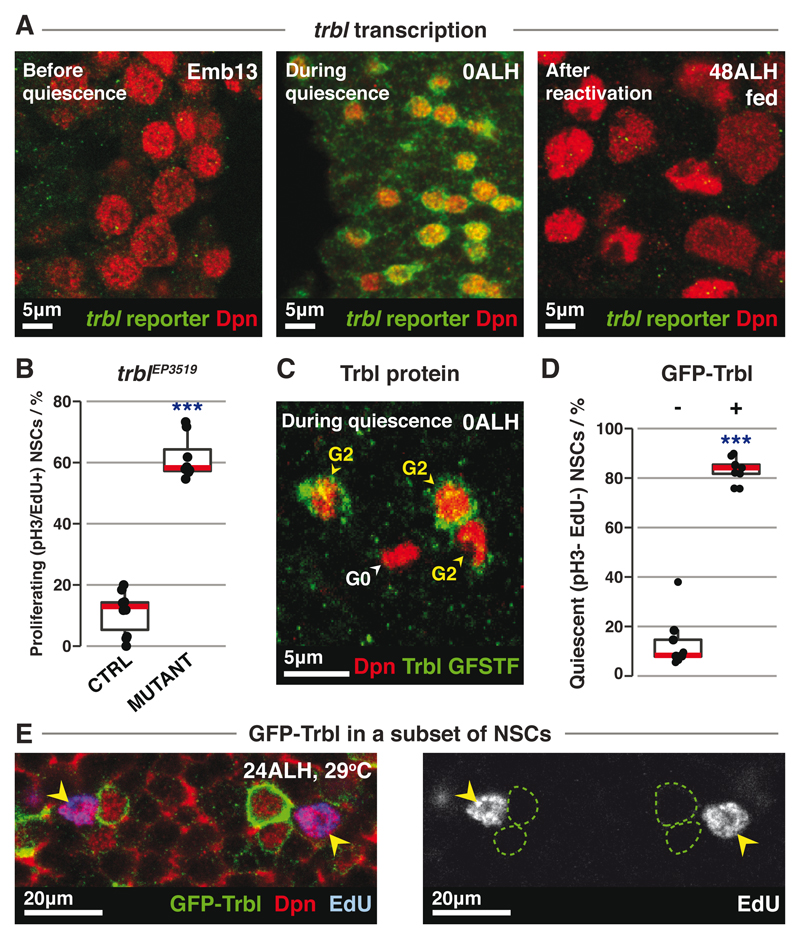
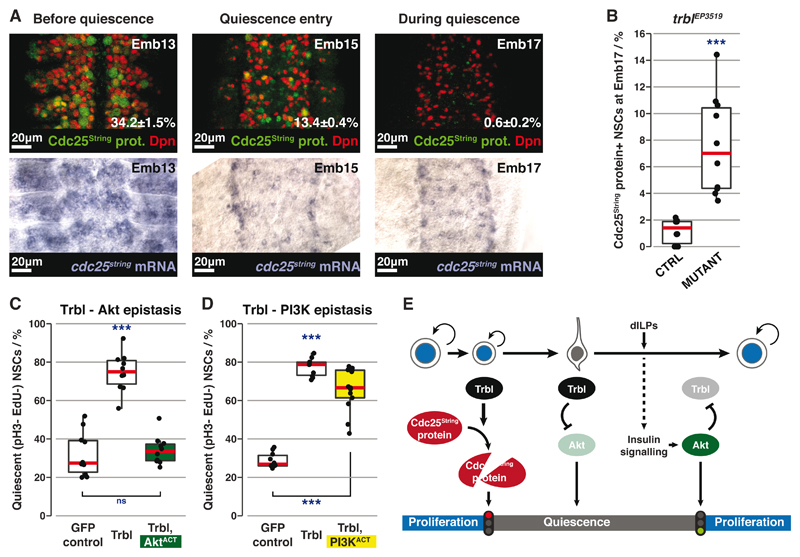
Quiescent stem cells in adult tissues can be activated for homeostasis or repair. Neural stem cells (NSCs) in Drosophila are reactivated from quiescence in response to nutrition by the insulin signaling pathway. It is widely accepted that quiescent stem cells are arrested in G0 In this study, however, we demonstrate that quiescent NSCs (qNSCs) are arrested in either G2 or G0 G2-G0 heterogeneity directs NSC behavior: G2 qNSCs reactivate before G0 qNSCs. In addition, we show that the evolutionarily conserved pseudokinase Tribbles (Trbl) induces G2 NSCs to enter quiescence by promoting degradation of Cdc25String and that it subsequently maintains quiescence by inhibiting Akt activation. Insulin signaling overrides repression of Akt and silences trbl transcription, allowing NSCs to exit quiescence. Our results have implications for identifying and manipulating quiescent stem cells for regenerative purposes.


Conflict of interest statement

Competing interests: The authors declare no conflict of interest.

Figures

Fig. 1
Fig. 1. qNSCs arrest in G0 or G2.
(A) qNSCs are smaller than proliferating NSCs and extend a primary process, which is retracted upon activation from quiescence. Proliferating NSCs in the embryo do not exhibit a primary process prior to entering quiescence. (B) 73±0.79% of qNSCs (green) are CycA+ (red). n=10 tVNCs, ~150 NSCs each. (C) Cell cycle phase assessment using FUCCI and pH3. (D) Percentages of NSCs (outlined) in each cell cycle phase during quiescence. Colours as in (C). n=5 tVNCs, ~150 NSCs each. ?: undetermined. (E) DAPI intensities of CycA+ and CycA- qNSC nuclei are significantly different (p=2.20x10⁻¹⁶, Kolgomorov-Smirnov test). n=10 tVNCs, ~75 NSCs each. A.U.: arbitrary units. 1 A.U.: mean DAPI intensity of the CycA- population. Error bars indicate S.E.M. (F) Features of G2 and G0 qNSCs. Images are single section confocal images, unless indicated otherwise, and anterior is up in this and all subsequent figures.
Fig. 2
Fig. 2. G2 qNSCs reactivate before G0 qNSCs.
(A) Maximum intensity projection of a tVNC hemi-segment, stained for G2 (yellow) and G0 (green; circled) qNSCs. Dotted lines indicate hemi-segment boundaries. (B) Positions and identities of G0 qNSCs (green) within a hemi-segment. Dotted line represents the midline. Schematic modified from (12). (C) Quantification of Wor+ G0 or G2 qNSCs. n=10 tVNCs/time point, ~150 NSCs each. ***: p<1.39x10⁻⁵, two-tailed paired t-tests. Red lines indicate medians. (D) NB3-4 (Eg+; arrowed), remains small and Wor-negative at 20ALH, while neighbouring G2 qNSCs have reactivated.
Fig. 3
Fig. 3. trbl regulates G2 qNSCs.
(A) trbl reporter expression (green) in NSCs (red) before, during and after quiescence. (B) Quantification of proliferating NSCs in control (n=10) vs trblEP3519 mutant (n=8) tVNCs, with ~120 NSCs each. ***: p=7.06x10⁻¹⁴, Student’s t-test. (C) Trbl protein expression (green) in G2 (CycA+) or G0 (CycA-) qNSCs (red). (D) Quantification of qNSCs in grh-GAL4>GFP-Trbl tVNCs. “-” and “+” denote GFP-Trbl- and GFP-Trbl+ NSCs respectively. n=9 tVNCs, ~150 NSCs each. ***: p=3.90x10⁻⁴, Wilcoxon signed-rank test. (E) In grh-GAL4>GFP-Trbl brains, GFP-Trbl+ NSCs (green outlines) do not incorporate EdU, while control NSCs (yellow arrowheads) do. Red lines indicate medians.
Fig. 4
Fig. 4. Trbl induces and maintains quiescence through different mechanisms.
(A) Top row: Cdc25String protein (green) expression in NSCs (red) before and during quiescence (percentages are mean±SEM). n=10 tVNCs/time point, ~130 NSCs each. Maximum intensity projections. Bottom row: In situ hybridisation against cdc25string mRNA at the same stages. (B) Percentages of Cdc25String protein+ NSCs in control (trblEP3519 heterozygote) vs mutant tVNCs. n=10 tVNCs/genotype, ~110 NSCs each. ***: p=9.08x10⁻⁵, Kolgomorov-Smirnov test. (C and D) Quantification of qNSCs in epistasis experiments between GFP-Trbl and AktACT (C) or PI3KACT (D). n>10 tVNCs/condition, ~80 NSCs each. ***: p<3.39x10⁻⁹. ns: p>0.05, one way ANOVA followed by post-hoc Tukey’s HSD test. In (D), there is no significant difference between GFP-Trbl alone and GFP-Trbl+PI3KACT. (E) Three-step model for Trbl activity. Red lines indicate medians.

References

    1. Truman JW, Bate M. Developmental Biology. 1988;125:145–157. - PubMed
    1. Prokop A, Technau GM. Development. 1991
    1. Britton JS, Edgar BA. Development. 1998;125:2149–2158. - PubMed
    1. Chell JM, Brand AH. Cell. 2010;143:1161–1173. - PMC - PubMed
    1. Spéder P, Brand AH. Developmental Cell. 2014;30:309–321. - PMC - PubMed

Publication types