. 2018 May 25;293(21):8264-8274.
doi: 10.1074/jbc.RA118.002128. Epub 2018 Apr 5.

An intersubunit electrostatic interaction in the GABAA receptor facilitates its responses to benzodiazepines

Affiliations

An intersubunit electrostatic interaction in the GABAA receptor facilitates its responses to benzodiazepines

Natasha C Pflanz et al. J Biol Chem. .

Abstract

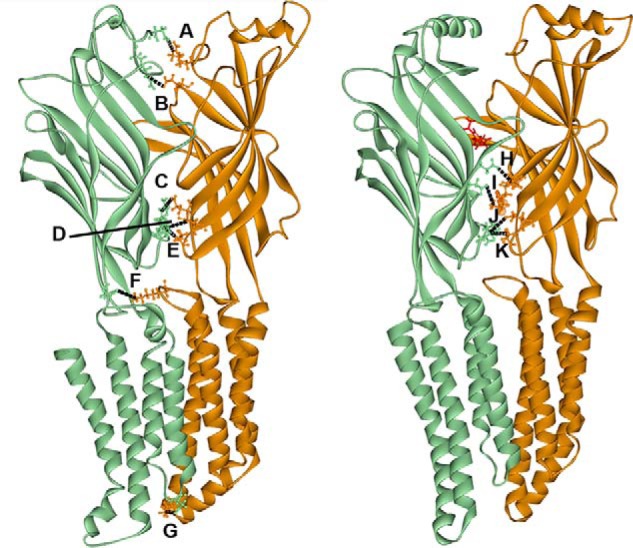
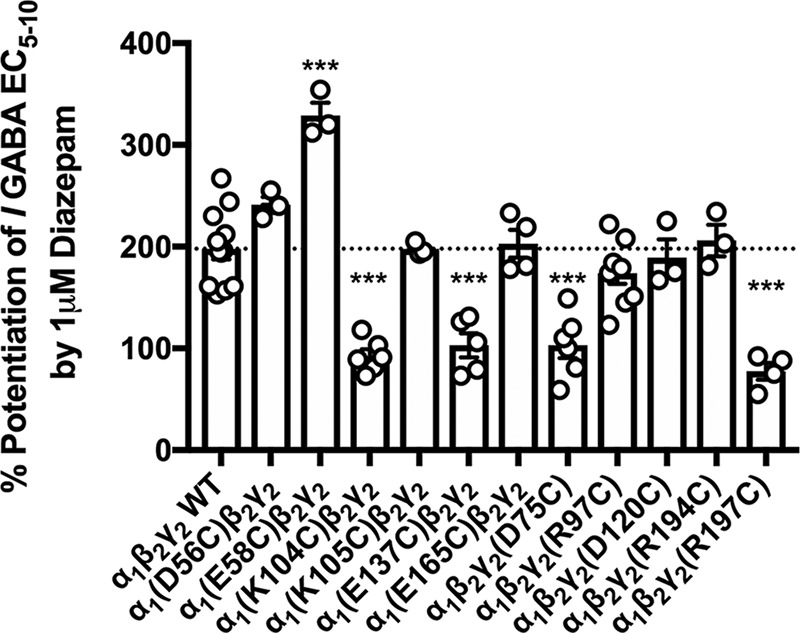
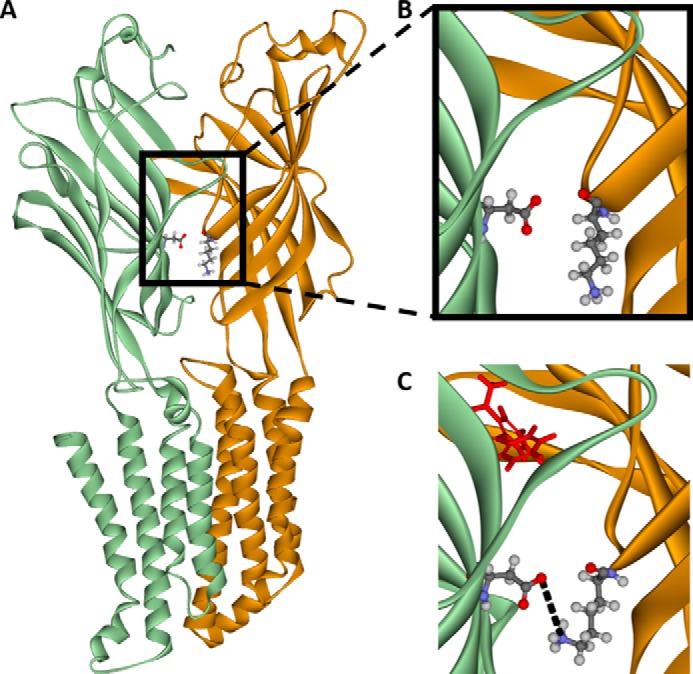
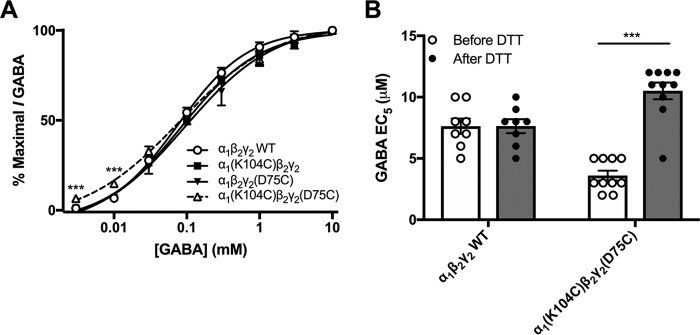
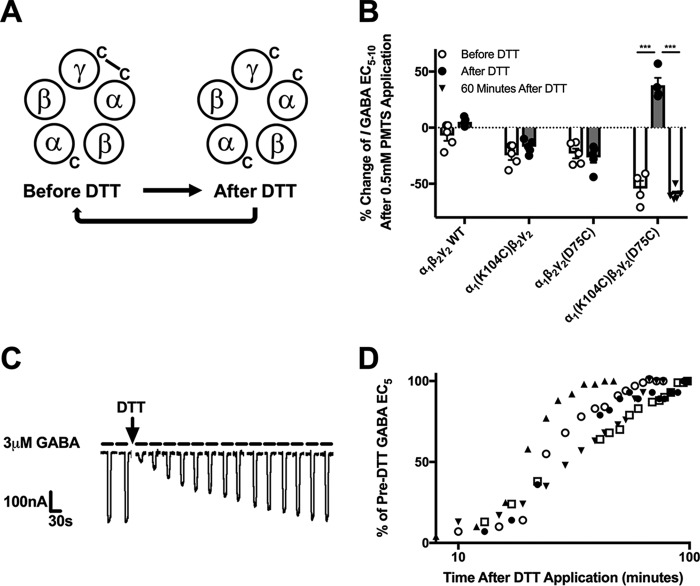
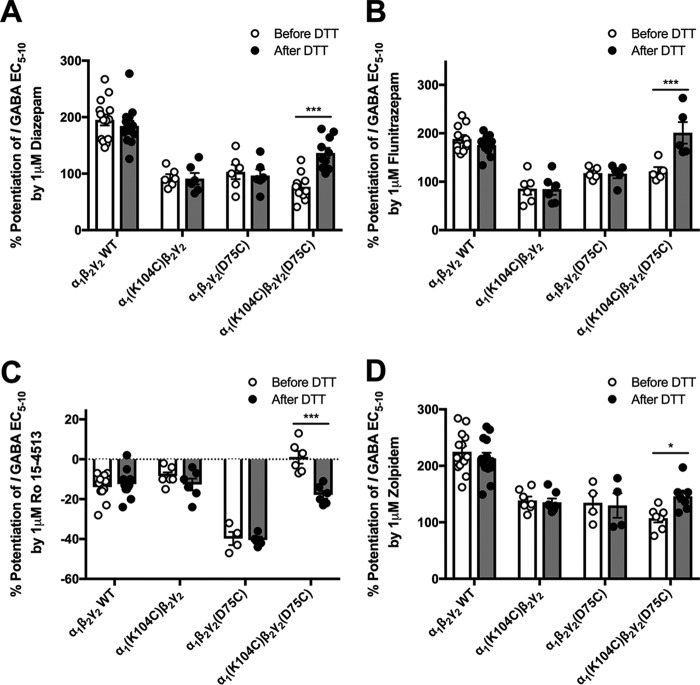
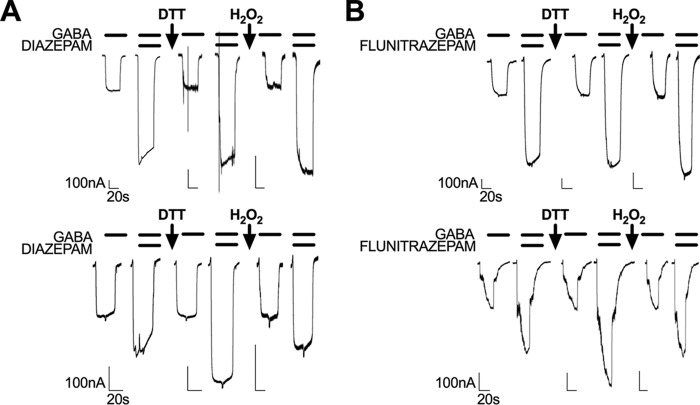
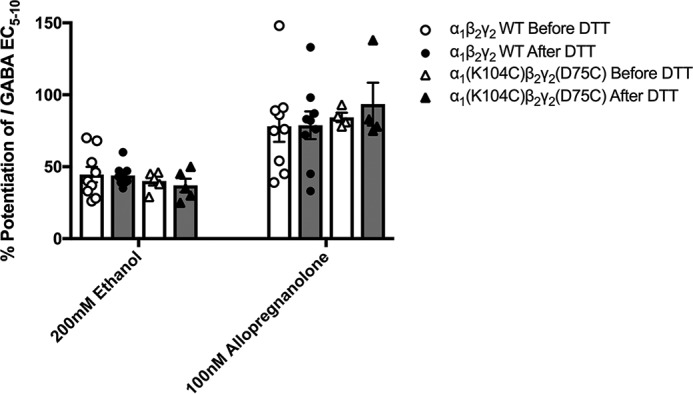
Benzodiazepines are positive allosteric modulators of the GABAA receptor (GABAAR), acting at the α-γ subunit interface to enhance GABAAR function. GABA or benzodiazepine binding induces distinct conformational changes in the GABAAR. The molecular rearrangements in the GABAAR following benzodiazepine binding remain to be fully elucidated. Using two molecular models of the GABAAR, we identified electrostatic interactions between specific amino acids at the α-γ subunit interface that were broken by, or formed after, benzodiazepine binding. Using two-electrode voltage clamp electrophysiology in Xenopus laevis oocytes, we investigated these interactions by substituting one or both amino acids of each potential pair. We found that Lys104 in the α1 subunit forms an electrostatic bond with Asp75 of the γ2 subunit after benzodiazepine binding and that this bond stabilizes the positively modified state of the receptor. Substitution of these two residues to cysteine and subsequent covalent linkage between them increased the receptor's sensitivity to low GABA concentrations and decreased its response to benzodiazepines, producing a GABAAR that resembles a benzodiazepine-bound WT GABAAR. Breaking this bond restored sensitivity to GABA to WT levels and increased the receptor's response to benzodiazepines. The α1 Lys104 and γ2 Asp75 interaction did not play a role in ethanol or neurosteroid modulation of GABAAR, suggesting that different modulators induce different conformational changes in the receptor. These findings may help explain the additive or synergistic effects of modulators acting at the GABAAR.

Keywords: Cys-loop receptor; GABA receptor; Xenopus; allosteric regulation; benzodiazepines; cysteine-mediated cross-linking; electrophysiology; electrostatics; ionotropic receptor; sedative.


Conflict of interest statement

The authors declare that they have no conflicts of interest with the contents of this article

Figures

Figure 1.
Figure 1.
Two different homology models of the α1 (orange)–γ2 (green) interface of the GABAAR. The model on the left is based on a modified ivermectin-unbound GluCl crystal structure (17) and represents the GABA-unbound closed state of the channel. The model on the right is based on the glutamate-bound GluCl crystal structure with a contribution from the ELIC crystal structure (18) and represents the diazepam (in red)-bound receptor. Both models depict the inside of the interface. Labeled interactions represent putative electrostatic interactions of residues 6 Å or less apart that are predicted to occur between residues in the α1 and γ2 subunits before (A–F) or after (H–K) diazepam binding. A, α1 Arg28–γ2 Asp26; 5 Å. B, α1 Glu165–γ2 Arg97; 4 Å. C, α1 Glu137–γ2 Arg194; 5 Å. D, α1 Glu58–γ2 Arg197; 5 Å. E, α1 Asp56–γ2 Arg197; 5 Å. F, α1 Lys278–γ2 Asp161; 5 Å. G, α1 Lys311–γ2 Asp260; 3 Å. H, α1 Lys105–γ2 Asp120; 5 Å. I, α1 Lys104–γ2 Asp75; 5 Å. J, α1 Glu58–γ2 Arg197; 5 Å. K, α1 Asp56–γ2 Arg197; 6 Å. Black dashed lines represent intersubunit bonds.
Figure 2.
Figure 2.
Diazepam enhancement of GABAAR function is altered in some cysteine mutations of residues predicted to form electrostatic interactions at the α1–γ2 subunit interface. EC5–10 GABA was applied alone as well as in the presence of 1 μm diazepam to WT and multiple cysteine-substituted receptors. The horizontal dashed line indicates the level of potentiation produced by diazepam in WT receptors. A one-way ANOVA showed a significant effect of cysteine substitution on receptor enhancement by 1 μm diazepam (F(11,60) = 26.310, p < 0.001). A post hoc Tukey's test showed a significant change (p < 0.001) in potentiation by 1 μm diazepam in α1(E58C, α1(K104C)-, α1(E137C)-, γ2(D75C)-, and γ2(R197C)-containing GABAAR. Each symbol represents the percent potentiation of the GABA EC5–10 seen in one oocyte, and each bar represents the mean percent potentiation. Error bars represent the S.E.
Figure 3.
Figure 3.
Homology models of the α1 (orange)–γ2 (green) interface inside the GABAA receptor in both the GABA-unbound closed state of the channel and the diazepam-bound open state of the channel. These models predict that the nitrogen atom of α1 lysine 104 (orange residue) and oxygen atom of γ2 aspartic acid 75 (green residue) are within 9 Å of each other before GABA and diazepam bind (A and enlarged in B) but move to within 5 Å of each other after GABA and diazepam (in red) bind to the receptor (C).
Figure 4.
Figure 4.
Formation and breakage of the disulfide bond between α1(K104C) and γ2(D75C) affects responses to GABA. A, GABA concentration-response curves were generated in WT α1β2γ2, single mutants α1(K104C)β2γ2 and α1β2γ2(D75C), and double mutant α1(K104C)β2γ2(D75C) GABAA receptors. A repeated-measures ANOVA revealed no difference in the concentration-response curve between WT and mutant receptors. However, one-way ANOVAs showed significant effects of mutation at 3 μm (F(3,26) = 15.504, p < 0.001) and 10 μm GABA (F(3,26) = 18.163, p < 0.001) with a Tukey's post hoc test at both concentrations showing a significant increase in response in α1(K104C)β2γ2(D75C) receptors compared with the other three receptors (***, p < 0.001). Some symbols are hidden behind other symbols. B, DTT (2 mm; dark symbols and bars) increased the absolute concentration of GABA required to produce an EC5 response in α1(K104C)β2γ2(D75C) but not WT receptors. A two-way ANOVA followed by a Tukey's post hoc test revealed a significant effect of DTT treatment on α1(K104C)β2γ2(D75C) receptors (***, p < 0.001). Each symbol represents the GABA EC5 of one oocyte, and each bar represents the mean GABA EC5. Error bars represent the S.E.
Figure 5.
Figure 5.
α1(K104C)β2γ2(D75C) receptors spontaneously cross-link and reform this cross-link after DTT application. A, illustration depicting the disulfide bond that spontaneously cross-links the α1 and γ2 subunits of the α1(K104C)β2γ2(D75C) GABAAR, is broken after DTT application, and slowly reforms over time. B, effect of PMTS application on currents elicited by the GABA EC5–10 of WT, α1(K104C)β2γ2, α1β2γ2(D75C), and α1(K104C)β2γ2(D75C) GABAA receptors. The change in GABA EC5–10 currents by PMTS was decreased in single mutant receptors both before (F(3,18) = 14.56, p < 0.05) and after (F(3,18) = 45.45, p < 0.001) DTT application compared with those seen in WT receptors. The change in EC5–10 currents produced by PMTS was not significantly altered after DTT application to WT or single mutant receptors but did significantly change in double mutant receptors (F(3,37) = 41.698, p < 0.001)). A one-way ANOVA showed a significant effect of time after DTT treatment (pre-DTT treatment, 5 min after, and 60 min after) on α1(K104C)β2γ2(D75C) GABAAR (F(2,13) = 108.363, p < 0.001), and a Tukey's post hoc test showed a significant difference between pre-DTT and 5 min after DTT application and a significant difference between 5 min after DTT and 60 min after DTT (***, p < 0.001; each symbol represents an oocyte, and each bar represents the mean response. Error bars represent the S.E.). C, sample tracing showing spontaneous reformation of the α1–γ2 intersubunit disulfide bond in the α1(K104C)β2γ2(D75C) GABAAR. The GABA EC5 measured in the oocyte before DTT application was 3 μm GABA, but after DTT application 3 μm GABA elicited a much smaller response. After ∼60 min, the response to 3 μm GABA had returned to pre-DTT levels. D, time courses of EC5 values plotted for five oocytes expressing α1(K104C)β2γ2(D75C) receptors returning to their pre-DTT values. This can also be interpreted as the time required to reform the disulfide bond after DTT application. The average time to return to half of the pre-DTT EC5 was 26.9 ± 2.5 min.
Figure 6.
Figure 6.
Benzodiazepine responses of WT and mutant GABAA receptors before (white symbols and bars) and after (dark symbols and bars) DTT application. Bar graphs show the percent potentiation of GABA EC5–10 in WT, α1(K104C)β2γ2, α1β2γ2(D75C), and α1(K104C)β2γ2(D75C) GABAA receptors produced by 1 μm diazepam (A), flunitrazepam (B), Ro 15-4513 (C), and zolpidem (D). A two-way ANOVA followed by a Tukey's multiple comparison post hoc test showed a significant increase in all benzodiazepine-site responses after DTT application to α1(K104C)β2γ2(D75C) GABAA receptors but not WT or single mutant receptors (*, p < 0.05; ***, p < 0.001 with each symbol representing the percent potentiation of the GABA EC5–10 seen in one oocyte, and each bar representing the mean percent potentiation. Error bars represent the S.E.).
Figure 7.
Figure 7.
Sample tracings showing the effects of DTT and H2O2 treatment on potentiation by 1 μm diazepam and 1 μm flunitrazepam. The top panels show tracings obtained from oocytes expressing WT receptors, and the bottom panels show tracings of oocytes expressing α1(K104C)β2γ2(D75C) GABAA receptors. DTT application to α1(K104C)β2γ2(D75C) receptors increased both diazepam (A) and flunitrazepam (B) potentiation, and hydrogen peroxide application reversed this increase back to pre-DTT levels.
Figure 8.
Figure 8.
Modulators acting at sites other than the benzodiazepine site at WT and cysteine-substituted GABAA receptors are unaffected by DTT treatment. Before modulator effects were tested, the EC5–10 concentration of GABA was determined in each oocyte. Effects of 200 mm ethanol and 100 nm allopregnanolone were measured in WT and α1(K104C)β2γ2(D75C) GABAA receptors before (white symbols and bars) and after (dark symbols and bars) application of DTT with no significant changes being observed (two-way ANOVAs; 200 mm ethanol (F(3,43) = 0.031); 100 nm allopregnanolone (F(3,45) = 0.176). Each symbol represents the percent potentiation of the GABA EC5–10 seen in one oocyte, and each bar represents the mean percent potentiation. Error bars represent the S.E.
Figure 9.
Figure 9.
Effect of alanine substitution at α1 Lys104 and γ2 Asp75 on GABA sensitivity and benzodiazepine responses. A, GABA concentration-response curves of WT, α1(K104A)β2γ2, α1β2γ2(D75A), and α1(K104A)β2γ2(D75A) receptors. The concentration-response curves were significantly different (F(21,132) = 1.937, p < 0.05). Each symbol represents the data from three to six oocytes, and error bars represent the S.E. In some cases, error bars fall within symbols. B, bar graph comparing levels of diazepam and flunitrazepam potentiation between WT and alanine-substituted receptors. Potentiation of GABA EC5–10 by 1 μm diazepam and 1 μm flunitrazepam was decreased for single but not double alanine substitution mutants compared with WT receptors. A one-way ANOVA revealed a significant effect of mutant on receptor potentiation by diazepam (F(3,23) = 51.407, p < 0.001) and flunitrazepam (F(3,19) = 26.926, p < 0.001). Each symbol represents the percent potentiation observed in one oocyte, and each bar represents the mean percent potentiation. Error bars represent the S.E.
Figure 10.
Figure 10.
Charge reversal at α1 Lys104 and γ2 Asp75 does not rescue GABA sensitivity or benzodiazepine responses to WT responses. A, the α1(K104D)β2γ2(D75K) receptor GABA concentration-response curve is significantly right-shifted compared with WT receptors (F(8,105) = 2.8, p < 0.01). The EC50 for WT receptors was 86.8 ± 16.5 μm, increasing to 146.3 ± 23.1 μm for the α1(K104D)β2γ2(D75K) GABAAR. Each symbol represents the mean from five to six oocytes, and error bars represent the S.E. B, bar graph comparing levels of benzodiazepine enhancement between α1(K104D)β2γ2(D75K) and WT receptors. The α1(K104D)β2γ2(D75K) GABAAR was unable to fully rescue responses to WT levels of potentiation by 1 μm diazepam and Ro 15-4513 but was able to rescue the responses to 1 μm flunitrazepam and zolpidem. Each symbol represents the percent potentiation of the GABA EC5–10 seen in one oocyte, and each bar represents the mean potentiation observed. Error bars represent the S.E.

References

    1. Rogers C. J., Twyman R. E., and Macdonald R. L. (1994) Benzodiazepine and β-carboline regulation of single GABAA receptor channels of mouse spinal neurones in culture. J. Physiol. 475, 69–82 10.1113/jphysiol.1994.sp020050 - DOI - PMC - PubMed
    1. Twyman R. E., Rogers C. J., and Macdonald R. L. (1989) Differential regulation of γ-aminobutyric acid receptor channels by diazepam and phenobarbital. Ann. Neurol. 25, 213–220 10.1002/ana.410250302 - DOI - PubMed
    1. Study R. E., and Barker J. L. (1981) Diazepam and pentobarbital: fluctuation analysis reveals different mechanisms for potentiation of γ-aminobutyric acid responses in cultured central neurons. Proc. Natl. Acad. Sci. U.S.A. 78, 7180–7184 10.1073/pnas.78.11.7180 - DOI - PMC - PubMed
    1. Downing S. S., Lee Y. T., Farb D. H., and Gibbs T. T. (2005) Benzodiazepine modulation of partial agonist efficacy and spontaneously active GABAA receptors supports an allosteric model of modulation. Br. J. Pharmacol. 145, 894–906 10.1038/sj.bjp.0706251 - DOI - PMC - PubMed
    1. Campo-Soria C., Chang Y., and Weiss D. S. (2006) Mechanism of action of benzodiazepines on GABAA receptors. Br. J. Pharmacol. 148, 984–990 10.1038/sj.bjp.0706796 - DOI - PMC - PubMed

Publication types

LinkOut - more resources