. 2018 May 4;360(6388):543-548.
doi: 10.1126/science.aao0645. Epub 2018 Apr 5.

Morphogen gradient reconstitution reveals Hedgehog pathway design principles

Affiliations

Morphogen gradient reconstitution reveals Hedgehog pathway design principles

Pulin Li et al. Science. .

Abstract

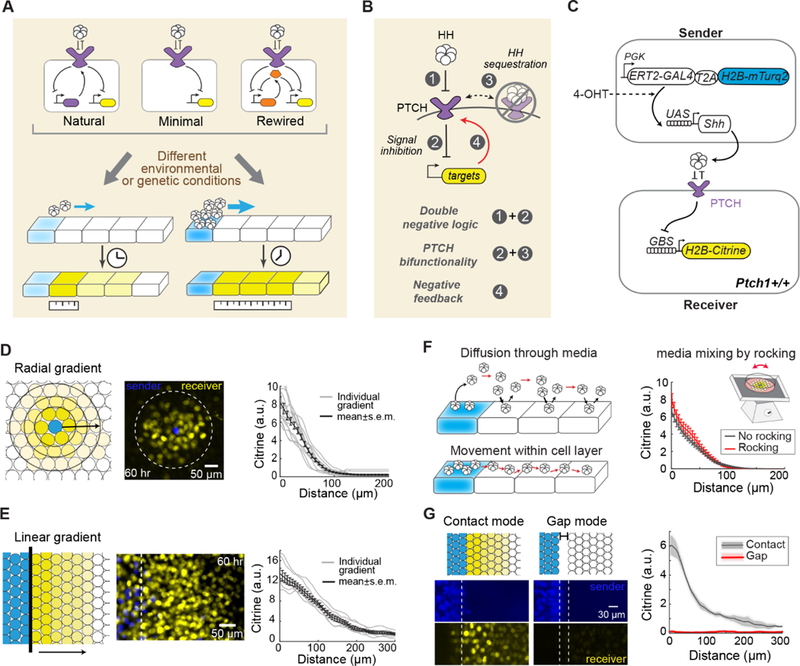
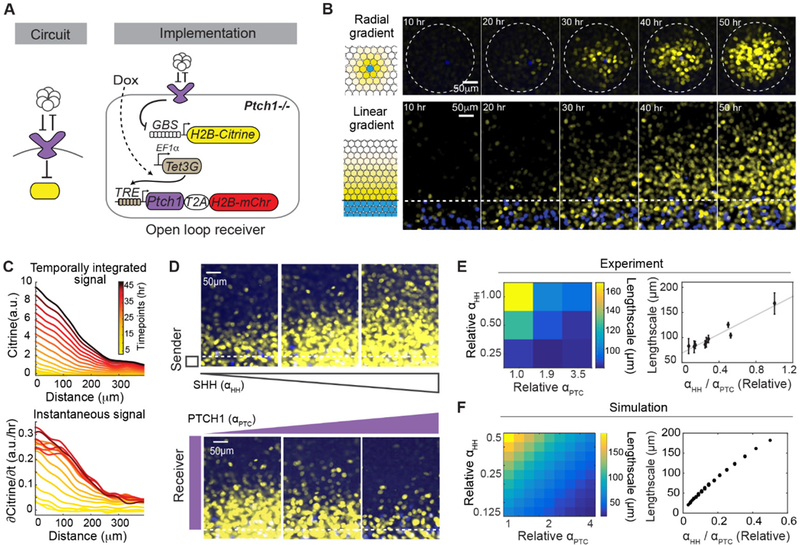
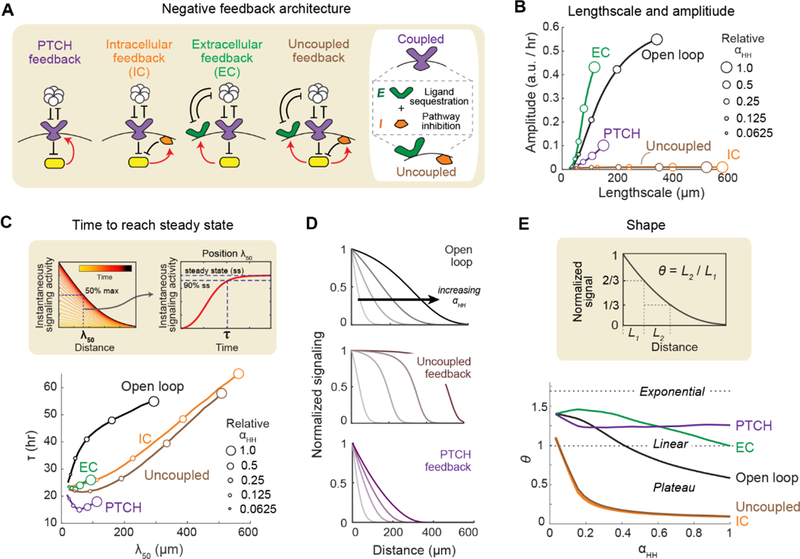
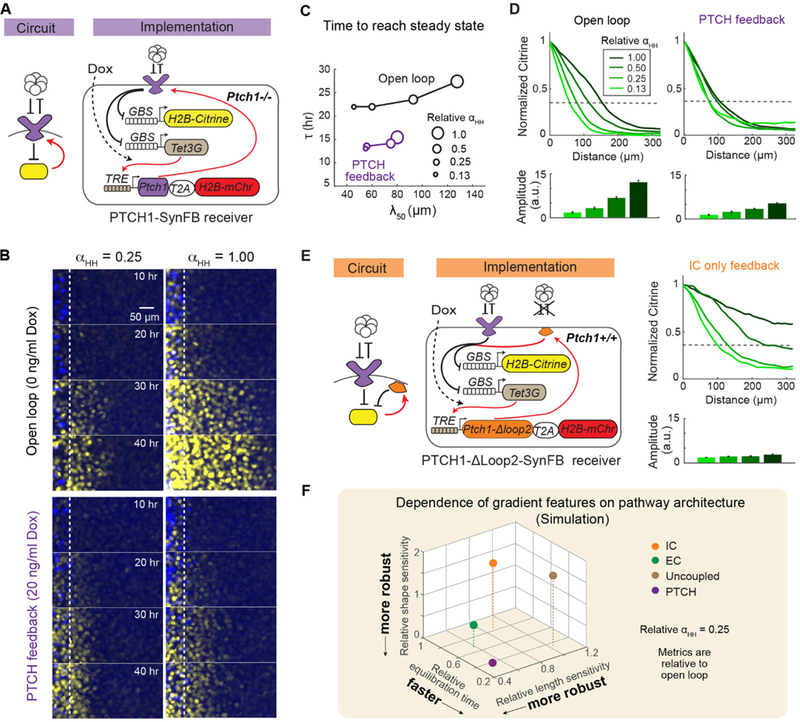
In developing tissues, cells estimate their spatial position by sensing graded concentrations of diffusible signaling proteins called morphogens. Morphogen-sensing pathways exhibit diverse molecular architectures, whose roles in controlling patterning dynamics and precision have been unclear. In this work, combining cell-based in vitro gradient reconstitution, genetic rewiring, and mathematical modeling, we systematically analyzed the distinctive architectural features of the Sonic Hedgehog pathway. We found that the combination of double-negative regulatory logic and negative feedback through the PTCH receptor accelerates gradient formation and improves robustness to variation in the morphogen production rate compared with alternative designs. The ability to isolate morphogen patterning from concurrent developmental processes and to compare the patterning behaviors of alternative, rewired pathway architectures offers a powerful way to understand and engineer multicellular patterning.


Figures

Fig. 1.
Fig. 1.. In vitro reconstitution of morphogen signaling gradients.
(A) Reconstitution enables quantitative analysis of the spatio-temporal patterning dynamics, including lengthscale (ruler) and speed (clock), generated by natural morphogen pathways, as well as minimal and re-wired variants. The sensitivity of circuit variants to perturbations, such as changes in ligand production, can also be determined. (B) Unique combination of architectural features in the Hedgehog (HH) pathway. (C) Sender and receiver cell lines for reconstituting SHH signaling gradient in wild-type NIH3T3 cells. Senders constitutively expressing GAL4 fused to a mutant estrogen receptor (ERT2) and mTurquoise2 (mTurq2) fused to Histone 2B (H2B) produce SHH upon induction with 4-hydroxytamoxifen (4-OHT). An 8xGLI binding sequence (GBS) driving H2B-Citrine expression reports pathway activity in receivers. (D and E) Reconstituting SHH signaling gradients in radial and linear geometries. Blue and yellow cells (schematic) represent senders and receivers, respectively. Arrows indicate the direction of gradient propagation. In the radial gradients (D, n = 13), all activation was due to a single sender cell (blue, near csenter of dashed circle that indicates the gradient outer edge). In the linear gradients (E, n = 7), the white dashed line indicates the boundary between sending and receiving fields. (F and G) Ligand transport requires continuous cell or extracellular matrix contact. In principle, ligand transport could involve bulk diffusion through the medium (upper schematic) or lateral movement within the cell layer (lower schematic). Gradient formation is unaffected by rocking that should disturb bulk diffusion (F, n = 8), and is blocked by a 30 μm gap between senders and receivers (G, n = 5).
Fig. 2.
Fig. 2.. Open loop SHH pathway architecture produces gradients sensitive to variations in key parameters.
(A) Engineering open loop receiver cells. Both Ptchl alleles in wild-type receivers were deleted and replaced by ectopic Ptchl under Tet-3G control, enabling graded tuning of PTCH1 abundance with Doxycycline (Dox), indicated by coexpression of mCherry (mChr). (B) Time-lapse images of representative radial and linear SHH signaling gradients. (C) Quantifying spatio-temporal dynamics of linear signaling gradients. Total fluorescence (upper plot) reflects the time-integrated pathway activity (mean of n = 8). The time derivative of Citrine (lower plot) approximates instantaneous pathway activity over space and time (fig. S1C). (D) Signaling gradient sensitivity to variations in SHH and PTCH1 production rates (αHH and αPTC, respectively). αHH was increased by varying the sender density (upper panel), whereas αPTC was increased in the receivers by varying the Dox concentration (lower panel). (E) The ratio of αHH and αPTC determines gradient lengthscale, defined by the distance at which the signal drops to 1/e of the amplitude. The αHHPTC ratio also controls gradient amplitude, defined by the signaling strength in the cells closest to the boundary (fig. S4D). (F) A simple model recapitulates the ratiometric dependence of gradient properties on αHH and αPTC (see also fig. S5E).
Fig. 3.
Fig. 3.. Mathematical modeling shows that PTCH feedback improves patterning performance by physically coupling intracellular and extracellular activities.
(A) Negative feedback can act intracellularly by inhibiting signaling (IC feedback) or extracellularly by sequestering ligand (EC feedback). These functionalities can coexist, implemented either through separate molecules (uncoupled feedback) or in a bifunctional molecule like PTCH (PTCH feedback). (B) Steady-state gradient length and amplitude as a function of αhh (marker size) for different models. The feedback strengths for the IC and EC models were finetuned so that the amplitude or lengthscale, respectively, matches that of PTCH feedback at relative αhh = 0.0625. Those same feedback strengths were used for the uncoupled model, but the qualitative differences between those models hold across all nonzero feedback strengths (figs. S7, C and D, and S9, A and B). Panels C-E use the same feedback strengths. (C) Time to reach steady state (τ) for each model as a function of αhh and λ50, the position at which steady-state signal activity equals 50% of the amplitude. τ is the first timepoint at which signal activity reaches 90% of its steady-state value at λ50 (schematic). (D) Amplitude-normalized signaling gradient profiles for open loop, uncoupled, and PTCH feedback models at different relative values αhh (0.0625, 0.25, 0.50, and 1.0) show distinct trends in lengthscale and shape. (E) PTCH feedback uniquely maintains a constant gradient shape with increasing αhh. The shape factor θ equals the ratio of the width of the second third of the gradient (L2) to the width of the first third of the gradient (L1) (schematic).
Fig. 4.
Fig. 4.. PTCH feedback simultaneously improves gradient speed and robustness.
(A) A synthetic PTCH1 feedback loop (red), whose strength is tunable with Dox, was introduced in Ptchl–/– receiver cells to generate the PTCH1-SynFB cell line. At 0 ng/ml Dox, the basal activity of the TRE promoter produces sufficient PTCH1 to suppress pathway activity in the absence of SHH. (B) Temporal evolution of PTCHl-SynFB signaling gradients (yellow) with (20 ng/ml Dox) or without (0 ng/ml Dox) PTCH1 feedback. Dotted white line represents the sender-receiver boundary. Note that sender cells (blue) remain throughout experiment but are visually obscured by increasing Citrine expression. (C) PTCH1-SynFB accelerates the approach to steady state at λ50 (defined in Fig. 3C). (D) Profile of PTCH1-SynFB signaling gradients, with (right, 20 ng/ml Dox) or without (left, 0 ng/ml Dox) PTCH1 feedback, at 42.5 hours after 100 nM 4-OHT induction. Gradient profiles are normalized to their own amplitudes to show differences in lengthscale (distance at which the dotted line is crossed) and shape. Bar plots show amplitudes (mean ± s.e.m., n = 7 each). (E) A SynFB circuit was introduced in wild-type receiver cells to generate the PTCH1-ALoop2-SynFB cell line (left). PTCH1-ΔLoop2 lacks the HH binding domain, but has the same capability as PTCH to suppress intracellular signaling (fig. S14). This IC feedback circuit enables robust gradient amplitude at the cost of greatly flattened shape and exacerbated lengthscale sensitivity to αhh (right). (F) Summary of the performance of different feedback architectures (simulation results). The unique, conserved architectural features of the HH pathway combine to enhance speed and robustness of signaling gradient formation. Performance is measured relative to that of the open loop model at relative αhh = 0.25, which has a value of 1 in each dimension (see fig. S9C for plots at other αhh values).

Comment in

References

    1. Rogers KW, Schier AF, Morphogen gradients: From generation to interpretation. Annu. Rev. Cell Dev. Biol. 27, 377–407 (2011). doi:10.1146/annurev-cellbio-092910-154148 Medine - DOI - PubMed
    1. Perrimon N, McMahon AP, Negative feedback mechanisms and their roles during pattern formation. Cell 97, 13–16 (1999). doi:10.1016/S0092-8674(00)80710-2 - DOI - PubMed
    1. Freeman M, Feedback control of intercellular signalling in development. Nature 408, 313–319 (2000). doi:10.1038/35042500 - DOI - PubMed
    1. Briscoe J, Thérond PP, The mechanisms of Hedgehog signalling and its roles in development and disease. Nat. Rev. Mol. Cell Biol. 14, 416–429 (2013). doi:10.1038/nrm3598 - DOI - PubMed
    1. Chen Y, Struhl G, Dual roles for patched in sequestering and transducing Hedgehog. Cell 87, 553–563 (1996). doi:1Q.1Q16/S0092-8674(00)81374-4 - PubMed

Publication types