Rio's Mountainous Region ("Região Serrana") 2011 Landslides: Impact on Public Mental Health System
- PMID: 29623240
- PMCID: PMC5858743
- DOI: 10.1371/currents.dis.156b98022b9421098142a4b31879d866
Rio's Mountainous Region ("Região Serrana") 2011 Landslides: Impact on Public Mental Health System
Abstract
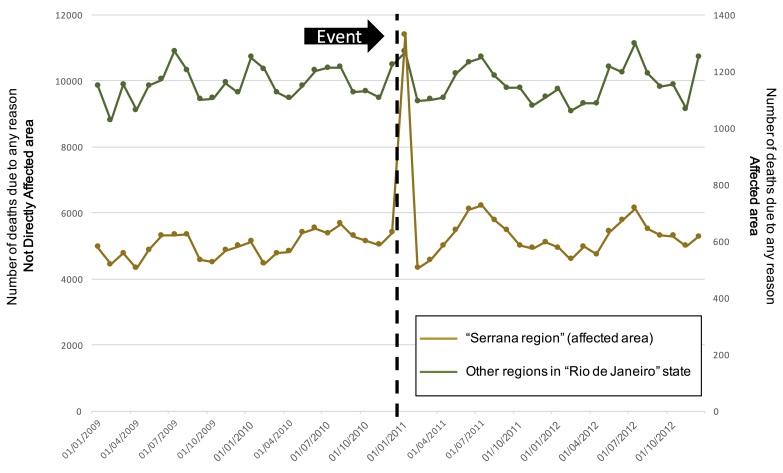
INTRODUCTION In January 2011 landslides and floods followed heavy rain in the Mountainous Region of Rio de Janeiro State ("Região Serrana"), in southeastern Brazil. These events led to the largest disaster registered in Brazilian recent history. Few studies addressed the impacts of this disaster on public health, and we found none addressing the impact on mental health. This study reviewed the consequences of the 2011 disaster in the "Região Serrana", by comparing the demand for public mental health assistance data from time periods before and after the even METHODS We performed an ecologic study, analysing the aggregate data from "Região Serrana" during the period two years before and after the disaster, exporting data from the Brazilian open access public health database. The primary outcome was defined as Mental Health Care Demand, and for that we calculated the number of mental health care visits per month, the proportion of visits due to mental health care and the monthly absolute number of mental health care visits per CAPS - "Centro de Atenção Psicossocial" (Psychosocial Care Centre). For secondary outcomes we evaluated the total number of deaths by any reason, and the total number of hospitalizations. The other health administrative regions of Rio de Janeiro state were used as control group. RESULTS We observed that there was an important increase in the rate of visits due to mental health in the six months after the landslides, from 13,875 to 17,690, reaching its maximum one year after the event totalizing 21,980 visits (Dec 2011). It was also observed that the proportion of visits due to mental health disorders increased after the event in the "Região Serrana", as well as the number of mental health care visits per CAPS. DISCUSSION In conclusion, we observed that the 2011 Landslides in "Região Serrana" led to a sustained higher burden to public mental health care. There was an increase in the demand for mental health visits, and the ratio of visits per CAPS was higher during most part of the studied period after the event, even with the region having more CAPS than before.
Figures


References
-
- Pereira BM, Morales W, Cardoso RG, Fiorelli R, Fraga GP, Briggs SM. Lessons learned from a landslide catastrophe in Rio de Janeiro, Brazil. Am J Disaster Med. 2013 Autumn;8(4):253-8. PubMed PMID:24481889. - PubMed
-
- Freitas, C. et al. Vulnerabilidade socioambiental, redução de riscos de desastres e construção da resiliência: lições do terremoto no Haiti e das chuvas fortes na “Região Serrana”, Brasil. Ciênc. saúde coletiva, v. 17, n. 6, p. 1577-1586, 2012. - PubMed
-
- Francisco Dourado; Thiago Coutinho Arraes & Mariana Fernandes e Silva. The “Megadesastre” in the Mountain Region of Rio de Janeiro State - Causes, Mechanisms of Mass Movements and Spatial Allocation of Investments for Reconstruction Post Disaster. Anuário do Instituto de Geociências - UFRJ 2012.
-
- Atlas do Desenvolvimento Humano no Brasil (Human Development) - United Nations Development Programme Institute for Applied Economic Research João Pinheiro Foundation
-
- IBGE - Instituto Brasileiro de Geografia e Estatística (Brazilian Institute of Geography and Statistics - free translation)
LinkOut - more resources
Full Text Sources
Other Literature Sources
Research Materials
Miscellaneous