. 2018 Jul;160(7):1325-1336.
doi: 10.1007/s00701-018-3525-9. Epub 2018 Apr 5.

Visual field deficits after epilepsy surgery: a new quantitative scoring method

Affiliations

Visual field deficits after epilepsy surgery: a new quantitative scoring method

Rick H G J van Lanen et al. Acta Neurochir (Wien). 2018 Jul.

Abstract

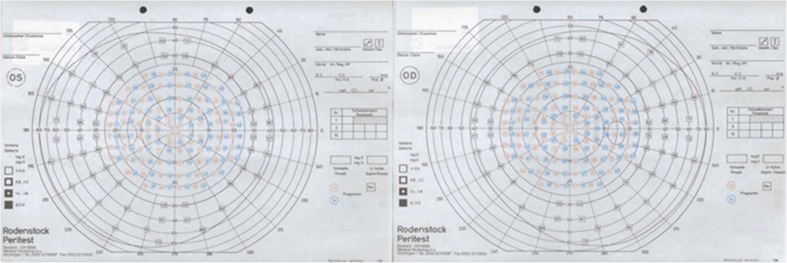
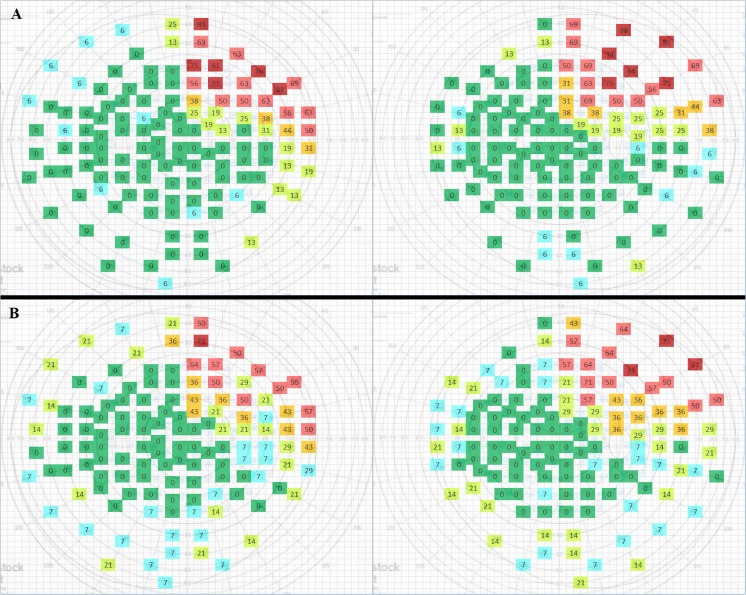
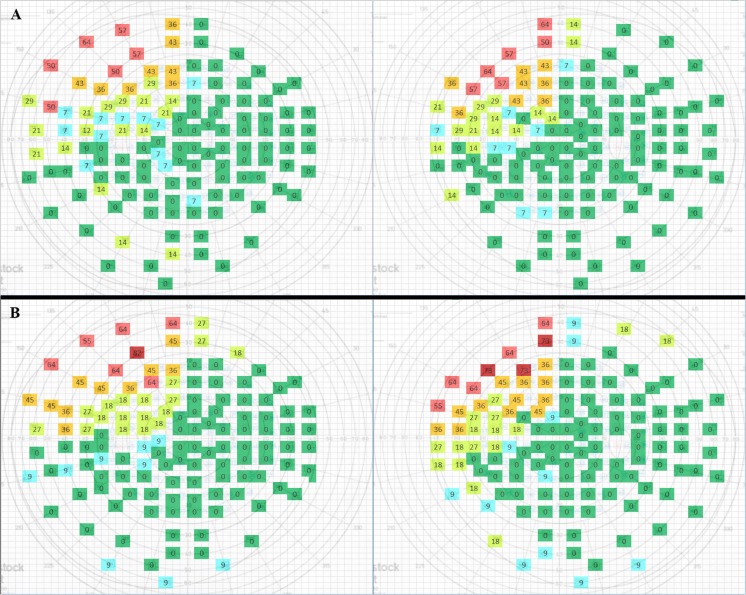
Background: Anterior temporal lobectomy (ATL) as a treatment for drug-resistant temporal lobe epilepsy (TLE) frequently causes visual field deficits (VFDs). Reported VFD encompasses homonymous contralateral upper quadrantanopia. Its reported incidence ranges from 15 to 90%. To date, a quantitative method to evaluate postoperative VFD in static perimetry is not available. A method to quantify postoperative VFD, which allows for comparison between groups of patients, was developed.

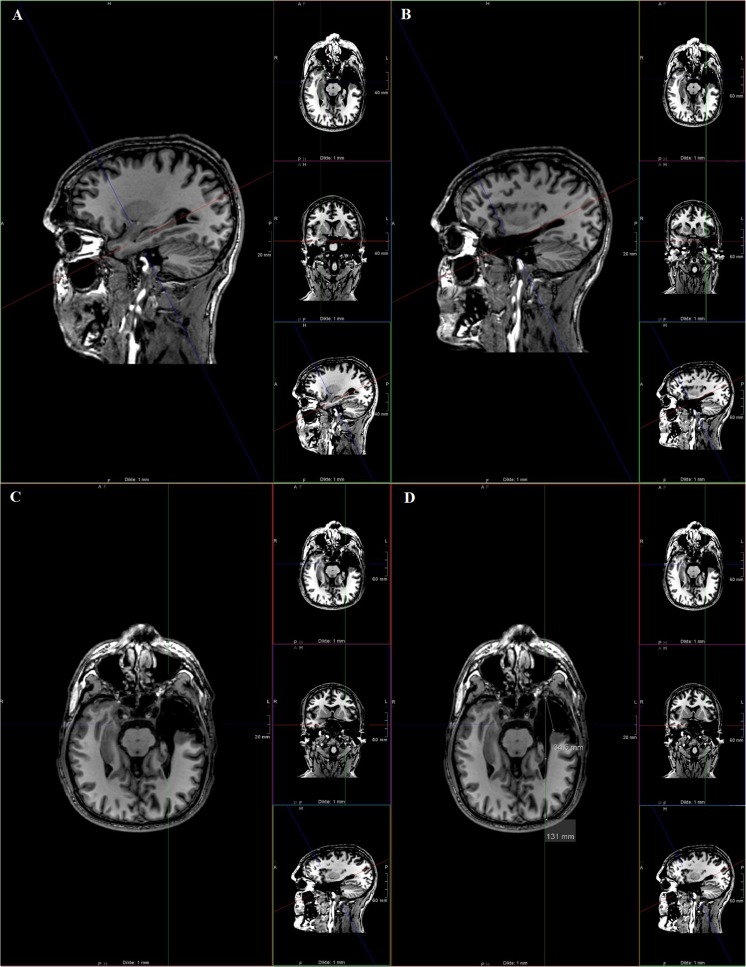
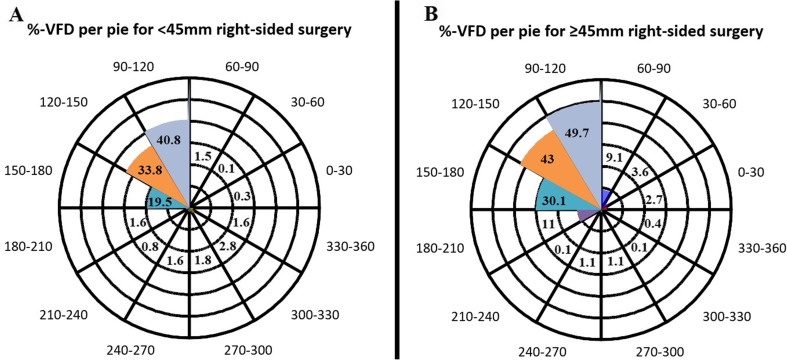
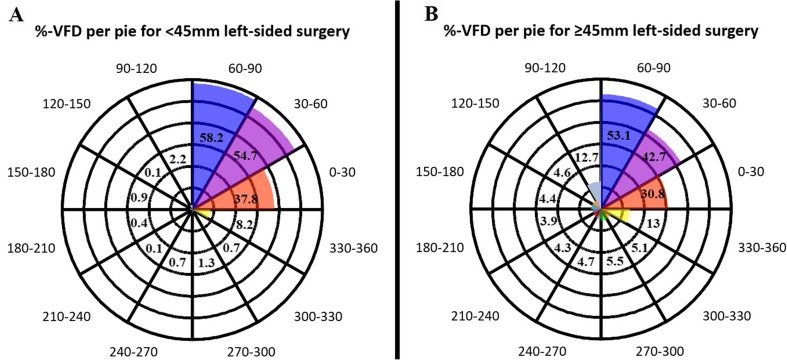
Methods: Fifty-five patients with drug-resistant TLE, who underwent ATL with pre- and postoperative perimetry, were included. Temporal lobe resection length was measured on postoperative MRI. Percentage VFD was calculated for the total visual field, contralateral upper quadrant, or other three quadrants combined.

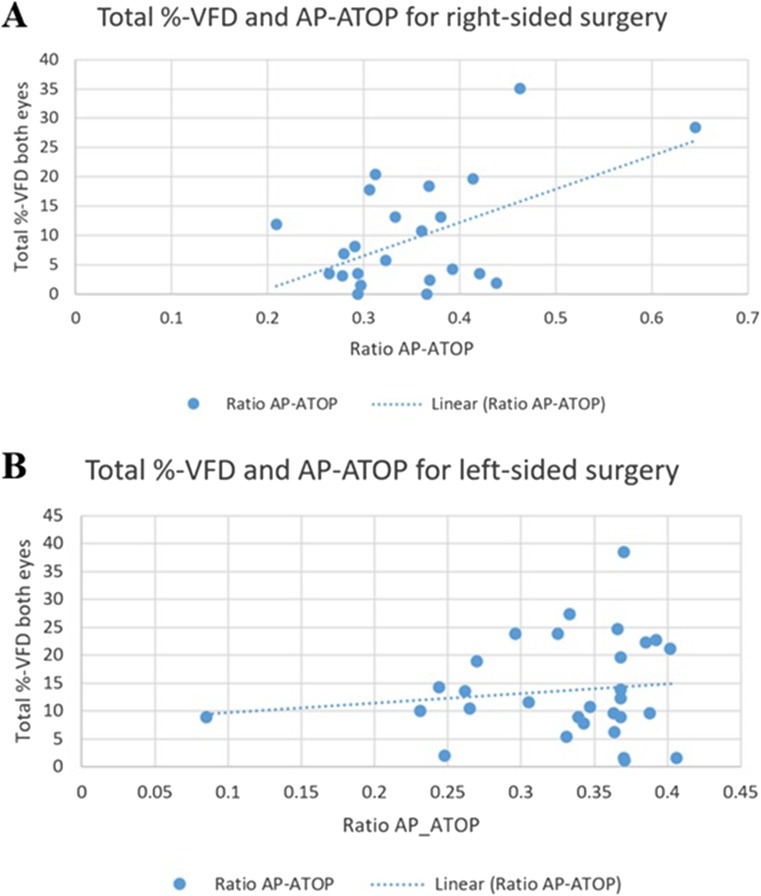
Results: Patients were divided into groups by resection size (< 45 and ≥ 45 mm) and side of surgery (right and left). We found significant higher VFD in the ≥ 45 vs. < 45 mm group (2.3 ± 4.4 vs. 0.7 ± 2.4%,p = 0.04) for right-sided ATL. Comparing VFD in both eyes, we found more VFD in the right vs. left eye following left-sided ATL (14.5 ± 9.8 vs. 12.9 ± 8.3%, p = 0.03). We also demonstrated significantly more VFD in the < 45 mm group for left- vs. right-sided surgery (6.7 ± 6.7 vs. 13.1 ± 7.0%, p = 0.016). A significant quantitative correlation between VFD and resection size for right-sided ATL was shown (r = 0.52, p < 0.01).

Conclusions: We developed a new quantitative scoring method for the assessment of postoperative visual field deficits after temporal lobe epilepsy surgery and assessed its feasibility for clinical use. A significant correlation between VFD and resection size for right-sided ATL was confirmed.

Keywords: Epilepsy; Perimetry; Quadrantanopia; Temporal lobectomy; Visual field deficits.


Conflict of interest statement

Conflict of interest

The authors declare that they have no conflict of interest.

Ethical approval

All procedures performed in studies involving human participants were in accordance with the ethical standards of the institutional and/or national research committee and with the 1964 Helsinki declaration and its later amendments or comparable ethical standards.

Informed consent

Informed consent was obtained from all individual participants included in the study.

Figures

Fig. 1
Fig. 1
To measure the extent of resection, we reconstructed the 3D T1 scan in a plane parallel to the hippocampus at the non-resected side, as shown in a. Next, we returned to the resected side within the same plane (b) and switched back to the axial view (c). Finally, the anterior-posterior (AP) length of resection was estimated by measuring the distance from the anterior tip of the middle sphenoid fossa (which had contained the resected temporal pole) to the posterior margin of the resection cavity in axial view. To compensate for variations in head size and possible metrical distortion introduced by MRI, the extent of resection was expressed as a fraction of the distance between the anterior tip of the middle sphenoid fossa to the occipital pole (anterior temporal-occipital pole, or ATOP distance), shown in d
Fig. 2
Fig. 2
Blank Rodenstock peritest (Medical Workshop b.v., Netherlands) for the left (OS) and right (OD) eye. This static perimetry method tests a set amount of points across the visual field, where the position of the tested points is the same with every test. A grey square is printed over the tested point when the patients show VFD in the corresponding point. The Rodenstock perimetry test takes into the account the importance of central vision over peripheral vision by assessing more points in the central area of vision, especially within the central 30°
Fig. 3
Fig. 3
a For < 45 mm left-sided surgery. b For ≥ 45 mm left-sided surgery. VFD within the right upper quadrant is comparable. A higher amount of VFD is notable in the other three quadrants in the ≥ 45 mm group. Colours have been given to the coordinates to allow for easier visual recognition: green = no patients with visual loss at the corresponding coordinate (0%); blue = sporadic field loss (1–9% of patients); yellow = some visual field loss (10–29% of patients); orange = moderate visual field loss (30–49% of patients); light red = moderate-severe visual field loss (50–69% of patients); dark red = severe visual field loss (≥ 70% of patients)
Fig. 4
Fig. 4
a For < 45 mm right-sided surgery. b For ≥ 45 mm right-sided surgery. VFD within the left upper quadrant is comparable. A higher amount of VFD is notable in the other three quadrants in the ≥ 45 mm group, especially in the areas bordering the left upper quadrant. Colours have been given to the coordinates to allow for easier visual recognition: green = no patients with visual loss at the corresponding coordinate (0%); blue = sporadic field loss (1–9% of patients); yellow = some visual field loss (10–29% of patients); orange = moderate visual field loss (30–49% of patients); light red = moderate-severe visual field loss (50–69% of patients); dark red = severe visual field loss (≥ 70% of patients)
Fig. 5
Fig. 5
Percentage VFD per pie for right-sided surgery. a For the < 45 mm group. b for the ≥ 45 mm group. Each concentric layer represents 10% average VFD for the < 45 or ≥ 45 mm groups. The number in each pie represents the average percentage VFD in the corresponding pie. The medial pie, running from 90° to 120°, shows the largest visual defect followed by the pie from 120° to 150° and the pie running from 150° to 180°. Also, an increase in VFD in the ≥ 45 mm group is noted in the pies adjacent to the contralateral upper quadrant (60–90° and 180–210° pies)
Fig. 6
Fig. 6
Percentage VFD per pie for left-sided surgery. a For the < 45 mm group. b For the ≥ 45 mm group. Each concentric layer represents 10% average VFD for the < 45 or ≥ 45 mm groups. The number in each pie represents the average percentage VFD in the corresponding pie. Most VFD was found in the upper contralateral medial pie running from 60° to 90°, followed by the 30–60° and 0–30° pies. Also, an increase in VFD in the ≥ 45 mm group is noted in the pies adjacent to the contralateral upper quadrant (90–120° and 330–360° pies)
Fig. 7
Fig. 7
Linear regression modelling between total percentage VFD for both eyes combined and AP-ATOP ratio. a A statistically significant correlation was demonstrated for right-sided surgery. Two outliers were noted (ratio AP-ATOP 0.463, VFD 35%; ratio 0.645, VFD 28%), excluding any of these outliers we again noted a significant linear correlation. b Linear regression modelling between total percentages VFD for both eyes combined and AP-ATOP ratio for left-sided surgery showed no statistically significant correlation

References

    1. Barton J, Hefter R, Chang B, Schomer D, Drislane F. The field defects of anterior temporal lobectomy: a quantitative reassessment of Meyer's loop. Brain. 2005;128(9):2123–2133. doi: 10.1093/brain/awh544. - DOI - PubMed
    1. Bjellvi J, Flink R, Rydanhag B, Malmgren K. Complications of epilepsy surgery in Sweden 1996–2010: a prospective, population-based study. J Neurosurg. 2015;3(122):519–525. doi: 10.3171/2014.9.JNS132679. - DOI - PubMed
    1. CBR, "Centraal Bureau Rijvaardigheidsbewijzen," CBR 2017. [Online]. Available: https://www.cbr.nl/oogaandoening.pp. [Accessed 30 May 2017]
    1. Cheng H, Guo C, Chen M, Ko Y, Huang N, Jui-ling LC. Glaucoma, patient-reported vision-related quality of life differences between superior and inferior hemifield visual field defects in primary open-angle. JAMA Ophtalmol. 2015;3(133):269–275. doi: 10.1001/jamaophthalmol.2014.4908. - DOI - PubMed
    1. Cohen-Gadol A, Wilhelmi B, Collignon F. Long-term outcome of epilepsy surgery among 399 patients with nonlesional seizure foci including mesial temporal lobe sclerosis. J Neurosurg. 2006;104:513–524. doi: 10.3171/jns.2006.104.4.513. - DOI - PubMed

LinkOut - more resources