. 2018 May 1;197(9):1198-1208.
doi: 10.1164/rccm.201711-2340OC.

Four-Gene Pan-African Blood Signature Predicts Progression to Tuberculosis

Collaborators, Affiliations

Four-Gene Pan-African Blood Signature Predicts Progression to Tuberculosis

Sara Suliman et al. Am J Respir Crit Care Med. .

Abstract

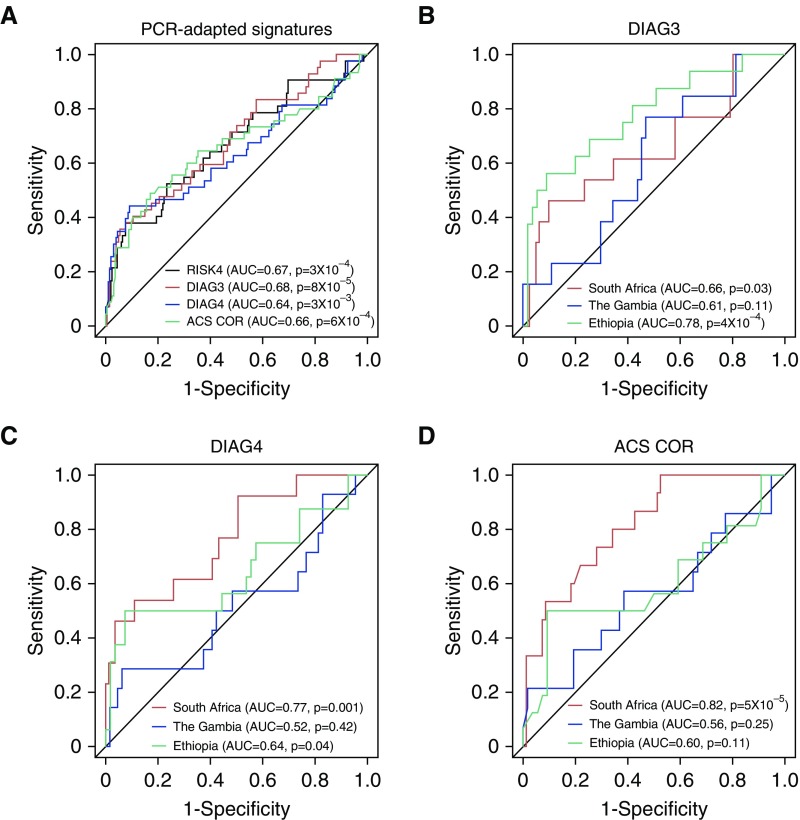
Rationale: Contacts of patients with tuberculosis (TB) constitute an important target population for preventive measures because they are at high risk of infection with Mycobacterium tuberculosis and progression to disease.Objectives: We investigated biosignatures with predictive ability for incident TB.Methods: In a case-control study nested within the Grand Challenges 6-74 longitudinal HIV-negative African cohort of exposed household contacts, we employed RNA sequencing, PCR, and the pair ratio algorithm in a training/test set approach. Overall, 79 progressors who developed TB between 3 and 24 months after diagnosis of index case and 328 matched nonprogressors who remained healthy during 24 months of follow-up were investigated.Measurements and Main Results: A four-transcript signature derived from samples in a South African and Gambian training set predicted progression up to two years before onset of disease in blinded test set samples from South Africa, the Gambia, and Ethiopia with little population-associated variability, and it was also validated in an external cohort of South African adolescents with latent M. tuberculosis infection. By contrast, published diagnostic or prognostic TB signatures were predicted in samples from some but not all three countries, indicating site-specific variability. Post hoc meta-analysis identified a single gene pair, C1QC/TRAV27 (complement C1q C-chain / T-cell receptor-α variable gene 27) that would consistently predict TB progression in household contacts from multiple African sites but not in infected adolescents without known recent exposure events.Conclusions: Collectively, we developed a simple whole blood-based PCR test to predict TB in recently exposed household contacts from diverse African populations. This test has potential for implementation in national TB contact investigation programs.

Keywords: biomarkers; gene expression; tuberculosis.


Figures

Figure 1.
Figure 1.
Consolidated Standards of Reporting Trials diagram describing the inclusion and exclusion of participants from the different African cohorts in the Grand Challenges 6-74 (GC6-74, GC6) household contact (HHC) study for training predictive transcriptomic biomarker for tuberculosis (TB) progression: Stellenbosch University in South Africa (SUN), Armauer Hansen Research Institute in Ethiopia (AHRI), Makerere University in Uganda (MAK), Medical Research Council in the Gambia (MRC), and the external validation natural history study of South African adolescents (Adolescent Cohort Study [ACS]). “QC Excluded” refers to samples excluded because they did not meet the minimum quality control requirement for RNA sequencing of an RNA yield greater than or equal to 200 ng and an RNA integrity number greater than or equal to 7. RISK4 = four-gene correlate-of-risk signature.
Figure 2.
Figure 2.
Site-specific feature selection and translation to RT-PCR. (A) Receiver operating characteristic curve for leave-one-out cross-validation (LOOCV) of South Africa (blue; area under the receiver operating characteristic curve [AUC], 0.86 [95% confidence interval (CI), 0.79–0.94]; P = 8.4 × 10−10) versus the Gambia–trained prospective signature (red; AUC, 0.59 [95% CI, 0.46–0.73]; P  =  0.06) in the South African training set (samples listed in Tables E11A and E11B). (B) Receiver operating characteristic curves for LOOCV of the Gambia (blue; AUC, 0.77 [95% CI, 0.66–0.88]; P = 2.5 × 10−5) versus South Africa prospective signature (red; AUC, 0.66 [95% CI, 0.54–0.77]; P = 8.8 × 10−3) in the Gambia training set containing 26 progressor and 76 nonprogressor samples. (C and D) Heat maps showing the expression of each splice junction in (C) the South Africa and (D) the Gambia signatures in nonprogressors (left columns), progressors 1–2 years before diagnosis (middle columns), and progressors 0–1 year before diagnosis (right columns). For each group of samples, the central column is the mean fold expression change versus nonprogressors, whereas left/right columns in each group correspond to mean ± SEM. Each row corresponds to a splice junction, and genes with multiple rows are represented by multiple splice junctions in the signature.
Figure 3.
Figure 3.
Validation of a multicohort four-gene signature (RISK4) derived from the South African and Gambian training sets. (A) Expression ratio of gene pairs in the RISK4 signature in the South African (top) and Gambian (bottom) training sets: nonprogressors (left columns), progressors 1–2 years before diagnosis (middle columns), and progressors 0–1 (right columns) year before diagnosis. In each group, the central column is the mean fold expression over nonprogressors, whereas left/right columns in each group correspond to mean ± SEM. (B) Receiver operating characteristic (ROC) curves for blind predictions of RISK4 on test set samples of all sites (black; area under the receiver operating characteristic curve [AUC], 0.67 [95% confidence interval (CI), 0.57–0.77]; P = 2.6 × 10−4), South Africa (red; AUC, 0.72 [95% CI, 0.53–0.92]; P = 6.3 × 10−3), the Gambia (blue; AUC, 0.72 [95% CI, 0.55–0.88]; P = 5.4 × 10−3), and Ethiopia (green; AUC, 0.67 [95% CI, 0.5–0.83]; P = 0.02). (C) Performance of RISK4 signature in test set samples obtained within 1 year of diagnosis (red; AUC, 0.66 [95% CI, 0.55–0.78], P = 2 × 10−3; 30 progressor samples, 201 nonprogressor samples) or 1–2 years before diagnosis (blue; AUC, 0.69 [95% CI, 0.51–0.86]; P = 0.02; 12 progressor samples, 201 nonprogressor samples). (D) ROC curve of RISK4 on all baseline test set samples (AUC, 0.69 [95% CI, 0.52–0.86]; P = 5 × 10−3). (E) ROC curve blind prediction of RISK4 in South African adolescents with latent Mycobacterium tuberculosis (M.tb) infection (AUC, 0.69 [95% CI, 0.62–0.76]; P = 3.4 × 10−7). BLK = B lymphocyte kinase; CD1C = cluster of differentiation 1C; GAS6 = growth arrest–specific 6; SEPT4 = septin 4; TB = tuberculosis.
Figure 4.
Figure 4.
Comparison of PCR-adapted signatures: RISK4, ACS 16-gene correlate of risk (ACS COR), and tuberculosis diagnostic signatures (DIAG3 and DIAG4). (A) Receiver operating characteristic curves for blind predictions of RISK4 (black; area under the receiver operating characteristic curve [AUC], 0.67 [95% confidence interval (CI), 0.57–0.77]; P = 3 × 10−4), DIAG3 (red; AUC, 0.68 [95% CI, 0.59–0.78]; P = 8 × 10−5), DIAG4 (blue; AUC, 0.64 [95% CI, 0.53–0.74]; P = 3 × 10−3), and ACS COR (green; AUC, 0.66 [95% CI, 0.55–0.76]; P = 6 × 10−4) in all test set samples. (BD) Blind prediction of PCR-adapted signatures: (B) DIAG3 (South Africa AUC, 0.66 [95% CI, 0.47–0.84]; the Gambia AUC, 0.61 [95% CI, 0.45–0.77]; and Ethiopia AUC, 0.78 [95% CI, 0.64–0.92]), (C) DIAG4 (South Africa AUC, 0.77 [95% CI, 0.62–0.91]; the Gambia AUC, 0.52 [95% CI, 0.33–0.71]; and Ethiopia AUC, 0.64 [95% CI, 0.46–0.83]), and (D) ACS COR (South Africa AUC, 0.82 [95% CI, 0.71–0.92]; the Gambia AUC, 0.56 [95% CI, 0.37–0.75]; and Ethiopia AUC, 0.6 [95% CI, 0.41–0.79]). South Africa, the Gambia, and Ethiopia AUCs are depicted in red, blue, and green, respectively. ACS = Adolescent Study Cohort; RISK4 = four-gene correlate-of-risk signature.
Figure 5.
Figure 5.
Gene pairs to predict tuberculosis progression in African cohorts. Ratios of C1QC/TRAV27 and ANKRD22/OBSPL10 plotted on samples from (A) South Africa, (B) the Gambia, and (C) Ethiopia, together with an optimal discriminant (dashed line; optimizes sum of sensitivity and specificity) separating progressors (orange) from nonprogressors (blue). In each cohort, the two pairs provide complementary information. P values correspond to chi-square complementation analysis in Table E16. (D) Receiver operating characteristic curves showing the ability of the Grand Challenges 6-74 (GC6)-trained C1QC/TRAV27 (solid line; area under the receiver operating characteristic curve [AUC], 0.57 [95% confidence interval (CI), 0.49–0.64]; P = 0.042), ANKRD22/OBSPL10 (dashed line; AUC, 0.75 [95% CI, 0.68–0.81]; P = 2.86 × 10−11), and a linear combination of C1QC/TRAV27 and ANKRD22/OBSPL10 (dotted line; AUC, 0.69 [95% CI, 0.61–0.76]; P = 4.3 × 10−7) models to predict tuberculosis disease progression in the South African Adolescent Cohort Study (ACS) cohort. (E) Receiver operating characteristic curves showing the ability of the GC6-trained C1QC/TRAV27 (solid line; AUC, 0.77 [95% CI, 0.71–0.83]; P = 4.5 × 10−16), ANKRD22/OBSPL10 (dashed line; AUC, 0.76 [95% CI, 0.7–0.82]; P = 3.7 × 10−15), and a linear combination of C1QC/TRAV27 and ANKRD22/OBSPL10 (dotted line; AUC, 0.79 [95% CI, 0.74–0.85]; P = 6.1 × 10−19) models to predict TB disease progression in the GC6 household contact (HHC) cohort. (F and G) Logarithmic ratios of expression (mean ± 95% CI) for (F) ANKRD22/OBSPL10 and (G) C1QC/TRAV27 are plotted as a function of time to diagnosis for both GC6-74 (blue) and ACS (red) progressor samples. Comparison of C1QC/TRAV27 expression at 19–24 months before diagnosis between the GC6-74 HHC and ACS cohorts was statistically significantly different (P = 3 × 10−3) using the Mann-Whitney U test. ANKRD22 = ankyrin repeat domain 22; C1QC = complement C1q C-chain; OBSPL10 = oxysterol binding protein like 10; TB = tuberculosis; TRAV27 = T-cell receptor-α variable gene 27.

Comment in

References

    1. Riley F. Tuberculosis in hospital nurses; five years figures. Mon Bull Minist Health Public Health Lab Serv. 1959;18:38–45. - PubMed
    1. Yates TA, Khan PY, Knight GM, Taylor JG, McHugh TD, Lipman M, et al. The transmission of Mycobacterium tuberculosis in high burden settings. Lancet Infect Dis. 2016;16:227–238. - PubMed
    1. World Health Organization (WHO) Global tuberculosis report 2017. [accessed 2018 Jan 26]. Available from: http://www.who.int/tb/publications/global_report/gtbr2017_main_text.pdf?....
    1. Rieder H. Annual risk of infection with Mycobacterium tuberculosis. Eur Respir J. 2005;25:181–185. - PubMed
    1. O’Garra A, Redford PS, McNab FW, Bloom CI, Wilkinson RJ, Berry MP. The immune response in tuberculosis. Annu Rev Immunol. 2013;31:475–527. - PubMed