

Identification of Misclassified ClinVar Variants via Disease Population Prevalence
- PMID: 29625023
- PMCID: PMC5985337
- DOI: 10.1016/j.ajhg.2018.02.019
Identification of Misclassified ClinVar Variants via Disease Population Prevalence
Abstract
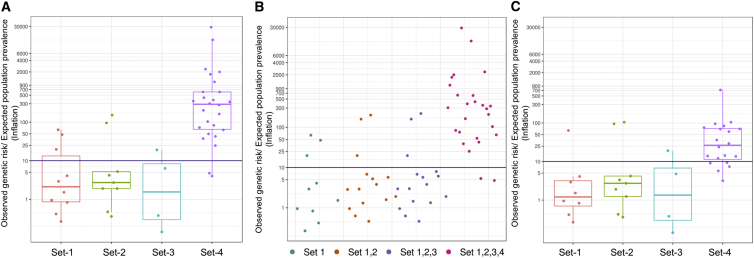
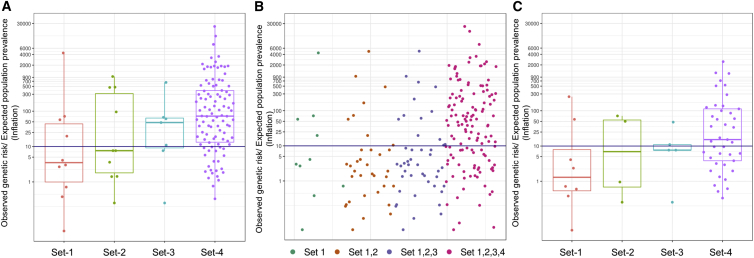
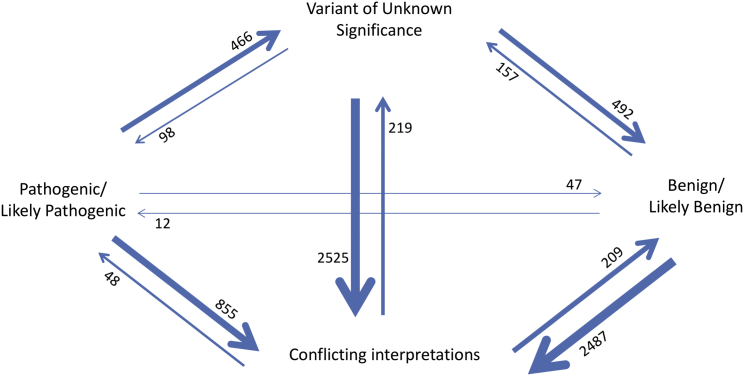
There is a significant interest in the standardized classification of human genetic variants. We used whole-genome sequence data from 10,495 unrelated individuals to contrast population frequency of pathogenic variants to the expected population prevalence of the disease. Analyses included the ACMG-recommended 59 gene-condition sets for incidental findings and 463 genes associated with 265 OrphaNet conditions. A total of 25,505 variants were used to identify patterns of inflation (i.e., excess genetic risk and misclassification). Inflation increases as the level of evidence supporting the pathogenic nature of the variant decreases. We observed up to 11.5% of genetic disorders with inflation in pathogenic variant sets and up to 92.3% for the variant set with conflicting interpretations. This improved to 7.7% and 57.7%, respectively, after filtering for disease-specific allele frequency. The patterns of inflation were replicated using public data from more than 138,000 genomes. The burden of rare variants was a main contributing factor of the observed inflation, indicating collective misclassified rare variants. We also analyzed the dynamics of re-classification of variant pathogenicity in ClinVar over time, which indicates progressive improvement in variant classification. The study shows that databases include a significant proportion of wrongly ascertained variants; however, it underscores the critical role of ClinVar to contrast claims and foster validation across submitters.
Keywords: ACMG; ClinVar; OrphaNet; pathogenic variant; penetrance; prevalence.
Copyright © 2018 American Society of Human Genetics. Published by Elsevier Inc. All rights reserved.
Figures
Comment in
-
Inflated pathogenic variant profiles in the ClinVar database.Nat Rev Endocrinol. 2018 Jul;14(7):387-389. doi: 10.1038/s41574-018-0034-0. Nat Rev Endocrinol. 2018. PMID: 29858586 No abstract available.
-
Disease-causing or benign? challenges in genetic variant interpretation and limitations of ClinVar.Mov Disord. 2018 Aug;33(8):1271. doi: 10.1002/mds.94. Mov Disord. 2018. PMID: 30230623 No abstract available.
-
Response to Whiffin et al.Am J Hum Genet. 2019 Jan 3;104(1):186. doi: 10.1016/j.ajhg.2018.11.011. Am J Hum Genet. 2019. PMID: 30609405 Free PMC article. No abstract available.
-
Using High-Resolution Variant Frequencies Empowers Clinical Genome Interpretation and Enables Investigation of Genetic Architecture.Am J Hum Genet. 2019 Jan 3;104(1):187-190. doi: 10.1016/j.ajhg.2018.11.012. Am J Hum Genet. 2019. PMID: 30609406 Free PMC article. No abstract available.
References
-
- Amendola L.M., Jarvik G.P., Leo M.C., McLaughlin H.M., Akkari Y., Amaral M.D., Berg J.S., Biswas S., Bowling K.M., Conlin L.K. Performance of ACMG-AMP variant-interpretation guidelines among nine laboratories in the clinical sequencing exploratory research Consortium. Am. J. Hum. Genet. 2016;98:1067–1076. - PMC - PubMed
-
- Richards S., Aziz N., Bale S., Bick D., Das S., Gastier-Foster J., Grody W.W., Hegde M., Lyon E., Spector E., ACMG Laboratory Quality Assurance Committee Standards and guidelines for the interpretation of sequence variants: a joint consensus recommendation of the American College of Medical Genetics and Genomics and the Association for Molecular Pathology. Genet. Med. 2015;17:405–424. - PMC - PubMed
MeSH terms
LinkOut - more resources
Full Text Sources
Other Literature Sources
