
Cell-of-Origin Patterns Dominate the Molecular Classification of 10,000 Tumors from 33 Types of Cancer

Katherine A Hoadley et al. Cell. .

Abstract

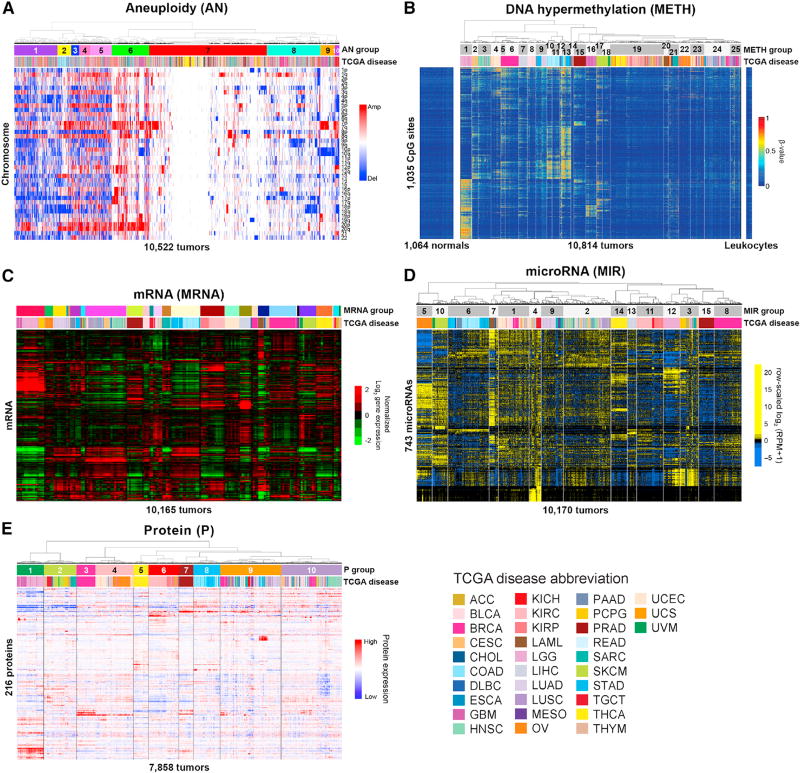
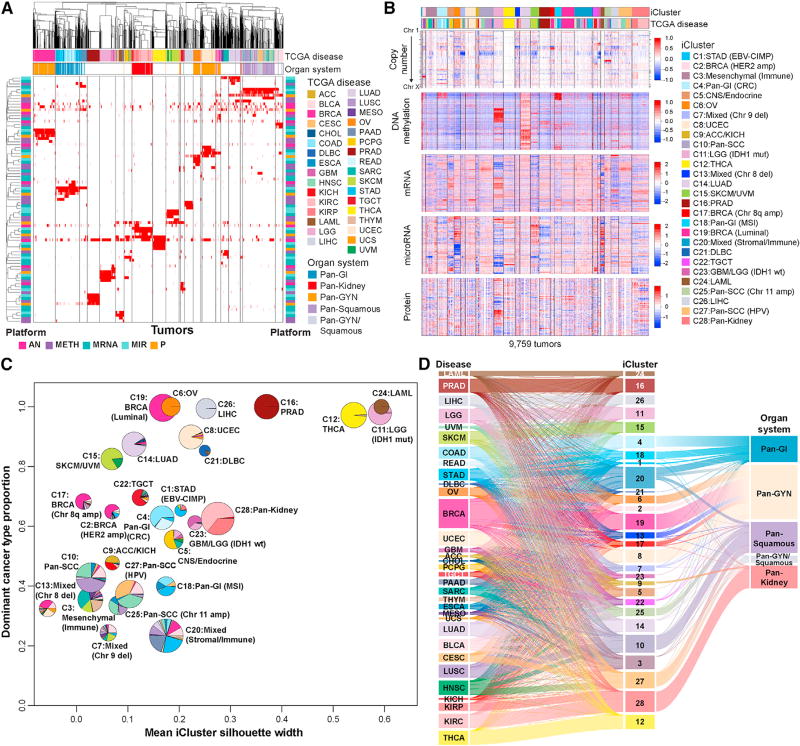
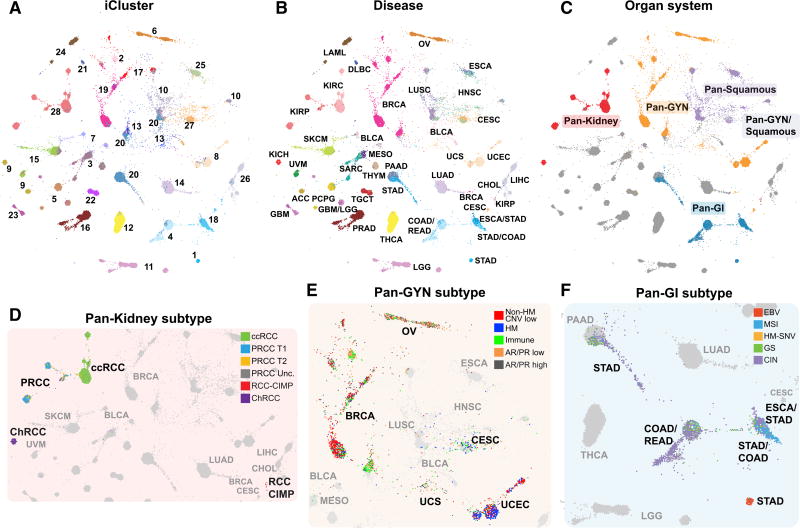
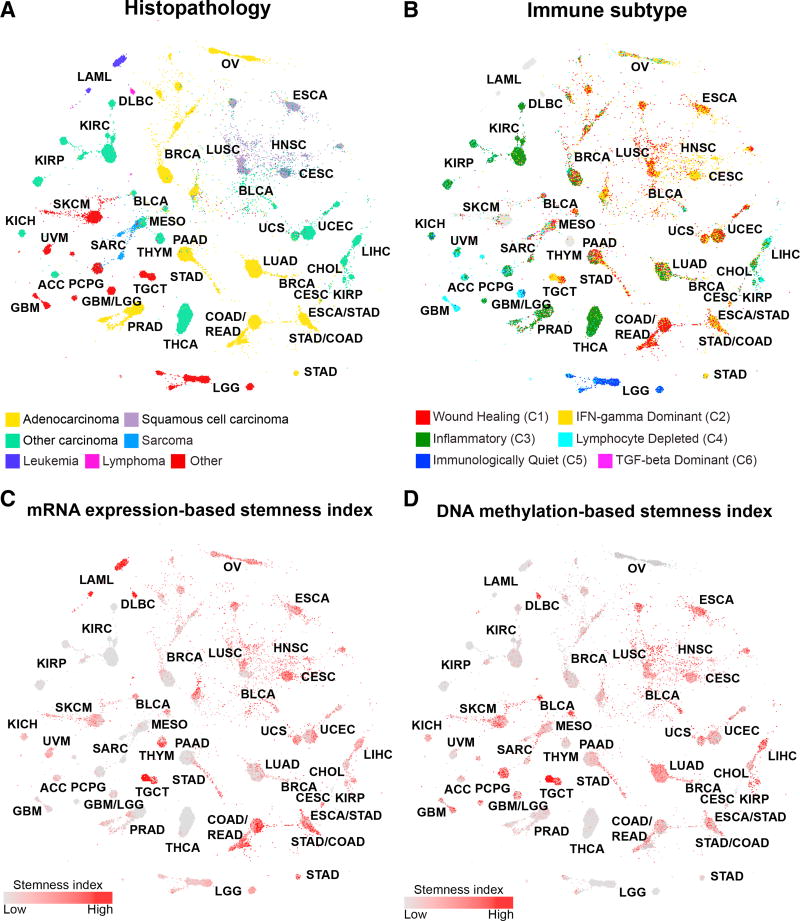
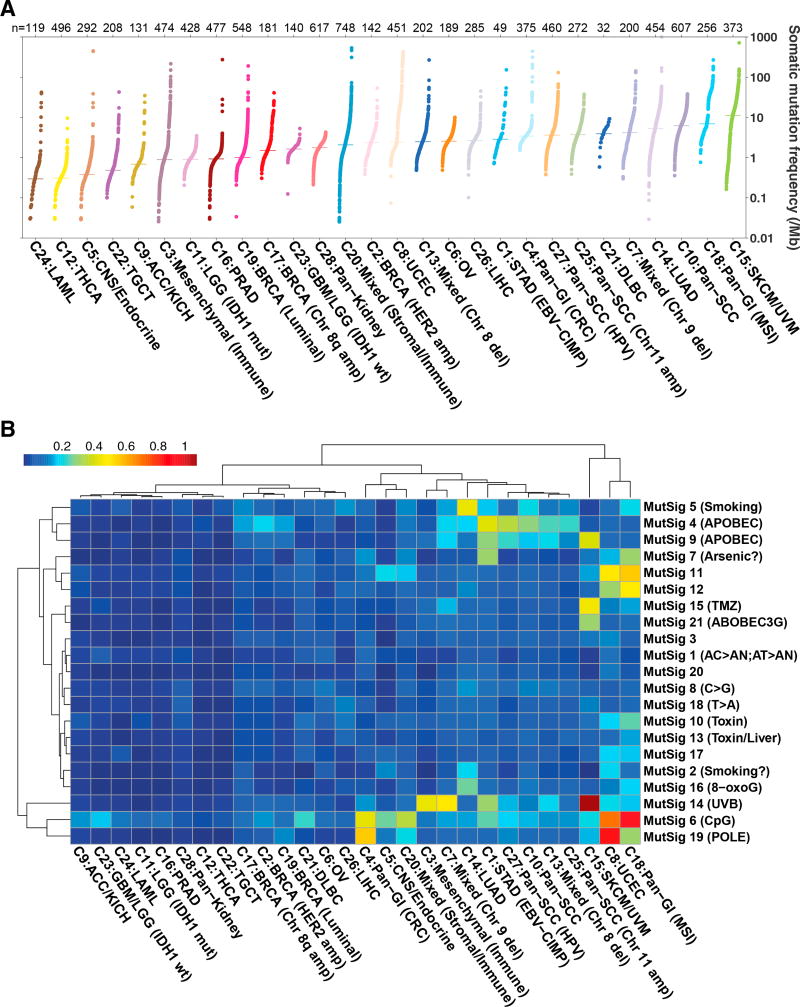
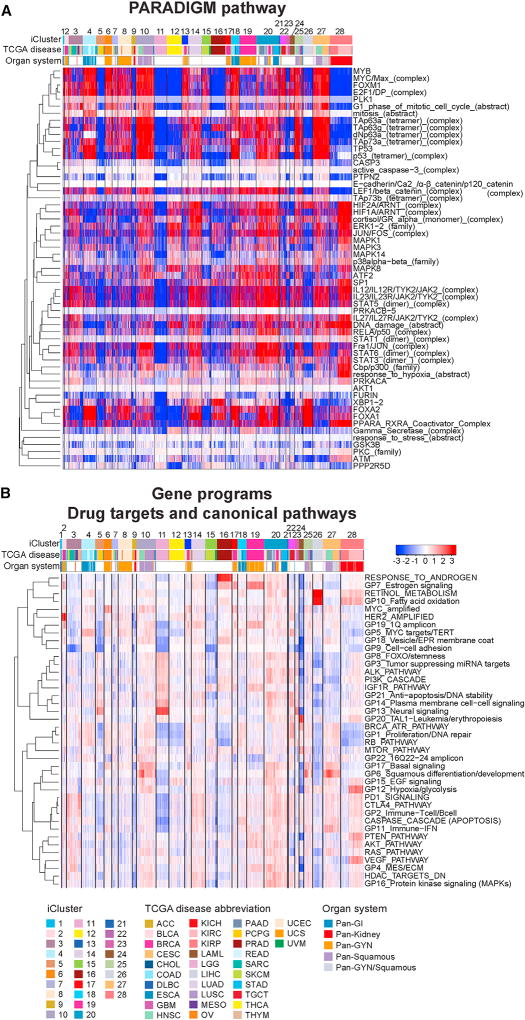
We conducted comprehensive integrative molecular analyses of the complete set of tumors in The Cancer Genome Atlas (TCGA), consisting of approximately 10,000 specimens and representing 33 types of cancer. We performed molecular clustering using data on chromosome-arm-level aneuploidy, DNA hypermethylation, mRNA, and miRNA expression levels and reverse-phase protein arrays, of which all, except for aneuploidy, revealed clustering primarily organized by histology, tissue type, or anatomic origin. The influence of cell type was evident in DNA-methylation-based clustering, even after excluding sites with known preexisting tissue-type-specific methylation. Integrative clustering further emphasized the dominant role of cell-of-origin patterns. Molecular similarities among histologically or anatomically related cancer types provide a basis for focused pan-cancer analyses, such as pan-gastrointestinal, pan-gynecological, pan-kidney, and pan-squamous cancers, and those related by stemness features, which in turn may inform strategies for future therapeutic development.

Keywords: TCGA; cancer; cell-of-origin; genome; methylome; organs; proteome; subtypes; tissues; transcriptome.


Figures

Figure 1
Figure 1. Platform-Specific Classification of 10,000 TCGA Cancer Tumor Samples across 33 Cancer Types
(A) Aneuploidy (AN). Unsupervised consensus clustering of 10,522 tumors and chromosomal arm-level amplifications or deletions. (B) DNA hypermethylation (METH). Clustering of cancer-associated DNA methylation profiles in 10,814 tumors at 1,035 CpG sites lacking DNA methylation in normal tissues (left) and leukocytes (right). DNA methylation β-values are represented as a color gradient from low (blue) to high (red). (C) mRNA (MRNA). Unsupervised consensus clustering of 10,165 tumors and variably expressed genes. (D) microRNA (MIR). Unsupervised hierarchical clustering of 743 expressed mature strands in 10,170 tumors. (E) Protein (P). Unsupervised hierarchical clustering of 7,858 tumor samples from 32 cancer types across 216 cancer-relevant proteins and phosphoproteins. Tumor types are color-coded as shown in the lower-right corner. See also Tables S1–S5.
Figure 2
Figure 2. Cross-Platform Classification Revealed Genomic, Epigenomic, and Transcriptomic Similarities and Differences across Cancer Types
(A) COCA clusters. Membership for individual clusters for each of the five molecular platforms—aneuploidy (AN), methylation (Meth), miRNA expression (miR), mRNA, and RPPA—is displayed as a separate binary membership variable in a distinct row. For the mRNA platform, only clusters containing >40 samples were considered. Samples are labeled for membership of each platform-specific cluster (red, member; white, non-member; gray, not evaluated on the platform). Order of samples and platform-specific clusters were determined by hierarchical clustering using a binary distance matrix and average linkage. Column annotation shows cancer type and tissue organ systems of each sample; row annotations reflect the platform for each classification (bright pink, AN; purple, Meth; light turquoise, miR; dark turquoise, mRNA; orange, RPPA). (B) iCluster. Data used for integrated analysis of iClusters. RPPA data are also included in the heatmap to visualize proteomic patterns across the integrated clusters. (C) iCluster robustness versus composition. Pie charts show the cancer-type composition within each iCluster and the size is proportional to the membership size. The cancer type accounting for the highest proportion of members within the iCluster was considered the dominant cancer type. They coordinate of each pie center reflects this dominant cancer-type proportion; the x coordinate was determined by the iCluster silhouette width. (D) Relationship of TCGA tumor type, iCluster, and Pan-Organ system. The Sankey diagram demonstrates the tumor-type composition of each iCluster. The pan-cancer designations are shown on the right. See also Tables S6 and S7.
Figure 3
Figure 3. Cellularity of the Tumor Microenvironment among iCluster Samples
(A) Stromal fraction of tumor samples. The stromal fraction, defined by subtracting tumor purity (estimated by ABSOLUTE) from one, is shown for 9,057 TCGA tumor samples, segregated by iCluster membership. (B) Leukocyte fraction. Leukocyte fraction, estimated from DNA methylation arrays, for 9,417 tumor samples, for each iCluster, with the exception of C24:LAML and C21:DLBC. (C) Leukocyte fraction versus stromal fraction. Points near the diagonal correspond to tumor samples in which non-tumor stromal cells are nearly all immune cells, and points away from the diagonal correspond to a more mixed or a non-immune stromal tumor microenvironment. Points in the upper-left triangle of each plot are estimation artifacts.
Figure 4
Figure 4. The iCluster TumorMap
(A–F) The map layout was computed from sample Euclidean similarity in the iCluster latent space, and similar samples are positioned in close proximity to each other. Each spot represents a single sample and is colored to represent attributes as described for each panel including (A) iCluster, (B) disease type, and (C) organ system. Organ systems highlighted include pan-kidney, red; pan-gyn, orange; pan-GI, blue; pan-squamous, purple; and those that overlap pan-gyn and pan-squamous, light purple. (D) Subtypes from the pan-kidney analysis (Ricketts et al., 2018). Clear cell renal cell carcinoma (ccRCC), green; papillary renal cell carcinoma type 1 (PRCC T1), blue; papillary renal cell carcinoma type 2(PRCC T2), yellow; unclassified papillary renal cell carcinoma (PRCC Unc.), dark gray; CpG island methylator phenotype renal cell carcinoma (RCC-CIMP), red; and chromophobe renal cell carcinoma (ChRCC), purple. (E) Subtypes from the pan-gyn group (Berger et al., 2018). Not hypermutated, with low copy-number changes (non-HM CNV low), red; hypermutated, with low copy-number changes (HM), blue; high levels of leukocyte infiltration (immune), green; low AR or PR expression (AR/PR low), orange; and high androgen receptor (AR) or progesterone receptor (PR) expression (AR/PR high), dark gray. (F) Subtypes from the pan-GI group (Liu et al., 2018). High Epstein-Barr virus (EBV) burden, red; microsatellite instability (MSI), blue; hypermutated without MSI (HM-SNV), gold; chromosomal instability tumors (CIN), purple; and genome stable (GS) with low aneuploidy, green. The gray dots represent non-highlighted diseases.
Figure 5
Figure 5. Sample Characteristics in the Context of the iCluster TumorMap
(A–D) The TumorMap layout is as described for Figure 4. (A) Histopathology. Colors indicate major histopathology types. Adenocarcinoma, yellow; squamous cell carcinoma, purple; other carcinomas, green; sarcomas, light blue; leukemias, dark blue; lymphomas, magenta; and other, red. (B) Immune subtypes. Wound-healing group, red; IFN-gamma, yellow; inflammatory group, green; lymphocyte-depleted, light blue; immunologically quiescent, dark blue; and transforming growth factor (TGF)-beta activity, magenta. (C and D) Stemness signatures for (C) mRNA and (D) DNA methylation from Malta et al. (2018) are displayed. Increasing red colors indicate increasing stemness index.
Figure 6
Figure 6. Mutation Patterns of iClusters
(A) Somatic mutation frequency (log10) per iCluster sorted by median mutations per megabase. Somatic mutation frequencies were calculated using a filtered MC3 mutation annotation file to determine the total number of mutations per sample, normalized by whole-exome sequencing coverage as described in Knijnenburg et al. (2018). Bars represent median mutation frequency for each iCluster. (B) Mutational signatures (Covington et al., 2016) enriched in iClusters. Mutational signature scores were scaled per sample by the overall mutation rate. The means of scaled signature scores were calculated for each iCluster and log10-transformed. Hierarchical clustered data are displayed in the heatmap (blue, low; red, high).
Figure 7
Figure 7. Pathway Features Characterizing the PanCancer-33 iCluster Subtypes
(A) PARADIGM pathway heatmap. Regulatory nodes with differential PARADIGM-inferred pathway levels (IPL) with at least 15 downstream regulatory targets with differential inferred activities between iClusters are shown for one versus rest comparisons. Samples are arranged by iCluster order; regulatory nodes are hierarchically clustered using 1-Pearson correlation as distance and average linkage. Red-blue intensities represent median-centered IPLs from low (blue) to high (red). (B) Gene programs and canonical pathway values. The 22 Gene Programs (Hoadley et al., 2014) and 20 pathway signatures reflecting drug targets and canonical pathways (found in Table S4 of Hoadley et al. [2014]) were hierarchically clustered using 1-Pearson distance and complete linkage and are shown with samples arranged by iCluster subtypes in numerical order. Red-blue intensities represent signature scores from low (blue) to high (red). See also Tables S8 and S9.

Comment in

  • A pan-cancer atlas.
    Nawy T. Nawy T. Nat Methods. 2018 Jun;15(6):407. doi: 10.1038/s41592-018-0020-4. Nat Methods. 2018. PMID: 29855579 No abstract available.

References

    1. Alencar A, Polley T. DrL (VxOrd) 2011 http://wiki.cns.iu.edu/pages/viewpage.action?pageId=1704113.
    1. Banerjee S, Biehl A, Gadina M, Hasni S, Schwartz DM. JAK-STAT signaling as a target for inflammatory and autoimmune diseases: current and future prospects. Drugs. 2017;77:521–546. - PMC - PubMed
    1. Beck AH, Espinosa I, Edris B, Li R, Montgomery K, Zhu S, Varma S, Marinelli RJ, van deRijn M, West RB. The macrophage colony-stimulating factor 1 response signature in breast carcinoma. Clin. Cancer Res. 2009;15:778–787. - PMC - PubMed
    1. Berger AC, Korkut A, Kanchi RS, Hegde AM, Lenoir W, Liu W, Liu Y, Fan H, Shen H, Ravikumar V, et al. A comprehensive Pan-Cancer molecular study of gynecologic and breast cancers. Cancer Cell. 2018;33 https://doi.org/10.1016/j.ccell.2018.03.014. - DOI - PMC - PubMed
    1. Calabrò A, Beissbarth T, Kuner R, Stojanov M, Benner A, Asslaber M, Ploner F, Zatloukal K, Samonigg H, Poustka A, Sültmann H. Effects of infiltrating lymphocytes and estrogen receptor on gene expression and prognosis in breast cancer. Breast Cancer Res. Treat. 2009;116:69–77. - PubMed

Publication types