. 2018 Apr 5;173(2):321-337.e10.
doi: 10.1016/j.cell.2018.03.035.

Oncogenic Signaling Pathways in The Cancer Genome Atlas

Collaborators, Affiliations

Oncogenic Signaling Pathways in The Cancer Genome Atlas

Francisco Sanchez-Vega et al. Cell. .

Abstract

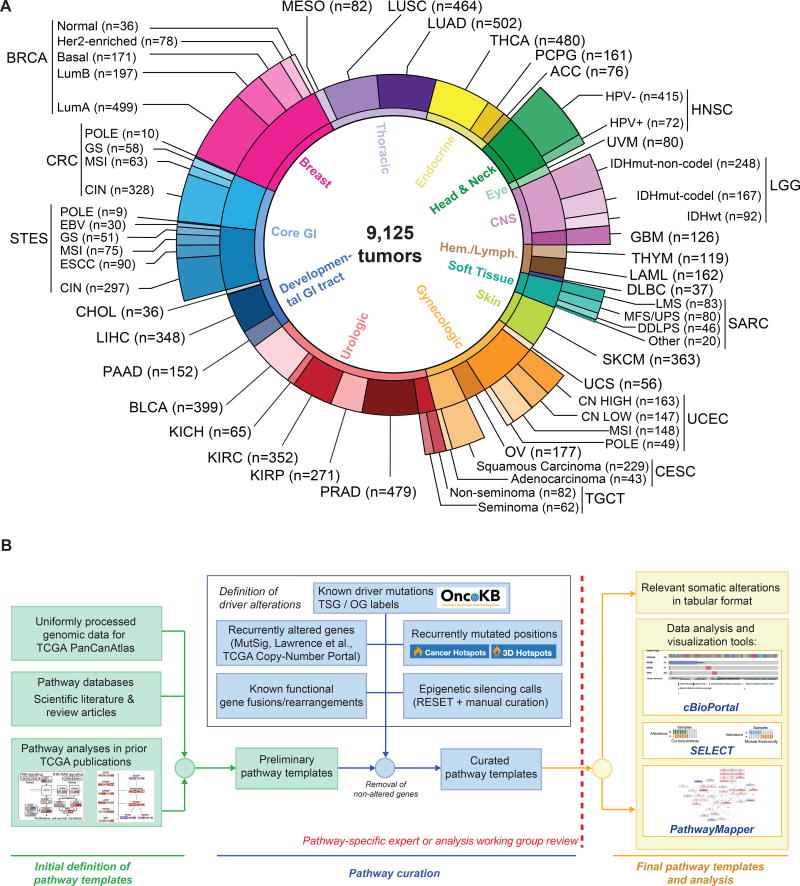
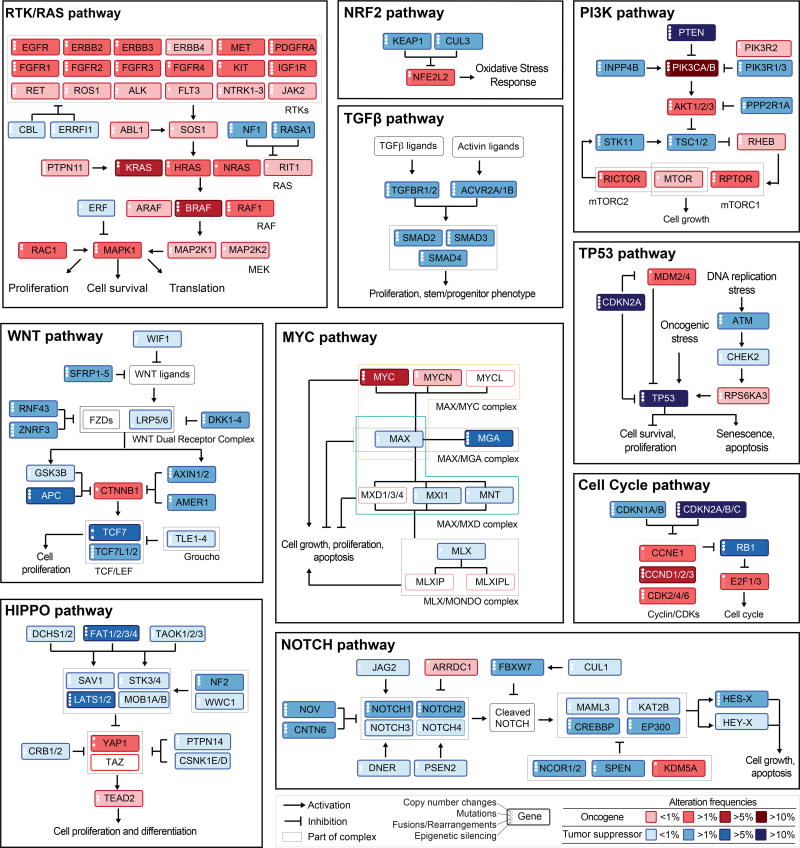
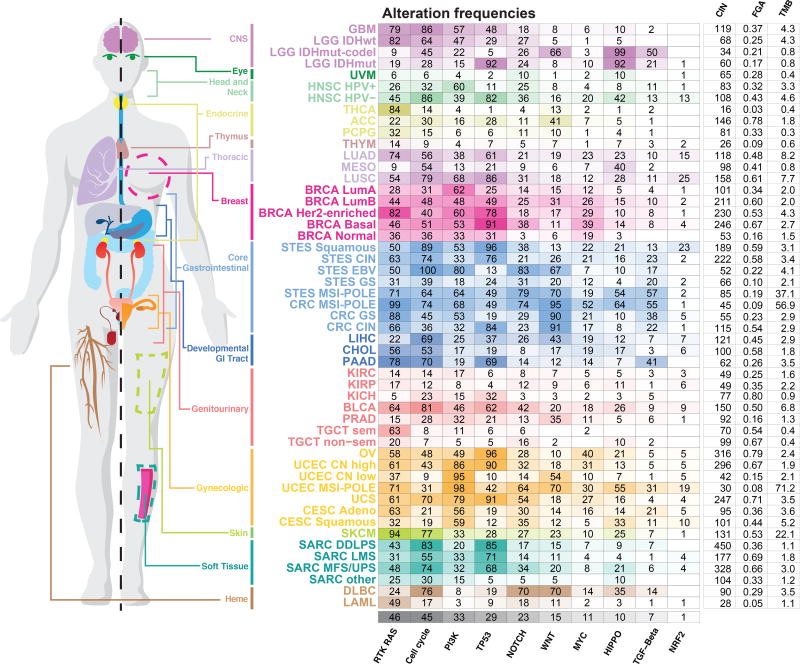
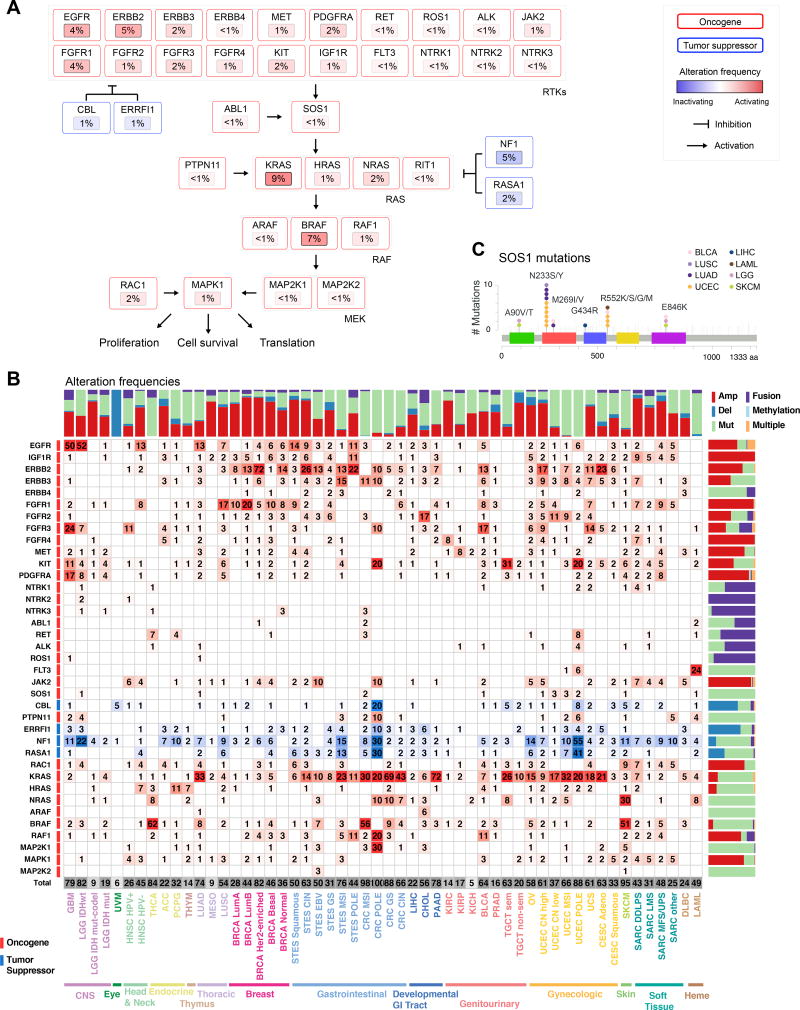
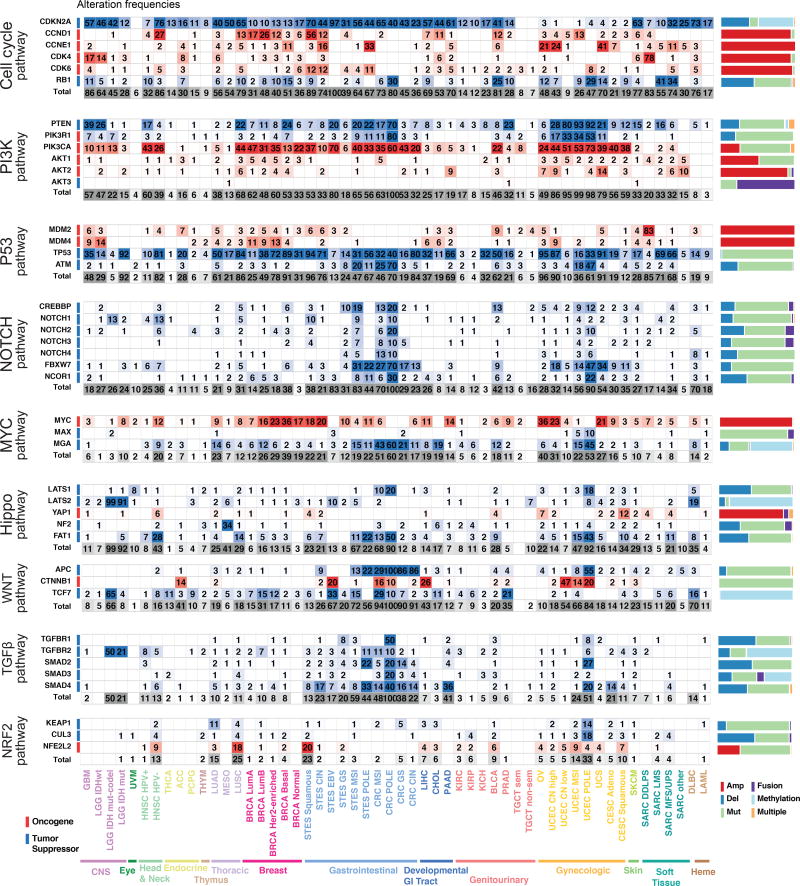
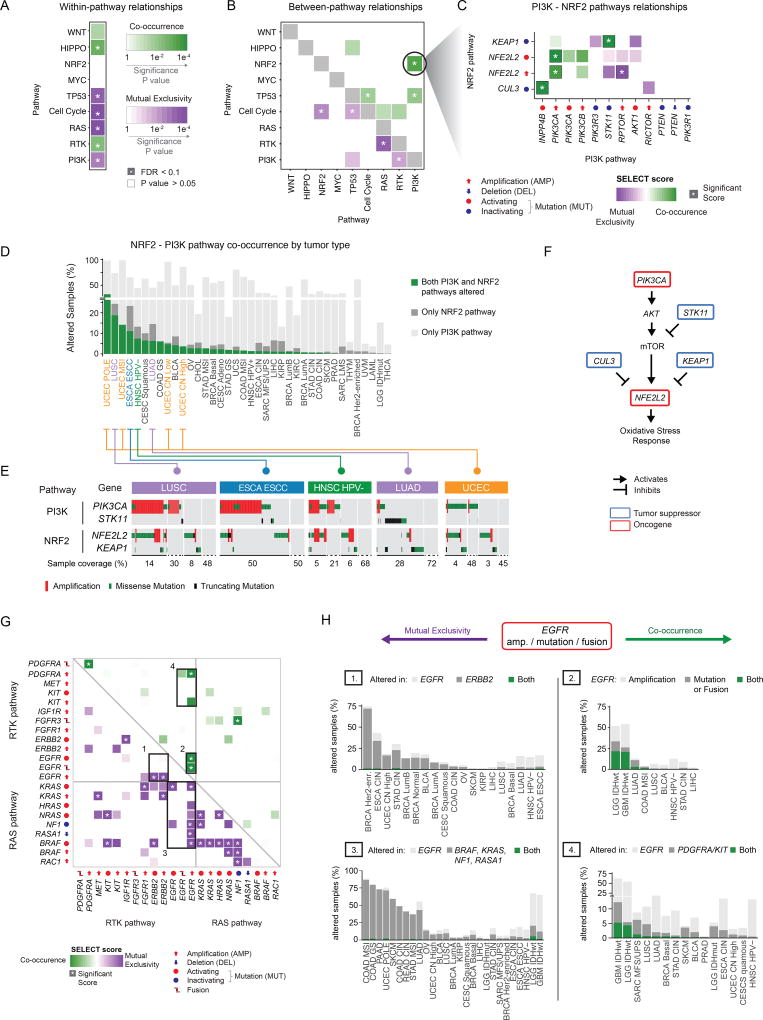
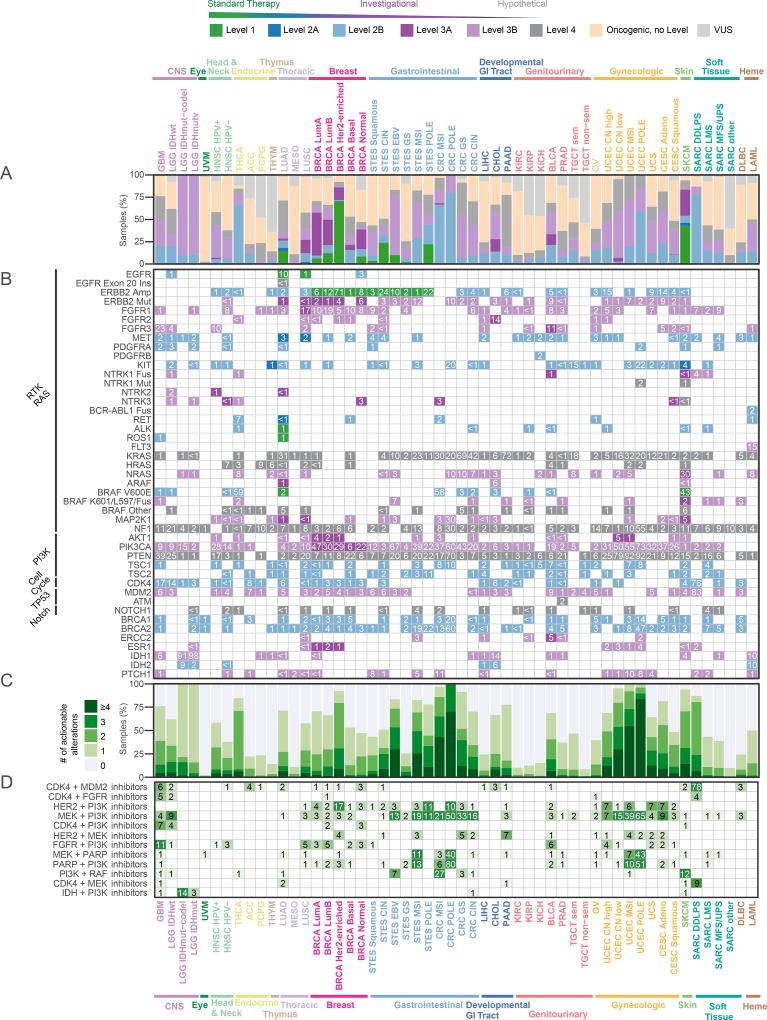
Genetic alterations in signaling pathways that control cell-cycle progression, apoptosis, and cell growth are common hallmarks of cancer, but the extent, mechanisms, and co-occurrence of alterations in these pathways differ between individual tumors and tumor types. Using mutations, copy-number changes, mRNA expression, gene fusions and DNA methylation in 9,125 tumors profiled by The Cancer Genome Atlas (TCGA), we analyzed the mechanisms and patterns of somatic alterations in ten canonical pathways: cell cycle, Hippo, Myc, Notch, Nrf2, PI-3-Kinase/Akt, RTK-RAS, TGFβ signaling, p53 and β-catenin/Wnt. We charted the detailed landscape of pathway alterations in 33 cancer types, stratified into 64 subtypes, and identified patterns of co-occurrence and mutual exclusivity. Eighty-nine percent of tumors had at least one driver alteration in these pathways, and 57% percent of tumors had at least one alteration potentially targetable by currently available drugs. Thirty percent of tumors had multiple targetable alterations, indicating opportunities for combination therapy.

Keywords: PanCanAtlas; TCGA; cancer genome atlas; cancer genomics; combination therapy; pan-cancer; precision oncology; signaling pathways; therapeutics; whole exome sequencing.


Figures

Figure 1
Figure 1. TCGA PanCanAtlas Pathways data set and workflow
(A) Distribution of cancer types in the cohort, including molecular subtypes analyzed. (B) Workflow for pathway curation and analysis. Genes were curated from previous TCGA efforts and the scientific literature. Only genes with evidence for statistically recurrent or known driver alterations in the uniformly processed TCGA PanCanAtlas data set were included in the curated pathway templates. TCGA disease codes and abbreviations: AML: Acute Myeloid Leukemia; ACC:Adrenocortical carcinoma; BRCA:Breast cancer; CESC:Cervical cancer; KICH:Chromophobe renal cell carcinoma; KIRC:Clear cell kidney carcinoma; CRC: colorectal adenocarcinoma; SKCM:Cutaneous melanoma; DLBC:Diffuse large B-cell lymphoma; GBM:Glioblastoma multiforme; HNSC:Head and neck squamous cell carcinoma; LIHC:Liver hepatocellular carcinoma; LGG:Lower Grade Glioma; LUAD:Lung adenocarcinoma; LUSC:Lung squamous cell carcinoma; OV:Ovarian serous cystadenocarcinoma; KIRP:Papillary kidney carcinoma; THCA:Papillary thyroid carcinoma; STAD:Stomach adenocarcinoma; PRAD:Prostate adenocarcinoma; BLCA:Urothelial bladder cancer; UCS:Uterine carcinosarcoma; UCEC:Uterine corpus endometrial carcinoma; ESCA:Esophageal cancer; PCPG:Pheochromocytoma & Paraganglioma; PAAD:Pancreatic ductal adenocarcinoma; MESO:Mesothelioma; UVM:Uveal melanoma; SARC:Sarcoma; CHOL:Cholangiocarcinoma; TGCT:Testicular germ cell cancer; THYM:Thymoma; STES:Stomach and esophageal cancer; EBV:Epstein-Barr Virus; HPV:Human Papillomavirus; DDLPS:Dedifferentiated liposarcoma; LMS:Leiomyosarcoma; MFS/UPS:Myxofibrosarcoma/Undifferentiated Pleomorphic Sarcoma; ESCC:Esophageal Squamous Cell Carcinoma; GS:Genomically Stable; CIN:Chromosomal Instability; MSI:Microsatellite Instability.
Figure 2
Figure 2. Curated Pathways
Pathway members and interactions in the ten selected pathways. Genes are altered at different frequencies (color intensity indicates the average frequency of alteration within the entire data set) by oncogenic activations (red) and tumor suppressor inactivations (blue). The types of somatic alteration considered for each gene (copy-number alterations, mutations, fusions or epigenetic silencing) are specified using a set of four vertical dots on the left of each gene symbol. An expanded version including cross-pathways interactions is provided as Figure S1.
Figure 3
Figure 3. Pathway alteration frequencies
Fraction of altered samples per pathway and tumor subtype. Pathways are ordered by decreasing median frequency of alterations. Increasing color intensities reflect higher percentages. Average mutation count, as well as number of unbalanced segments and fraction genome altered (two measures of the degree of copy-number alterations) per cancer subtype are also provided. The MSI and POLE subtypes were grouped in this figure in colorectal, stomach and endometrial cancers.
Figure 4
Figure 4. RTK-RAS pathway alterations
(A) Altered genes and their functional relationships in the RTK-RAS pathway. Shades of red indicate frequencies of activating events (known or likely activating mutations or fusions, amplifications) and shades of blue indicate frequencies of inactivating events (known or likely inactivating mutations or fusions, homozygous losses). (B) Detailed heatmap of alteration frequencies in members of the RTK-RAS pathway. Only known or likely oncogenic alterations in each gene are considered, as described in Methods. The individual gene alteration frequencies may add up to more than the total for each tumor type, as some tumor samples may have multiple alterations. Color side bars show the fraction of samples affected by each type of somatic alteration (or a combination of them) for each pathway gene. Top color bars show the proportion of different types of alterations for each cancer subtype. (C) Recurrent or known functional mutations in SOS1. Recurrent or known mutations are color-coded by tumor type, all other mutations observed in the gene are considered variants of unknown significance (grey). Three singleton mutations involved in a 3D hotspot are not shown for space reasons: D89A in a UCS sample, A93D in CRC, and S92P in UCEC.
Figure 5
Figure 5. The most commonly altered genes in nine signaling pathways
Oncogenic alteration frequencies per gene and tumor subtype for the most frequently altered genes in each pathway (for RTK-RAS see Figure 4). Red: activating events; blue: inactivating events; frequency of occurrence scale with color intensity. Last row for each pathway: overall alteration frequency of that pathway per tumor type. The individual gene alteration frequencies may add up to more than the total for each tumor type, as some tumor samples have multiple alterations. Color side bars show the fraction of samples affected by each type of somatic alteration (or a combination of them) for each pathway gene. Comprehensive heat maps with alterations for every gene in each pathway are in Figure S2 and Figure S3.
Figure 6
Figure 6. Co-occurrence and mutual exclusivity of pathway alterations
A–B) Mutual exclusivity (purple) and co-occurrence (green) of gene alterations within pathways (A) and between pathways (B). Asterisks indicate significant relationships (Q value < 0.1). (C) Co-occurrence and mutual exclusivity of individual gene alterations in the PI3K and NRF2 pathways. (D) Breakdown of the co-occurrence of gene alterations in the PI3K and NRF2 pathways by tumor subtype. Green bars: percentage of samples with alterations in both PI3K and NRF2 pathways. Pathways are sorted by decreasing percentage of samples with alterations in both pathways. (E) Details of gene alterations in select genes (PIK3CA, STK11, NFE2L2 and KEAP1) within and between PI3K and NRF2 pathways, with co-occurrence and mutual exclusivity between alterations. Samples are shown from left to right, and the number of samples in each group (bottom; note: the changing scale, indicated by solid and dashed lines). (F) Pathway representation of the link between the PI3K and NRF2 pathways. (G) Dependencies between single alterations in the RTK and RAS/ERK pathways. Only the 22 alterations with at least one significant interaction (average sum correction, ASC score > 0.24, (Mina et al., 2017)) included. (H) Breakdown of the interactions involving EGFR amplifications and mutations, corresponding to the bounding boxes in panel G. Left side: mutually exclusive interactions. Right side: co-occurring interactions.
Figure 7
Figure 7. Therapeutic actionability and drug combinations
(A) Frequencies of clinical actionability by cancer subtype, broken down by level of evidence (Levels 1–4). Samples are classified by the alteration that carries the highest level of evidence. Tumor type–specific samples are analyzed by variants considered actionable, oncogenic but not actionable, or variants of unknown significance (VUS). (B) Frequencies of actionable alterations per gene across cancer subtypes. For genes with different levels for different alterations, multiple rows are shown. Genes are grouped by pathway. Six additional genes not in the ten pathways (BRCA1, BRCA2, ERCC2, IDH1, IDH2, ESR1) are included and taken into account in the overall frequencies. (C) Fraction of samples with a given number of actionable alterations per tumor type. (D) Frequencies of possible drug combinations indicated by the co-alteration of actionable variants in each tumor type for the most frequent drug class combinations.

Comment in

References

    1. Alaei-Mahabadi B, Bhadury J, Karlsson JW, Nilsson JA, Larsson E. Global analysis of somatic structural genomic alterations and their impact on gene expression in diverse human cancers. Proc. Natl. Acad. Sci. United States Am. 2016;113:13768–13773. - PMC - PubMed
    1. Alexandrov LB, Nik-Zainal S, Wedge DC, Aparicio SAJR, Behjati S, Biankin AV, Bignell GR, Bolli N, Borg A, Børresen-Dale A-L, et al. Signatures of mutational processes in human cancer. Nature. 2013;500:415–421. - PMC - PubMed
    1. Aster JC, Blacklow SC. Targeting the Notch pathway: twists and turns on the road to rational therapeutics. J. Clin. Oncol. Off. J. Am. Soc. Clin. Oncol. 2012;30:2418–2420. - PubMed
    1. Bahceci I, Dogrusoz U, La KC, Babur Ö, Gao J, Schultz N. PathwayMapper: a collaborative visual web editor for cancer pathways and genomic data. Bioinforma. 2017;33:2238–2240. - PMC - PubMed
    1. Bailey MH, Tokheim C, Porta-Pardo E, Sengupta S, Betrand D, Weerasinghe A, Colaprico A, Kim J, Wendl MC, Reardon B, et al. Comprehensive Discovery and Characterization of Driver Genes and Mutations in Human Cancers. Cell 2017

Publication types

MeSH terms

Substances