
Pathogenic Germline Variants in 10,389 Adult Cancers

Kuan-Lin Huang et al. Cell. .

Abstract

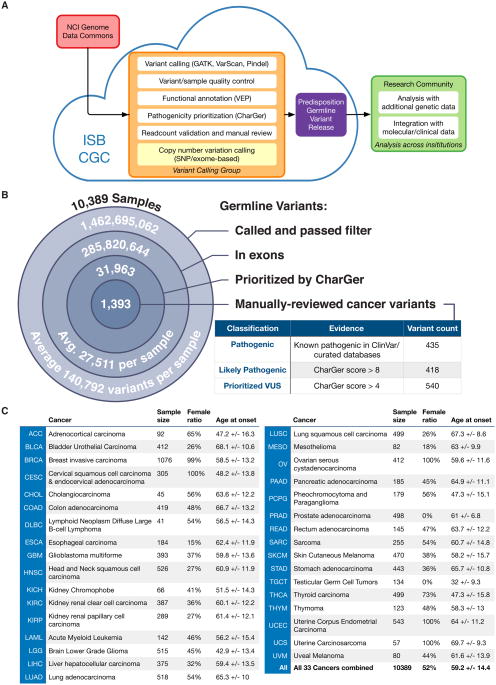
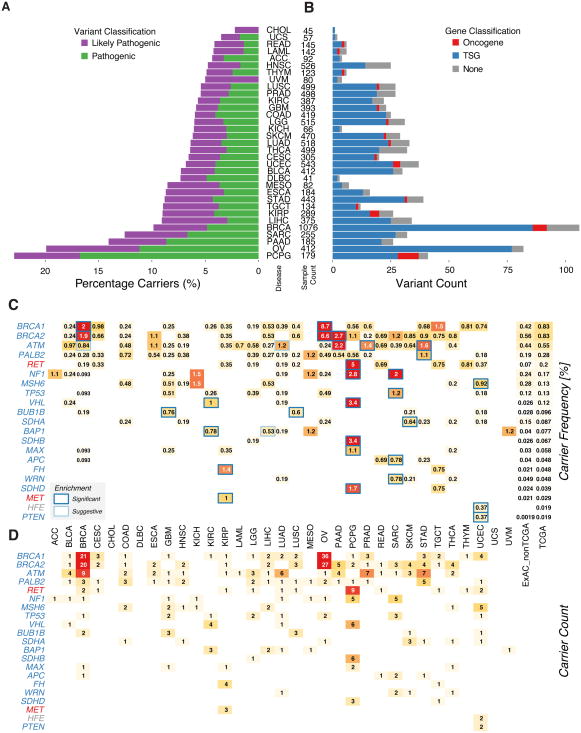
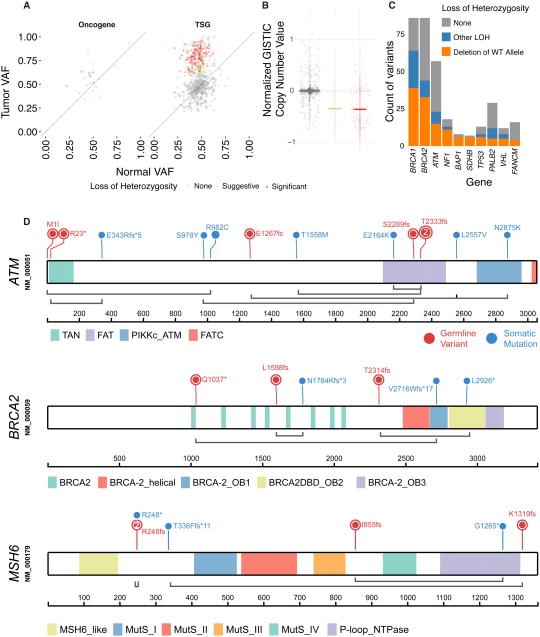
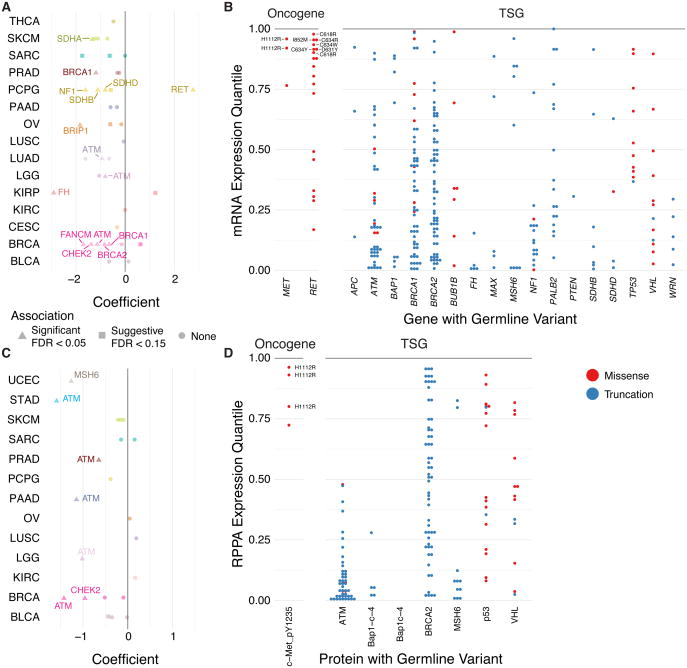
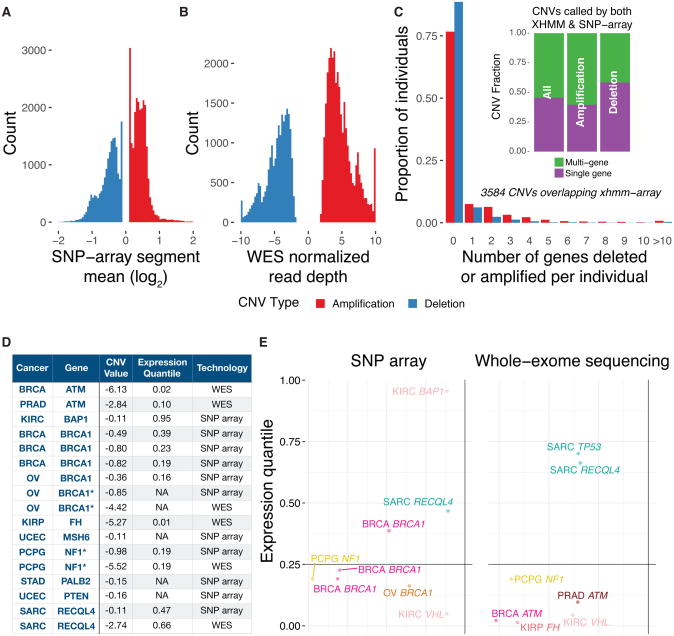
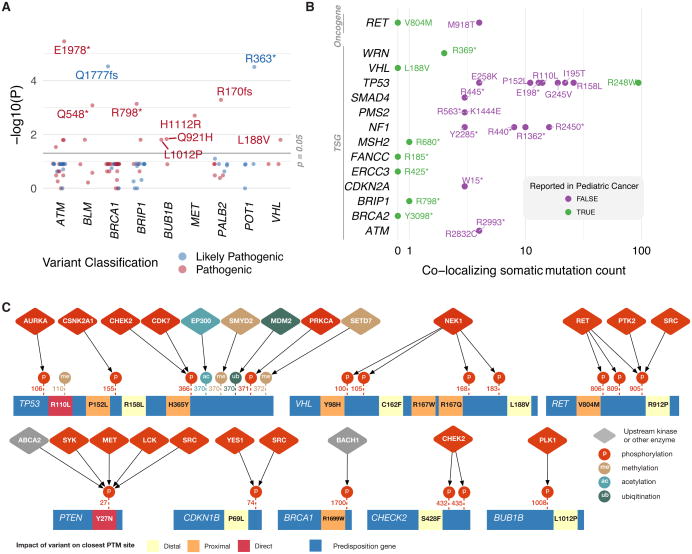
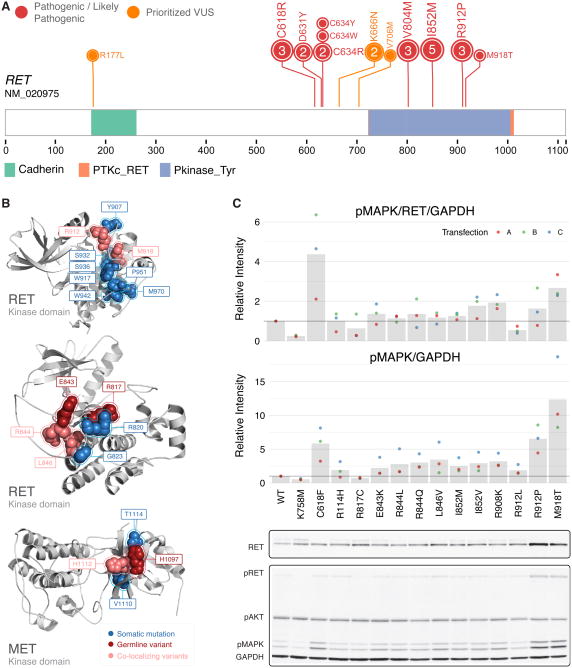
We conducted the largest investigation of predisposition variants in cancer to date, discovering 853 pathogenic or likely pathogenic variants in 8% of 10,389 cases from 33 cancer types. Twenty-one genes showed single or cross-cancer associations, including novel associations of SDHA in melanoma and PALB2 in stomach adenocarcinoma. The 659 predisposition variants and 18 additional large deletions in tumor suppressors, including ATM, BRCA1, and NF1, showed low gene expression and frequent (43%) loss of heterozygosity or biallelic two-hit events. We also discovered 33 such variants in oncogenes, including missenses in MET, RET, and PTPN11 associated with high gene expression. We nominated 47 additional predisposition variants from prioritized VUSs supported by multiple evidences involving case-control frequency, loss of heterozygosity, expression effect, and co-localization with mutations and modified residues. Our integrative approach links rare predisposition variants to functional consequences, informing future guidelines of variant classification and germline genetic testing in cancer.

Keywords: LOH; cancer predisposition; germline and somatic genomes; variant pathogenicity.


Figures

Figure 1
Figure 1. Predisposition variant discovery in 10,389 adult cancers of the TCGA PanCanAtlas cohort
(A) A scalable variant calling and data sharing model using ISB Cancer Genome Cloud (ISB-CGC). (B) Number of germline variants at each step of discovery from more than 1.46 billion total germline variants called from WES bam files to 1,393 prioritized, manual-reviewed related to cancer predisposition. The 853 pathogenic or likely pathogenic variants are used in downstream analyses. (C) Attributes of the 10,389 cases of 33 cancer types included in the final analyses including TCGA abbreviation of the cancer type, gender ratio and age at onset. See also Figure S1 and S2, and Table S1.
Figure 2
Figure 2. Distribution of pathogenic germline variants across genes and cancer types
(A) Percentage of TCGA cases carrying pathogenic and likely pathogenic variants in each of the 33 cancer types. (B) Count of pathogenic or likely pathogenic variants in tumor suppressors, oncogenes and other genes in each of the cancer type. (C) Carrier frequency of pathogenic variants in genes enriched in cancers. The numbers in each box (carrier frequency) indicates the percentage of carriers of pathogenic variants of each gene in the specified cancer cohort. The black outlines indicate the cancer type is significantly (FDR < 0.05) enriched for pathogenic variants of that gene. The grey outlines indicate suggestive (FDR < 0.15) enrichment. (D) Counts of pathogenic and likely pathogenic variants in the oncogenes and tumor suppressors enriched in cancers. See also Figure S2 and S7, and Table S2, S3, and S7.
Figure 3
Figure 3. Systematic identification of two-hit events in TCGA cancers
(A) Identification of loss of heterozygosity (LOH) in oncogenes and tumor suppressors through comparison of variant allele frequencies in tumor and normal samples. Each dot depicts one variant. The diagonal line denotes neutral selection of the germline variant where the normal and tumor variant allele frequencies (VAFs) are identical. (B) Somatic copy number changes detected for the tumors showing significant LOH in each gene. Significant, suggestive, and no evidence of LOH are shown in red, green and grey, respectively. (C) Counts of germline variants showing the various types of classified LOH in cancer predisposition genes, highlighting LOH due to deletion of the wild type alleles in tumor suppressors (shown in orange). (D) Candidate biallelic events of pathogenic or likely pathogenic variants coupled with somatic mutations on gene products of ATM, BRCA2, and MSH6. Germline variants are colored in red and somatic mutations are in blue. Coupled germline and somatic events observed in the same case are linked with grey lines. See also Figure S3 and Table S4.
Figure 4
Figure 4. Germline variants associated with expression impacts
(A) Plot showing cancer types where the carrier of each gene's germline variant is associated with significantly higher or lower expression of the gene transcript. Each dot represents a gene-cancer association where the color depicts the cancer type and the shape shows significance. (B) Distribution of gene expression of pathogenic variant carriers. Each dot corresponds to the gene expression percentile in a case carrying germline variants relative to other cases of their corresponding cancer cohort. Variants in oncogenes associated with high expression are labeled. (C) Plot showing cancer types where the carrier of each gene's germline variant is associated with significantly higher or lower expression of the RPPA protein/phosphoprotein marker. Each dot represents a gene-cancer association where the color depicts the cancer type and the shape shows significance. (D) Distribution of protein/phosphoprotein expression of pathogenic variant carriers. Each dot corresponds to the expression percentile of the RPPA marker in a case carrying germline variants relative to other cases of their corresponding cancer cohort. The genes shown in (B) and (D) are based on their significant enrichment of pathogenic variants. See also Figure S4 and Table S5.
Figure 5
Figure 5. Rare germline copy number variations (CNVs)
(A) Copy Number Variations (CNVs) identified through SNP array data, where the CNV value is measured by the log2-transformed segment mean. (B) Copy Number Variations (CNVs) identified through whole-exome sequencing data using XHMM, where the CNV value is measured by the normalized read depth of the genomic region. (C) Characteristics of the 3,582 overlapping CNVs identified using both technologies, including fractions of samples carrying deletions/duplications and the number of genes affected by each type of CNVs. (D) CNVs identified in predisposition genes associated with specific cancer types, along with its CNV value, corresponding gene expression and technology used for detection. *The two pair of events discovered by both the SNP array and WES data in the same CNV carrier. (E) Expression quantile associated with each CNV events in their respective cancer types. Each dot represents one CNV events shown in (D) colored by the cancer type. See also Figure S5.
Figure 6
Figure 6. Independent evidence supporting functionality of pathogenic variants
(A) Pathogenic germline variants showing significant enrichment in TCGA cases compared to non-TCGA cases in the ExAC Non-Finnish European cohort. (B) Variants with co-localizing recurrent somatic mutations (N ≥ 3 in the TCGA PanCanAtlas MC3 dataset) or pathogenic germline variants in 1,120 pediatric cancers. (C) Site-specific interaction network of predisposition proteins shows how germline substitutions occur in or near experimentally determined binding sites of upstream kinases and other enzymes. See also Figure S6 and Table S6.
Figure 7
Figure 7. Germline variants in the kinase domain of the receptor tyrosine kinase RET
(A) Pathogenic or likely pathogenic germline variants along the RET protein observed in the TCGA cohort. (B) Co-clustering of somatic mutations and germline variants in the kinase domain of RET and MET shown on 3D protein structures (PDB structures: 21VT, 1R0P, and 1XPD from left to right). Germline variants are colored in red; somatic mutations are colored in blue; amino acid residues affected by both type of mutations are colored in salmon. (C) Experimental assessment of the signaling functionality of RET germline alleles. In the top bar plot, ligand-independent RET activity was measured through pMAPK/RET/GAPDH normalized to the ratio observed in wild-type. In the bottom barplot, experimental assessment of RET germline alleles measured through pMAPK/GAPDH normalized to the ratio observed in wild-type. See also Table S6.

References

    1. Adzhubei I, Jordan DM, Sunyaev SR. Predicting functional effect of human missense mutations using PolyPhen-2. Curr Protoc Hum Genet. 2013;Chapter 7(Unit 7):20. - PMC - PubMed
    1. Adzhubei IA, Schmidt S, Peshkin L, Ramensky VE, Gerasimova A, Bork P, Kondrashov AS, Sunyaev SR. A method and server for predicting damaging missense mutations. Nat Methods. 2010;7:248–249. - PMC - PubMed
    1. Amendola LM, Jarvik GP, Leo MC, McLaughlin HM, Akkari Y, Amaral MD, Berg JS, Biswas S, Bowling KM, Conlin LK, et al. Performance of ACMG-AMP Variant-Interpretation Guidelines among Nine Laboratories in the Clinical Sequencing Exploratory Research Consortium. Am J Hum Genet. 2016;98:1067–1076. - PMC - PubMed
    1. Ballinger ML, Goode DL, Ray-Coquard I, James PA, Mitchell G, Niedermayr E, Puri A, Schiffman JD, Dite GS, Cipponi A, et al. Monogenic and polygenic determinants of sarcoma risk: an international genetic study. Lancet Oncol. 2016;17:1261–1271. - PubMed
    1. Basu S, Pan W. Comparison of statistical tests for disease association with rare variants. Genet Epidemiol. 2011;35:606–619. - PMC - PubMed

Publication types

Substances