
Comprehensive Characterization of Cancer Driver Genes and Mutations

Matthew H Bailey et al. Cell. .

Erratum in

  • Comprehensive Characterization of Cancer Driver Genes and Mutations.
    Bailey MH, Tokheim C, Porta-Pardo E, Sengupta S, Bertrand D, Weerasinghe A, Colaprico A, Wendl MC, Kim J, Reardon B, Kwok-Shing Ng P, Jeong KJ, Cao S, Wang Z, Gao J, Gao Q, Wang F, Liu EM, Mularoni L, Rubio-Perez C, Nagarajan N, Cortés-Ciriano I, Zhou DC, Liang WW, Hess JM, Yellapantula VD, Tamborero D, Gonzalez-Perez A, Suphavilai C, Ko JY, Khurana E, Park PJ, Van Allen EM, Liang H; MC3 Working Group; Cancer Genome Atlas Research Network; Lawrence MS, Godzik A, Lopez-Bigas N, Stuart J, Wheeler D, Getz G, Chen K, Lazar AJ, Mills GB, Karchin R, Ding L. Bailey MH, et al. Cell. 2018 Aug 9;174(4):1034-1035. doi: 10.1016/j.cell.2018.07.034. Cell. 2018. PMID: 30096302 Free PMC article. No abstract available.

Abstract

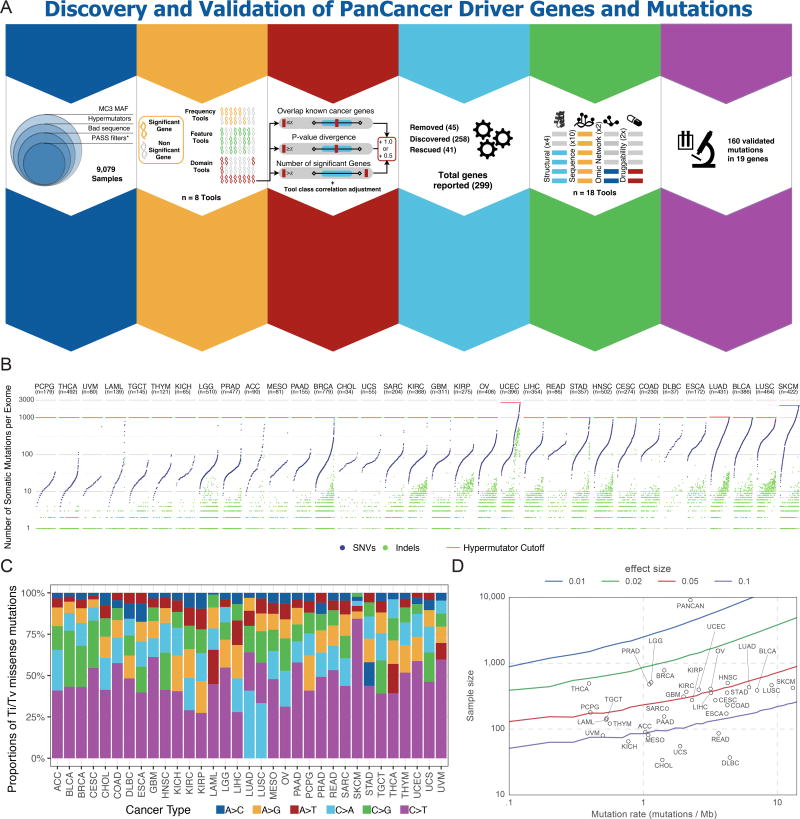
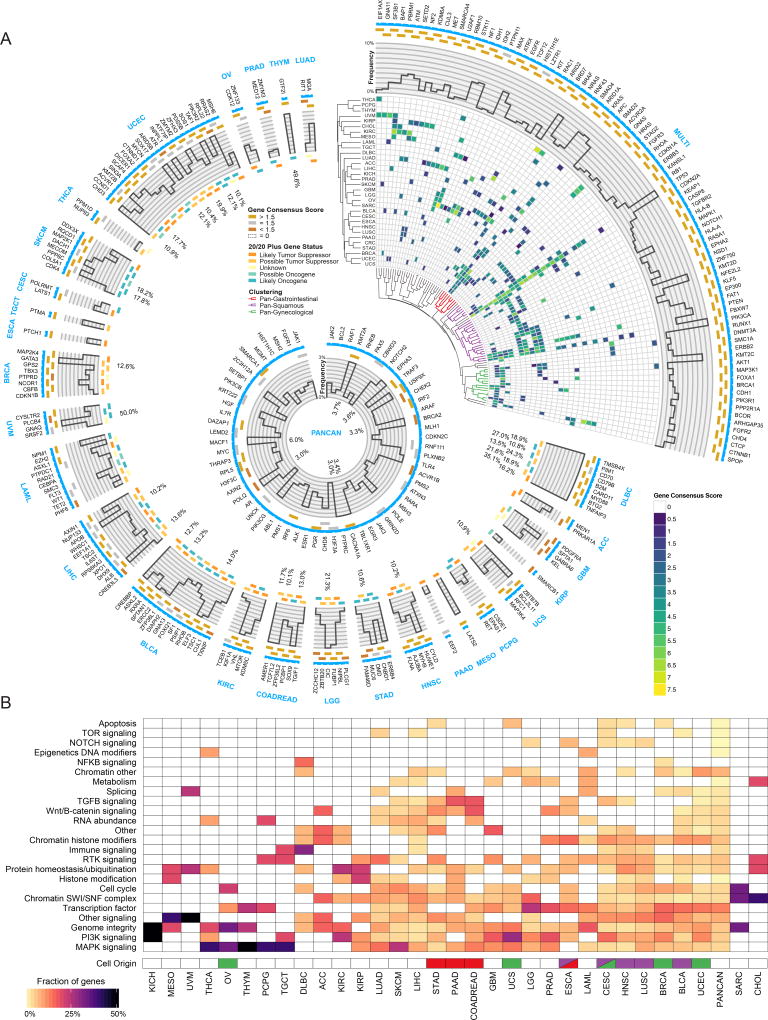
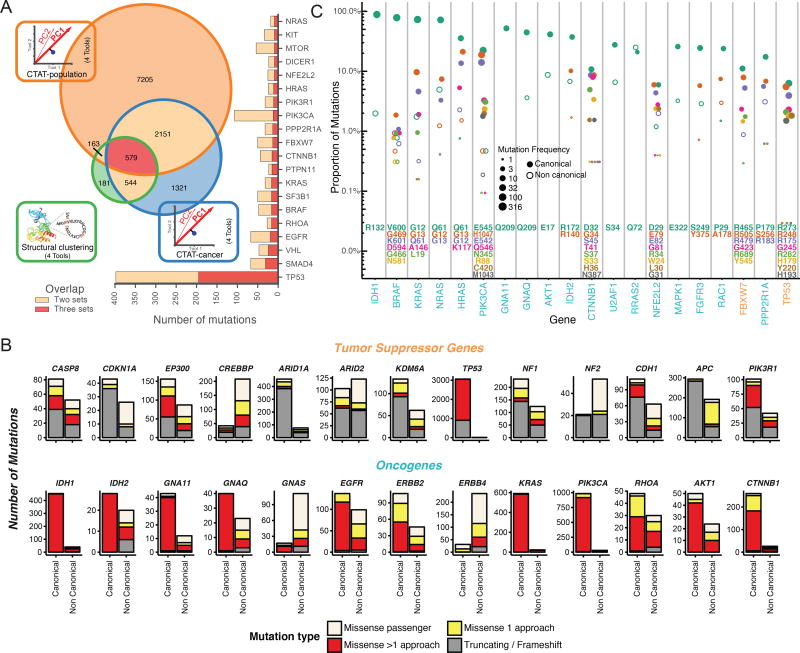
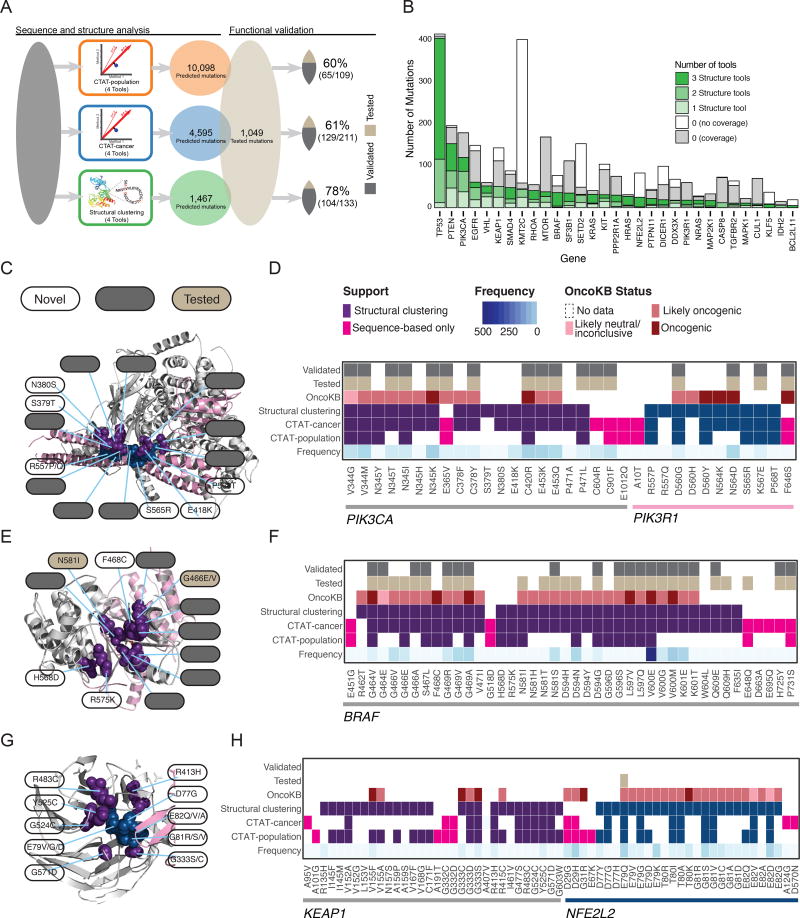
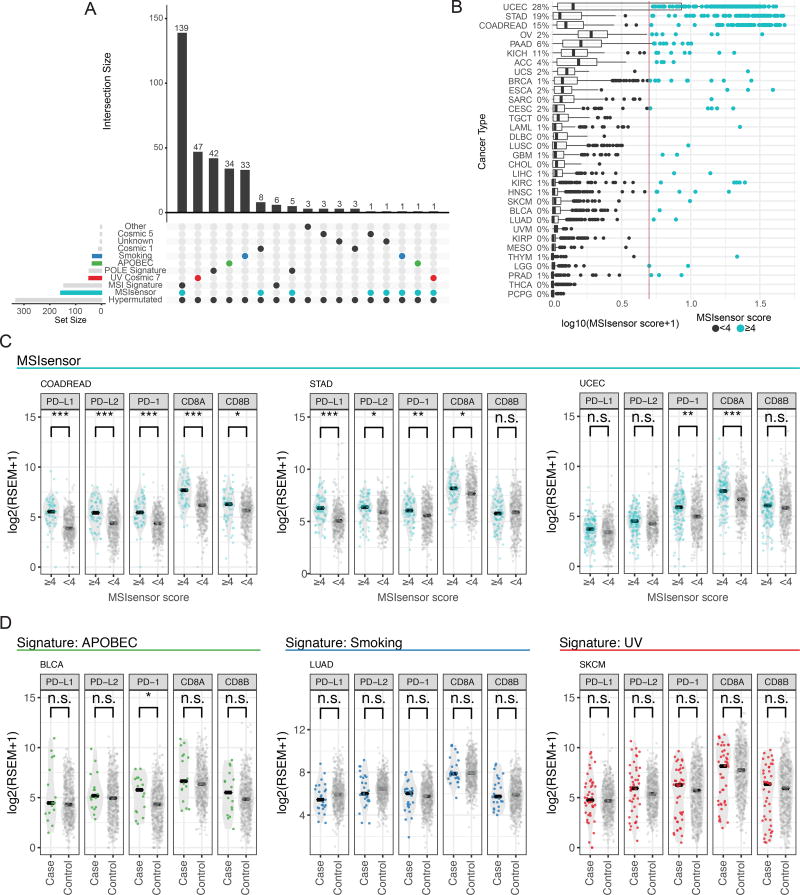
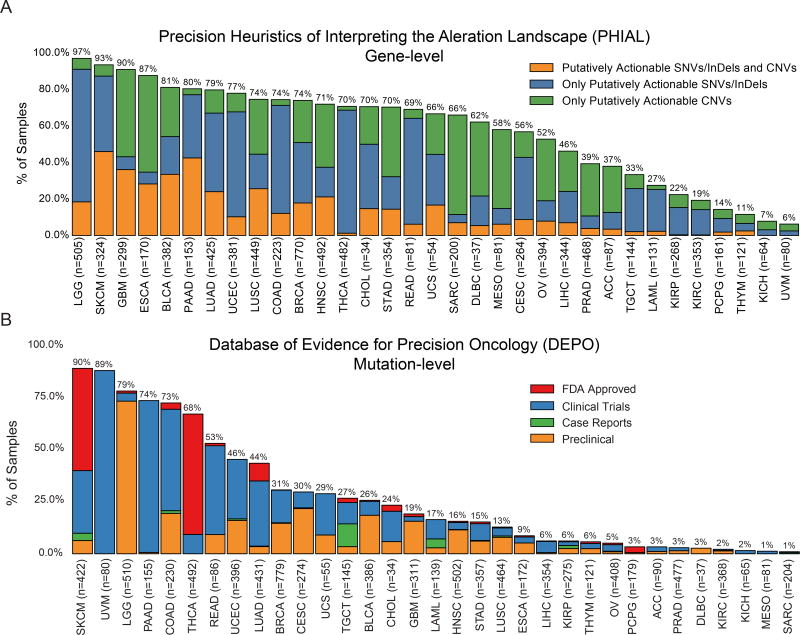
Identifying molecular cancer drivers is critical for precision oncology. Multiple advanced algorithms to identify drivers now exist, but systematic attempts to combine and optimize them on large datasets are few. We report a PanCancer and PanSoftware analysis spanning 9,423 tumor exomes (comprising all 33 of The Cancer Genome Atlas projects) and using 26 computational tools to catalog driver genes and mutations. We identify 299 driver genes with implications regarding their anatomical sites and cancer/cell types. Sequence- and structure-based analyses identified >3,400 putative missense driver mutations supported by multiple lines of evidence. Experimental validation confirmed 60%-85% of predicted mutations as likely drivers. We found that >300 MSI tumors are associated with high PD-1/PD-L1, and 57% of tumors analyzed harbor putative clinically actionable events. Our study represents the most comprehensive discovery of cancer genes and mutations to date and will serve as a blueprint for future biological and clinical endeavors.

Keywords: driver gene discovery; mutations of clinical relevance; oncology; structure analysis.


Conflict of interest statement

Declaration of Interests

The authors declare no competing interests.

Figures

Figure 1
Figure 1. Cancer driver gene discovery strategy, power, and mutations
(A) We identified 6 main steps to identify and discover driver genes in cancer: data curation, tool development, outlier adjustment, manual curation, downstream tool analysis, and functional validation. (B) Somatic mutations per sample are plotted for each sample and cancer type. Mutations are separated into SNVs (blue) and indels (green). The selected hypermutator cut-off for each cancer is shown in red. (C) Transition and transversion proportions are shown for 6 nucleotide changes. The stacked proportion bar chart is sorted by increasing transition/transversion fraction. (D) Statistical power for detection of cancer driver genes at defined fractions of tumor samples above the background mutation rate (effect size with 90% power) is depicted. Circles indicate each of 33 cancer types placed according to the study sample size and median background mutation rate. See also Figures S1 and S2, and Table S6.
Figure 2
Figure 2. Cancer driver gene discovery workflow
(A) Circos(Krzywinski et al., 2009) plot displays 299 cancer genes. Each sector indicates a unique cancer type (text in blue) with predicted drivers unique to that cancer type listed (gene name in black). Only tissues having at least one unique driver gene are shown. The top right sector shows all genes found significant in multiple cancer types. Next, a categorical score of gold, silver, or bronze is assigned to each gene based on the highest consensus score. If a gene was not scored and required rescue, then the field is empty. The next ring illustrates the mutation frequency of a gene. For the top right wedge the PanCancer frequency is used, while cancer-type-specific frequencies are used in the remaining sectors. Where frequencies exceed the y-axis limit of 10%, the innermost label indicates the frequency. The final ring uses a 5-point scale from orange to teal for representing each gene from likely tumor suppressor to likely oncogene, respectively, according to the 20/20+ algorithm. Finally, in the top right slice, we show hierarchical clustering of the gene consensus scores for genes that were found in more than one cancer type (note: CRC refers to the COADREAD cancer type). Additionally, significant gene clusters (permutation test) identified Pan-Gastrointestinal (red), Pan-Squamous (purple), and Pan-Gynecological tissues (green). The middle ring illustrates all genes that were found only using PanCancer results, or were otherwise rescued. (B) Heatmap showing clustering of different cancer types by pathway / biological process affected by associated consensus driver genes. Cell of origin for pan-gynecological, pan-gastrointestinal, and pan-squamous are colored as above. See also Figures S2, S3 and S4, and Tables S1, S2, and S7.
Figure 3
Figure 3. Driver mutation discovery approaches, overview, overlap, and contrasts
(A) Venn diagram indicates total number of mutations overlapping among three consensus approaches: CTAT-population, CTAT-cancer, and structural clustering. Adjacent bar chart indicates the top 20 genes sorted by 3-set intersecting mutation counts. (B) Driver gene discovery identified gene-tissue pairs (canonical genes) in tumor suppressors and oncogenes. However, some gene-tissue pairs were not identified in driver discovery (non-canonical). Mutation frequency from canonical and non-canonical cancer genes are displayed and divided among 4 mutation classes: truncation/frameshift mutations (grey); missense mutations uniquely identified by only one approach (yellow, see Panel A); missense mutations identified by multiple approaches (red, see Panel A); and missense passenger mutations not identified by any approach (off white). (C) Mutation percentage out of all missense and truncating/frameshift mutations within a gene is shown on the y-axis (log scale). Point size is log scaled and represents amino acid position frequency. The top 23 genes ordered by increasing mutational diversity (normalized entropy) and only the 9 most frequently mutated amino acid positions for each gene are shown. See also Figure S5 and Table S4.
Figure 4
Figure 4. Driver mutation discovery and validation
(A) Steps taken to assess consensus among mutation-level predictions using sequence-based and structural clustering tools and comparing them to an orthogonal set of functionally validated mutations. From left to right: grey box represents missense mutations that were processed by 12 tools from 3 categories (population-based, cancer-focused, and structural clustering tools) and combined into three consensus approaches (CTAT-population, CTAT-cancer, and structural clustering). Total number and percentage of functionally validated/tested mutations is also shown. (B) Number of mutations (y-axis) found by structural tools for each gene (x-axis) are shaded according to support by structural tools (green). Those mutations without support are distinguished by two categories, with (grey) and without (white) available protein structure. Heatmaps (D, F, H) coupled with protein structure (C, E, G) are shown in panels for proteins PIK3CA/PIK3R1 (PDB ID: 4OVU), BRAF (4MBJ), and KEAP1/NFE2L2 (3ZGC), respectively, and display whether a particular mutation was detected by sequence-based (CTAT-population or CTAT-cancer) or structure-based approaches (at least two structural tools). Purple/teal colors distinguish proteins (PIK3CA/PIK3R1 and KEAP1/NFE2L2 pairs) for mutations found by structure-based approaches, while pink boxes indicate mutations found only by sequence-based approach. Additionally, for each mutation, frequency (blue gradient), OncoKB status (red gradient), testing status (tan), and validation status (grey) are provided. All mutations found by structure-based approaches in each of the 3 genes are shown with a few additional mutations that are only found by sequence-based approaches. Key mutations are highlighted from heatmaps and labeled with white, grey, and tan labels referring to novel, validated, and tested (not validated) mutations, respectively. See also Table S4.
Figure 5
Figure 5. Hypermutators exhibit multiple signatures, microsatellite instability, and immune infiltration expression
(A) UpSetR(Conway et al., 2017) plot highlights the intersection of multiple signatures and phenotypes with hypermutated samples. (B) MSI scores segregated by cancer types. MSI-score threshold is displayed with a vertical line. The percentage of samples with high MSI is displayed to the right of each cancer type. (C, D) RNA-Seq abundance of different immune biomarkers across signatures and MSI phenotypes defined by MSIsensor. Stars indicate significance levels using a two-sided t-test to calculate p-values (* < 0.05, ** < 0.01, *** < 0.001). See also Figure S6 and Table S5.
Figure 6
Figure 6. Putative actionability across TCGA studies
(A) Percentage of samples (y-axis) with at least 1 putatively actionable SNV/indel/CNV (orange), SNV/indel (blue), and CNV only (green) for each cancer type (x-axis) from the TARGET database. Sample size is also given for each cancer type in x-axis labels. Only 8,775 samples are represented due to limitations of copy number data. (B) Percentage of samples (y-axis) with a druggable mutation (missense, indel, frameshift, and nonsense) from DEPO in each cancer type (x-axis) at various stages of approval: FDA approved (red), Clinical Trials (blue), Case Reports (green), and Preclinical (orange). 9079 samples are represented. See also Figure S7.

References

    1. Adjei AA, Cohen RB, Franklin W, Morris C, Wilson D, Molina JR, Hanson LJ, Gore L, Chow L, Leong S. Phase I pharmacokinetic and pharmacodynamic study of the oral, small-molecule mitogen-activated protein kinase kinase 1/2 inhibitor AZD6244 (ARRY-142886) in patients with advanced cancers. Journal of clinical oncology. 2008;26:2139–2146. - PMC - PubMed
    1. Adzhubei I, Jordan DM, Sunyaev SR. Predicting functional effect of human missense mutations using PolyPhen - 2. Current protocols in human genetics. 2013:7.20. 21–27.20. 41. - PMC - PubMed
    1. Alexandrov LB, Nik-Zainal S, Wedge DC, Aparicio SA, Behjati S, Biankin AV, Bignell GR, Bolli N, Borg A, Børresen-Dale A-L. Signatures of mutational processes in human cancer. Nature. 2013;500:415–421. - PMC - PubMed
    1. Ascierto PA, Schadendorf D, Berking C, Agarwala SS, van Herpen CM, Queirolo P, Blank CU, Hauschild A, Beck JT, St-Pierre A. MEK162 for patients with advanced melanoma harbouring NRAS or Val600 BRAF mutations: a non-randomised, open-label phase 2 study. The lancet oncology. 2013;14:249–256. - PubMed
    1. Barbieri CE, Baca SC, Lawrence MS, Demichelis F, Blattner M, Theurillat J-P, White TA, Stojanov P, Van Allen E, Stransky N. Exome sequencing identifies recurrent SPOP, FOXA1 and MED12 mutations in prostate cancer. Nature genetics. 2012;44:685–689. - PMC - PubMed

Publication types