. 2018 Apr 5;173(2):386-399.e12.
doi: 10.1016/j.cell.2018.03.027.

A Pan-Cancer Analysis of Enhancer Expression in Nearly 9000 Patient Samples

Collaborators, Affiliations

A Pan-Cancer Analysis of Enhancer Expression in Nearly 9000 Patient Samples

Han Chen et al. Cell. .

Abstract

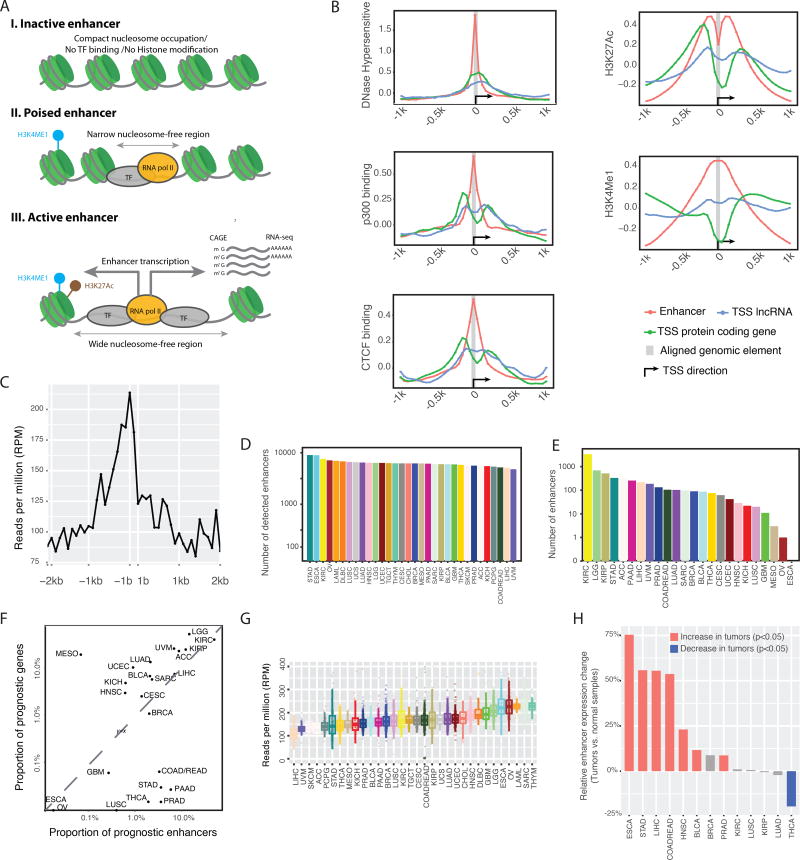
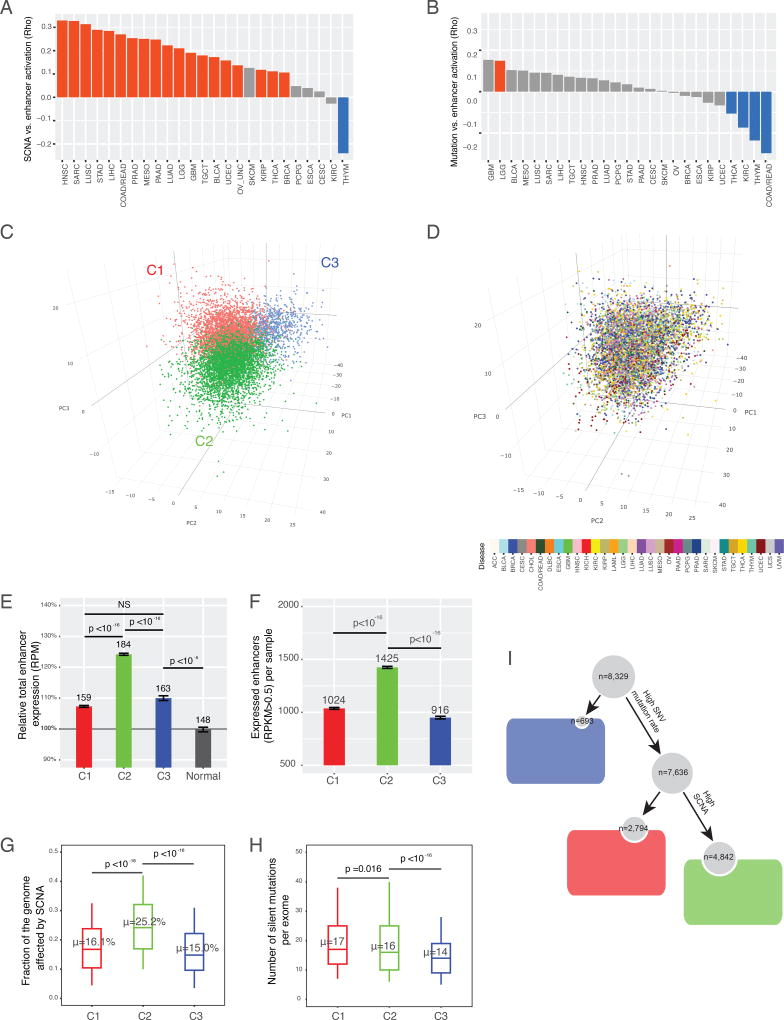
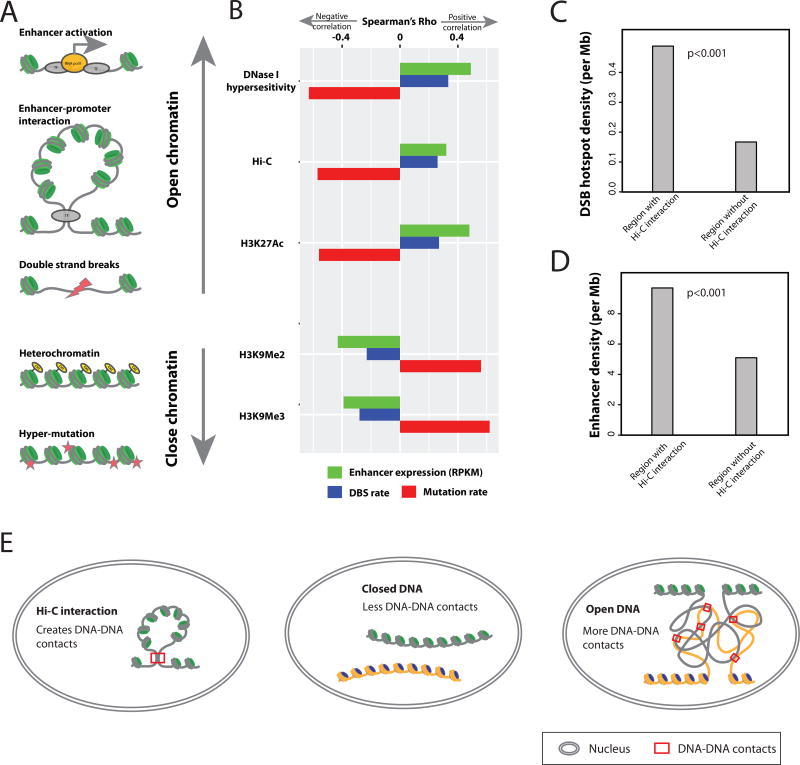
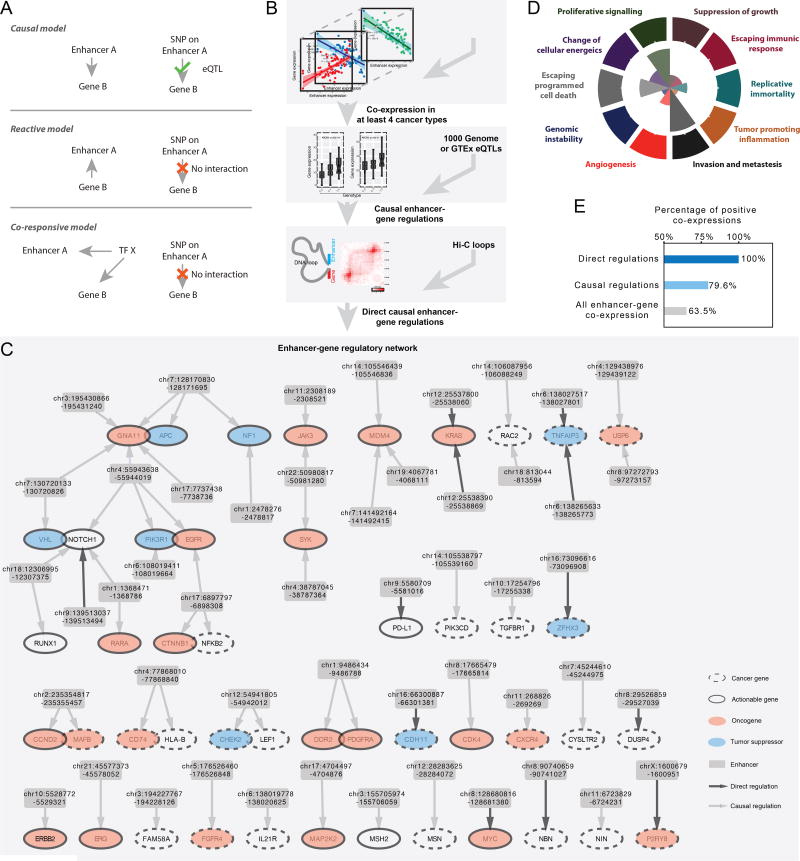
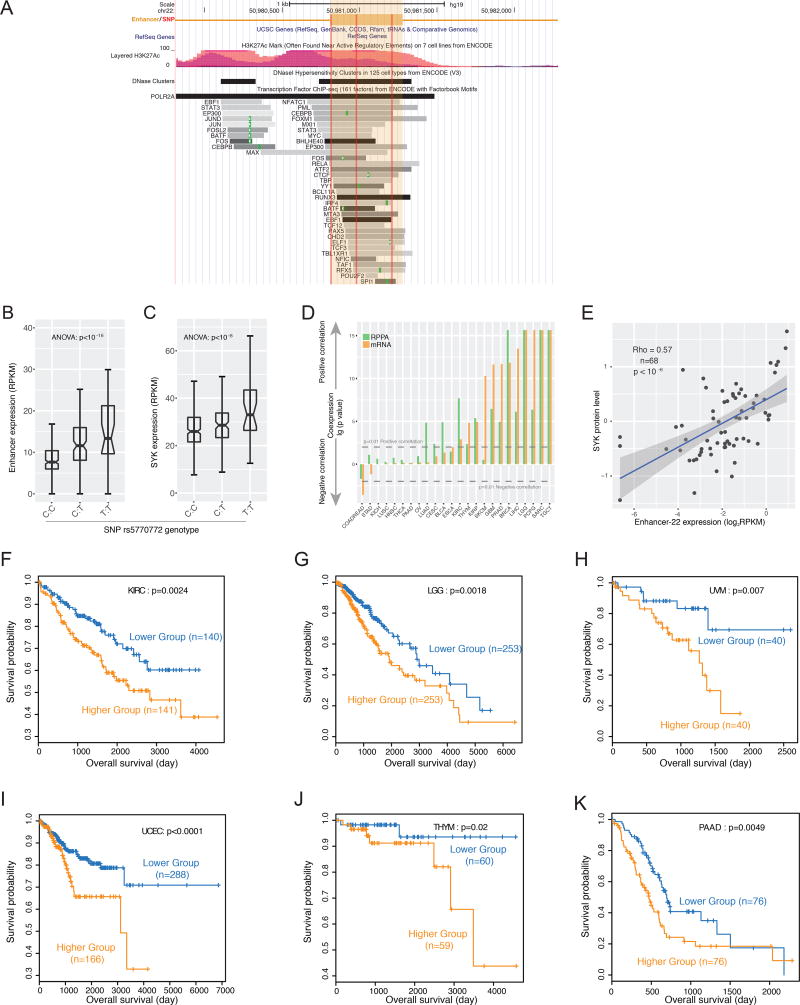
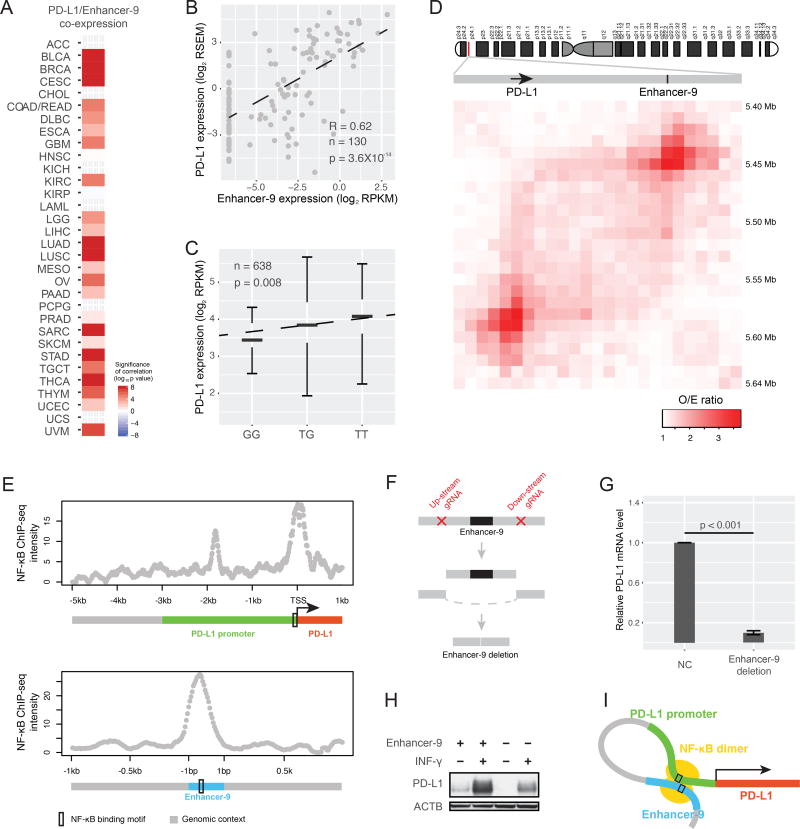
The role of enhancers, a key class of non-coding regulatory DNA elements, in cancer development has increasingly been appreciated. Here, we present the detection and characterization of a large number of expressed enhancers in a genome-wide analysis of 8928 tumor samples across 33 cancer types using TCGA RNA-seq data. Compared with matched normal tissues, global enhancer activation was observed in most cancers. Across cancer types, global enhancer activity was positively associated with aneuploidy, but not mutation load, suggesting a hypothesis centered on "chromatin-state" to explain their interplay. Integrating eQTL, mRNA co-expression, and Hi-C data analysis, we developed a computational method to infer causal enhancer-gene interactions, revealing enhancers of clinically actionable genes. Having identified an enhancer ∼140 kb downstream of PD-L1, a major immunotherapy target, we validated it experimentally. This study provides a systematic view of enhancer activity in diverse tumor contexts and suggests the clinical implications of enhancers.

Keywords: PD-L1 expression; The Cancer Genome Atlas; aneuploidy; chromatin state; enhancer expression; mutation burden; pan-cancer analysis; prognostic markers.


Figures

Figure 1
Figure 1. Overview of enhancer expression in TCGA RNA-seq data
(A) When activated, expressed enhancers may generate RNA molecules detectable by RNA-seq. (B) The chromatin status of enhancers, TSSs of protein-coding, and lncRNA genes, as well as their flanking 1-kb regions. The y-axis shows the normalized ChIP-seq signals from the ENCODE bigwig files. (C) Transcription of enhancers and their flanking 2-kb sequences detected in TCGA RNA-seq dataset. The y-axis shows the average reads per million mapped (RPM) to the nucleotide at the relative position from an enhancer, as indicated on the x-axis. Flanking sequences that overlapped with known genes were excluded from the calculation. (D) Numbers of expressed enhancers in different cancer types. An enhancer was considered as expressed in a cancer type if observed in >10% of the samples. (E) Numbers of prognostic enhancers in different cancer types. For each enhancer, its correlation with patients’ survival times in a given cancer type was calculated using Cox regression. The p-value was subjected to multiple-testing correction with FDR = 0.05 as cut-off. (F) Comparison of the proportion of prognostic enhancers and coding genes across cancer types, given the same patient cohorts and FDR cutoffs as in E above. (G) The variation in enhancer expression within and across cancer types. (H) Global enhancer activation in cancer as determined through comparison of matched tumor-normal pairs. Thirteen cancer types with >10 tumor–normal pairs were considered. The y-axis shows changes in global enhancer expression (RPMtumor/RPMnormal −1)%; statistics were performed with paired t-test. See also Figure S1.
Figure 2
Figure 2. Enhancer expression is associated with different types of genomic aberration
(A, B) Spearman’s correlation coefficient (rho) between global enhancer expression determined by RPM and (A) aneuploidy (measured as the proportion of the genome affected by SCNAs) or (B) mutation burden (measured as the number of silent exonic mutations). Significant correlations are colored. (C, D) Consensus clustering analysis identified three major enhancer expression subtypes. Within each cancer type, the log2RPKM values of 15808 enhancers were scaled to the Z-score before clustering to correct for tissue-specific patterns that would otherwise affect the clustering. Consensus clustering based on 1500 enhancers (~10%) with the highest coefficients of variation identified three major clusters. The Z-score matrix was projected onto the first three dimensions identified in principal component analysis, with colors representing the (C) three clusters or (D) cancer types. (E) Relative global enhancer expression level (RPM) of the three clusters in tumors compared with normal samples. Error bars show mean ± standard error (SE). Statistics were computed using t-test. Absolute RPM levels are shown at the top of each bar. (F) Numbers of enhancers detected in the three clusters (RPKM > 0.5). Error bars show mean ± standard error (SE). Statistics were computed using t-test. (G) Aneuploidy level in the three subtypes; sample proportions of 50% and 75% are in the box and within the limits, respectively. (H) Numbers of silent mutations in the three subtypes; sample proportions of 25% and 50% are in the box and within the limits, respectively. Kolmogorov-Smirnov p-values are shown. (I) Summary of genomic aberration profiles of the three subtypes. See also Figures S2 and S3.
Figure 3
Figure 3. A “chromatin-state”-centered mechanistic model for the interplay among enhancer activation, SCNAs, and point mutations
(A) Hypothetical impacts of chromatin state on the cancer genome. (B) Real correlations between genomic features across genomic regions. The human genome was divided into 2663 1-Mb fragments for correlation analysis. Enhancer activation level was defined as the mean RPKM of all enhancer regions within a fragment. The mutation rate and DNA double-strand break rate were calculated for each fragment using whole-genome data from COSMIC (STAR Methods). DNase hypersensitivity and histone-modifications were obtained from the ENCODE ChIP-seq dataset, and the density of DNA-DNA interactions was determined using Hi-C data (STAR Methods). Spearman’s correlation coefficients between genomic features were plotted as indicated. All correlations were of strong statistical significance (p < 10−16). (C) The top 500 10-kb human genome fragments with the highest breakpoint rates were considered as DSB hotspots, of which 204 and 296, respectively, were found inside and outside of the anchors of DNA loops detected by Hi-C. (D) The distribution of 15808 enhancers inside and outside of DNA loop anchors detected by Hi-C. (E) Hypothetical model demonstrating how chromatin opening favors DNA structural rearrangement. See also Figures S4.
Figure 4
Figure 4. Systematic identification of causal enhancer/cancer-gene interactions
(A) Three models of enhancer-gene co-expression pairs. (B) Bioinformatic method for inferring causal enhancer-gene interactions. (C) A network view for regulation of cancer genes by enhancers. Each arrow represents an interaction in the causal model in (A). (D) Number of genes in the network that contribute to the set of cancer hallmarks. (E) Number of positive enhancer-gene co-expressions in different steps of (B).
Figure 5
Figure 5. Enhancer-22 as a prognostic marker across cancer types
(A) Genomic context of enhancer-22 (chr22:50980817-50981280). (B) and (C) SNP rs5770772 is simultaneously a cis-eQTL of enhancer-22 and and trans eQTL of SYK. (D) Co-expression levels between enhancer-22 and SYK in multiple cancer types based on RNA-seq and reverse-phase protein array (RPPA) datasets; P-values calculated by Spearman’s rank correlation and Bonferroni-corrected. (E) Scatter plot showing co-expression between SYK protein level determined by RPPA and enhancer-22 expression level determined as log2RPKM. Kaplan-Meier plots for patient stratification based on enhancer-22 expression in (F) kidney renal cell clear cell carcinoma (KIRC), (G) low-grade glioma (LGG), (H) uveal melanoma (UVM), (I) uterine corpus endometrial carcinoma (UCEC), (J) thymoma (THYM), and (K) pancreatic adenocarcinoma (PAAD). P-values based on log-rank test are shown. See also Figure S5.
Figure 6
Figure 6. Enhancer-9 regulates PD-L1, a key target of immunotherapy
(A) Co-expression levels between enhancer-9 (chr9:5580709-5581016) and PD-L1 in multiple cancer types (RNA-seq); p-values for Spearman’s rank correlations were calculated and Bonferroni-corrected. (B) Scatter plot showing co-expression between PD-L1 mRNA level and enhancer-9 expression level. (C) SNP rs1536927 near enhancer 9 is a PD-L1 eQTL; p-value was calculated using ANOVA. (D) Direct interaction between PD-L1 gene body and enhancer 9 detected by Hi-C. The Hi-C O/E ratio was calculated as the median of O/E ratios of 7 human cell lines. (E) NF-κB ChIP-seq signals of enhancer-9 and the PD-L1 promoter. (F) Experimental design of sgRNA-guided enhancer perturbation by Cas9 protein. Three different sgRNAs were designed for each side of the enhancer. (G) Relative mRNA expression levels of PD-L1 in A549 cells and the same line after homozygous enhancer-9 deletion. Error bars show mean ± SE of results of 4 replicates; the difference was assessed using t-test. (H) PD-L1 protein levels in the control and enhancer-9 deletion cell lines without and with INF-γ stimulation. (I) Cartoon of NF-κB-mediated enhancer/promoter interaction for PD-L1 activation. See also Figure S6.

References

    1. 1000 Genomes Project Consortium. An integrated map of genetic variation from 1,092 human genomes. Nature. 2012;491:56–65. - PMC - PubMed
    1. Andersson R, Gebhard C, Miguel-Escalada I, Hoof I, Bornholdt J, Boyd M, Chen Y, Zhao X, Schmidl C, Suzuki T, et al. An atlas of active enhancers across human cell types and tissues. Nature. 2014;507:455–461. - PMC - PubMed
    1. Aran D, Hellman A. DNA methylation of transcriptional enhancers and cancer predisposition. Cell. 2013;154:11–13. - PubMed
    1. Blank M, Tang Y, Yamashita M, Burkett SS, Cheng SY, Zhang YE. A tumor suppressor function of Smurf2 associated with controlling chromatin landscape and genome stability through RNF20. Nature medicine. 2012;18:227–234. - PMC - PubMed
    1. Cancer Genome Atlas Research Network. Weinstein JN, Collisson EA, Mills GB, Shaw KR, Ozenberger BA, Ellrott K, Shmulevich I, Sander C, Stuart JM. The Cancer Genome Atlas Pan-Cancer analysis project. Nature genetics. 2013;45:1113–1120. - PMC - PubMed

Publication types