

Amyloid blood biomarker detects Alzheimer's disease
- PMID: 29626112
- PMCID: PMC5938617
- DOI: 10.15252/emmm.201708763
Amyloid blood biomarker detects Alzheimer's disease
Abstract
Alzheimer's disease (AD) is currently incurable, but there is general agreement that a minimally invasive blood biomarker for screening in preclinical stages would be crucial for future therapy. Diagnostic tools for detection of AD are either invasive like cerebrospinal fluid (CSF) biomarkers or expensive such as positron emission tomography (PET) scanning. Here, we determine the secondary structure change of amyloid-β (Aβ) in human blood. This change used as blood amyloid biomarker indicates prodromal AD and correlates with CSF AD biomarkers and amyloid PET imaging in the cross-sectional BioFINDER cohort. In a further population-based longitudinal cohort (ESTHER), the blood biomarker detected AD several years before clinical diagnosis in baseline samples with a positive likelihood ratio of 7.9; that is, those who were diagnosed with AD over the years were 7.9 times more likely to test positive. This assay may open avenues for blood screening of early AD stages as a funnel for further more invasive and expensive tests.
Keywords: ESTHER; Alzheimer's disease diagnosis; BioFINDER; amyloid‐β in blood plasma; immuno‐infrared‐sensor.
© 2018 The Authors. Published under the terms of the CC BY 4.0 license.
Figures
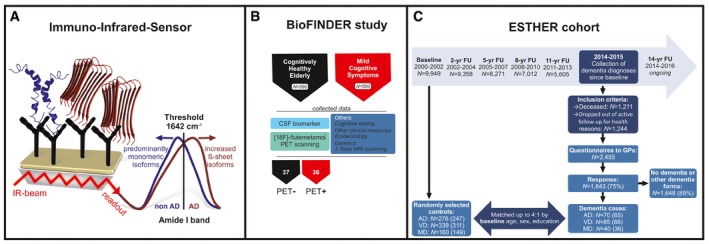
The immuno‐infrared‐sensor simultaneously monitors the secondary structure distribution of all soluble Aβ peptides in blood plasma caught by monoclonal antibodies (mAb) covalently attached to the sensor surface (schematic simplified representation; mAb A8978 is raised against the middle epitope (aa13–28) of Aβ). If the marker band (amide I) is dominated by disordered or α‐helical monomeric isoforms, the patients would be diagnosed as non‐AD (blue). If β‐sheet isoforms are enriched (red), the amide I signal is shifted below the threshold (1,642 cm−1), indicating AD.
Plasma samples from the cross‐sectional study (BioFINDER) were measured with the immuno‐infrared‐sensor and used to differentiate between 37 healthy elderly people (all PET negative) and 36 prodromal AD (MCI) patients (all PET positive). The clinical record of participants within this cohort comprised cognitive testing, CSF biomarker assessment, other clinical measures, 3 Tesla MRI, genetics, epidemiology and [18F]‐flutemetamol PET scanning.
Nested case–control study based on the ESTHER cohort study as of January 2016. Baseline blood plasma samples from the year 2000–2002 were measured in the same way as samples from the BioFINDER cohort. AD = Alzheimer's disease; VD = vascular dementia; MD = mixed dementia are investigated. Other dementia forms include frontotemporal dementia and other dementias. GPs = general practitioners; yr = year; FU = follow‐up. The number of randomly selected controls and dementia cases reflects the original study design; the measured sample sizes are depicted in brackets.
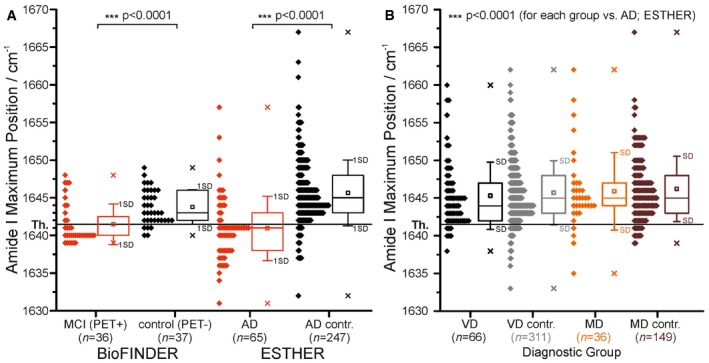
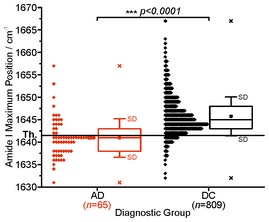
The threshold at 1,642 cm−1 (solid horizontal line) separates AD cases (MCI (PET positive), BioFINDER; AD, ESTHER) from controls (control (PET negative), BioFINDER; AD contr., ESTHER).
The threshold at 1,642 cm−1 also separates AD cases (for AD, see A) from VD, MD cases and respective controls. Only the AD group demonstrated significantly lower maxima below the threshold. Therefore, the biomarker band may provide a differential diagnosis. All diagnostic groups differed significantly (P < 0.0001) from the AD group (ESTHER).
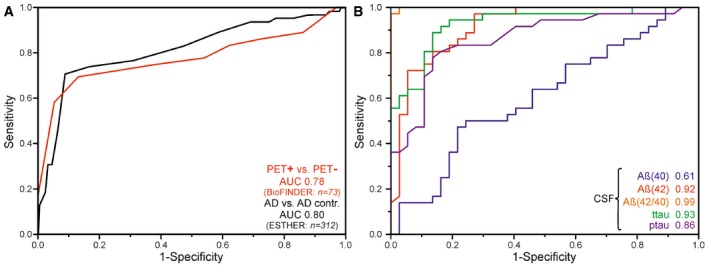
ROC curves for prodromal PET‐positive cases (n = 36) vs. healthy elderly PET‐negative subjects (n = 37) (BioFINDER) and AD (n = 65) vs. AD control (n = 247) differentiation (red) (ESTHER, Germany) were obtained by variation of the threshold frequency between 1,630.5 and 1,660.5 cm−1. An AUC of 0.78 (0.68–0.88, 95% CI) for the BioFINDER cohort and AUC of 0.80 (0.76–0.84, 95% CI) were achieved for the ESTHER cohort. Using a cut‐off (threshold) of 1,642 cm−1 as the lower limit for test negativity yielded a sensitivity of 71% at 91% specificity for the ESTHER study (black) and a sensitivity of 69% at specificity of 86% for the BioFINDER study (red).
ROC curves for prodromal PET‐positive cases and healthy elderly PET‐negative subjects differentiation (BioFINDER, Sweden) were calculated for CSF biomarkers such as Aβ(40) (blue), Aβ(42) (red), Aβ(42/40) ratio (orange), ttau (green) and ptau (pink). AUC values are presented.
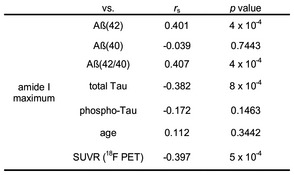
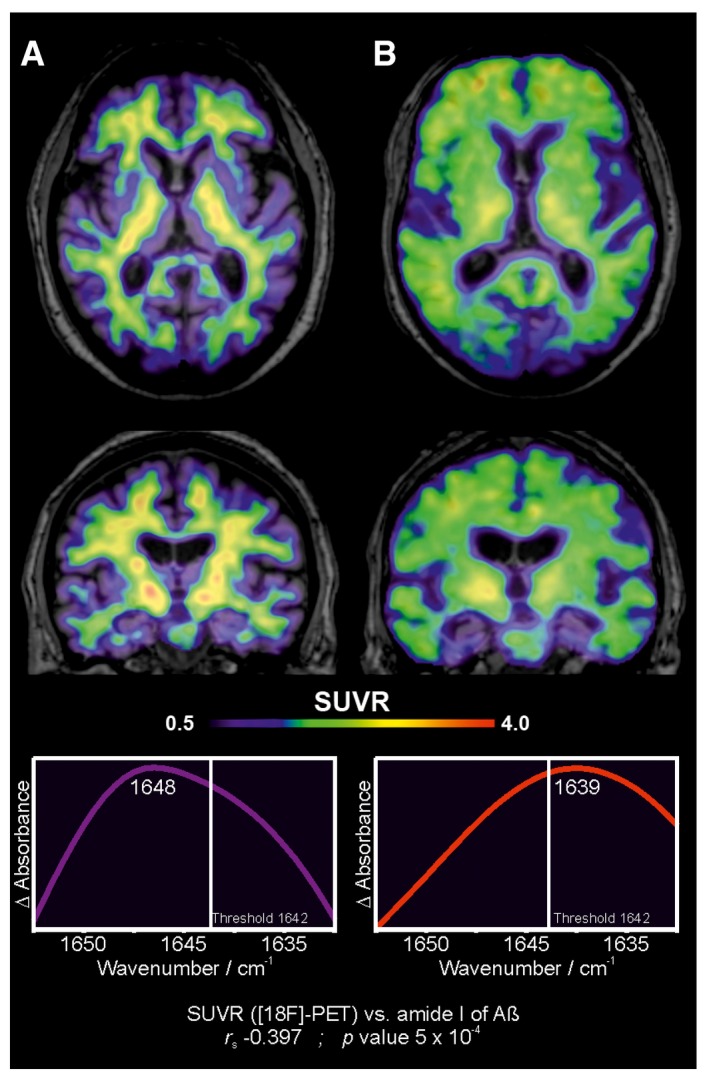
The figure depicts transaxial and coronal sections of [18F]‐flutemetamol PET scans obtained from a cognitively healthy control (BioFINDER). The PET scan shows non‐specific binding of the radioligand in the white matter. The corresponding infrared amide I band for Aβ from this patient's EDTA‐blood plasma is presented below. The PET and infrared data correlate significantly with each other (r s = −0.397, P‐value = 5 × 10⁻⁴) (see Fig EV1).
The figure depicts transaxial and coronal sections of [18F]‐flutemetamol PET scans obtained from a patient with prodromal AD (BioFINDER). The PET scan shows clearly increased cortical binding of [18F]‐flutemetamol. The corresponding infrared amide I band for Aβ from this patient's EDTA‐blood plasma is presented below. The PET and infrared data correlate significantly with each other (r s = −0.397, P‐value = 5 × 10⁻⁴) (see Fig EV1).
References
-
- Blennow K, de Leon MJ, Zetterberg H (2006) Alzheimer's disease. Lancet 368: 387–403 - PubMed
-
- Blennow K, Hampel H, Weiner M, Zetterberg H (2010) Cerebrospinal fluid and plasma biomarkers in Alzheimer disease. Nat Rev Neurol 6: 131–144 - PubMed
-
- Blennow K, Mattsson N, Schöll M, Hansson O, Zetterberg H (2015) Amyloid biomarkers in Alzheimer's disease. Trends Pharmacol Sci 36: 297–309 - PubMed
Publication types
MeSH terms
Substances
LinkOut - more resources
Full Text Sources
Other Literature Sources
Medical
