. 2018 Apr 6;9(1):1338.
doi: 10.1038/s41467-018-03648-4.

Lipid binding promotes the open conformation and tumor-suppressive activity of neurofibromin 2

Affiliations

Lipid binding promotes the open conformation and tumor-suppressive activity of neurofibromin 2

Krishna Chinthalapudi et al. Nat Commun. .

Abstract

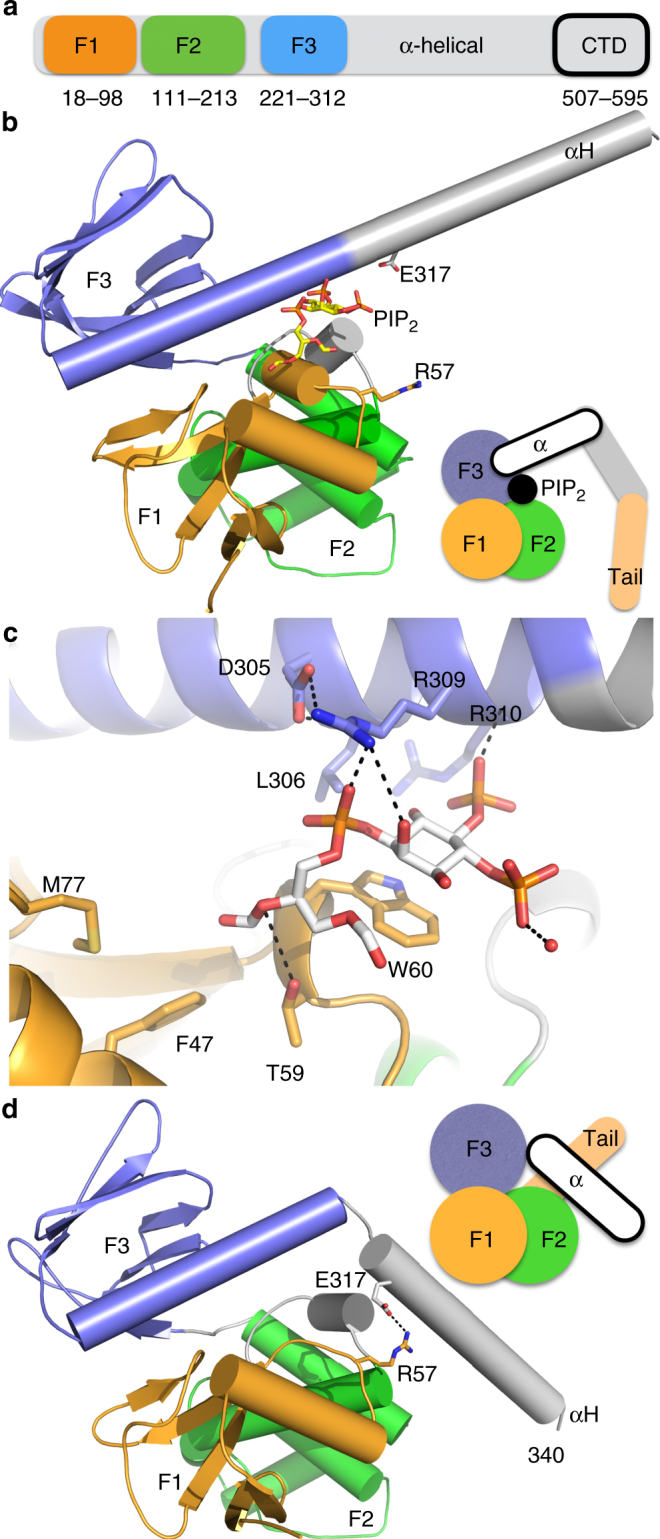
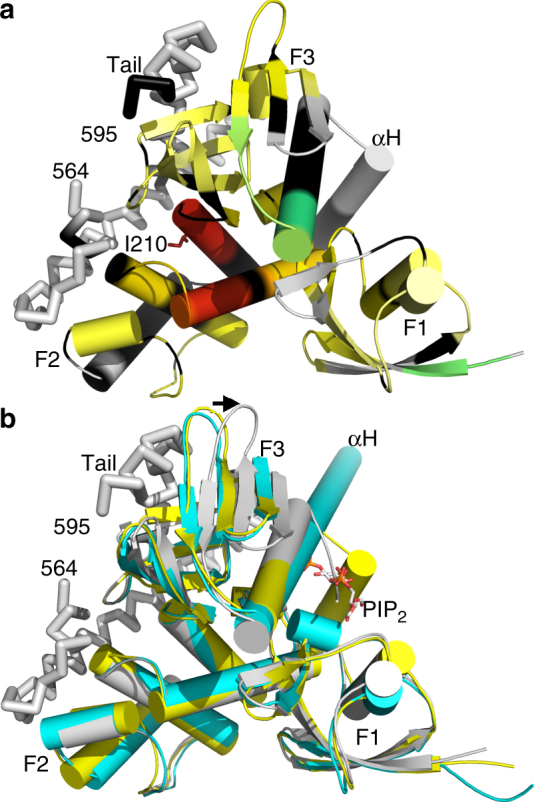
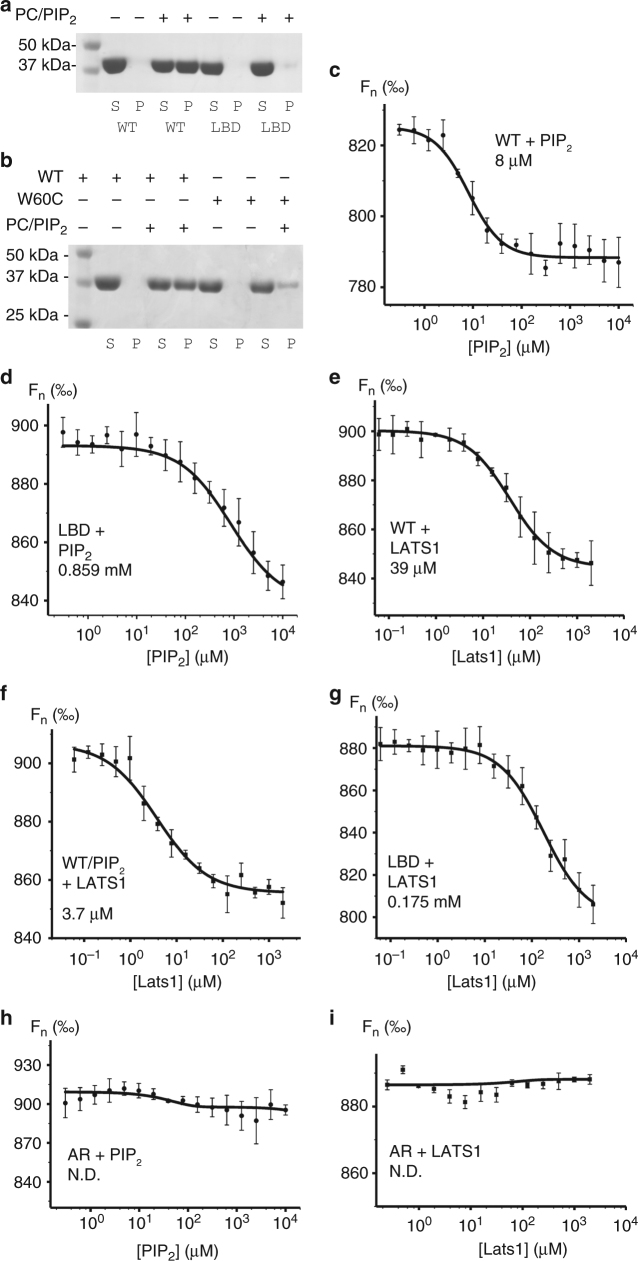
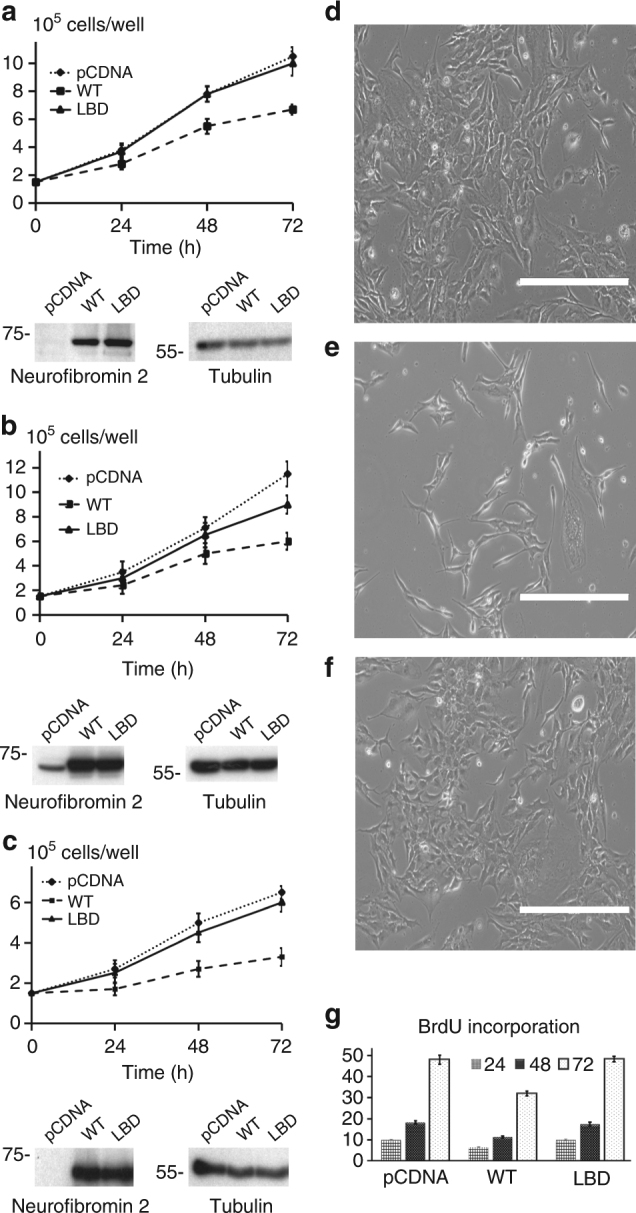
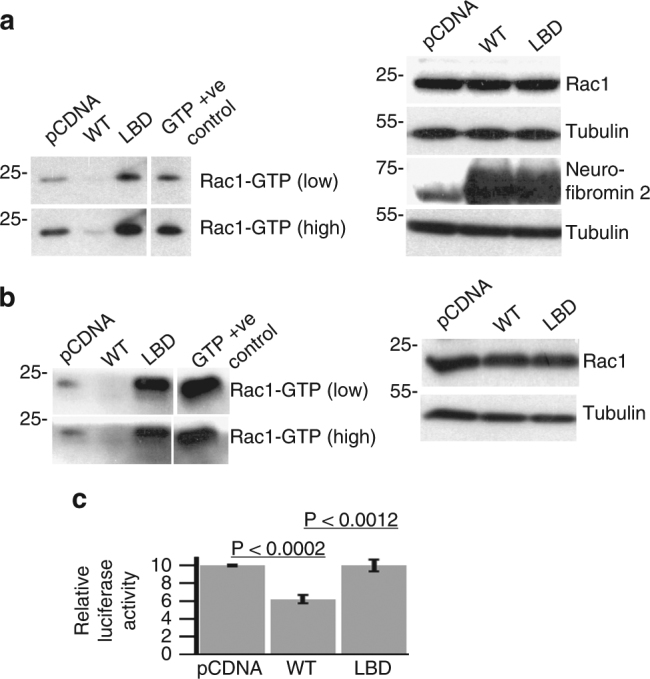
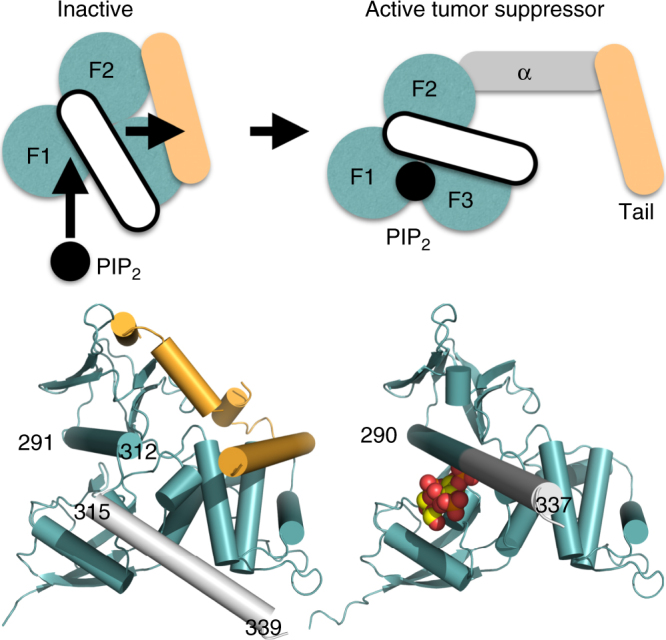
Neurofibromatosis type 2 (NF2) is a tumor-forming disease of the nervous system caused by deletion or by loss-of-function mutations in NF2, encoding the tumor suppressing protein neurofibromin 2 (also known as schwannomin or merlin). Neurofibromin 2 is a member of the ezrin, radixin, moesin (ERM) family of proteins regulating the cytoskeleton and cell signaling. The correlation of the tumor-suppressive function and conformation (open or closed) of neurofibromin 2 has been subject to much speculation, often based on extrapolation from other ERM proteins, and controversy. Here we show that lipid binding results in the open conformation of neurofibromin 2 and that lipid binding is necessary for inhibiting cell proliferation. Collectively, our results provide a mechanism in which the open conformation is unambiguously correlated with lipid binding and localization to the membrane, which are critical for the tumor-suppressive function of neurofibromin 2, thus finally reconciling the long-standing conformation and function debate.


Conflict of interest statement

The authors declare no competing interests.

Figures

Fig. 1
Fig. 1
Lipid binding to neurofibromin 2 causes major conformational changes. a Schematic depiction of the domain organization of full-length neurofibromin 2. The F1, F2, and F3 FERM subdomains and the C-terminal domain (CTD) are indicated that are connected by the central α-helical domain. b The 2.61 Å PIP2-bound neurofibromin 2 structure. The F1 subdomain (residues 18–98) is shown in light orange, F2 (residues 111–213) in green, and F3 (residues 221–312) in blue. The α-helix from the central helical domain, αH, is shown in gray (residues 315–339). The cartoon illustrates binding of PIP2 to full-length neurofibromin 2 with its head–tail interaction severed. c Close-up view of the PIP2 binding site. The carbon atoms of PIP2 are shown in gray, of the neurofibromin 2 F1 subdomain in orange, and F3 in blue. Hydrogen bonds are indicated and key binding residues are labeled. d View of the closed FERM neurofibromin 2 structure (PDB entry 1isn) in the same orientation as our lipid-bound structure shown in panel b. The electrostatic interaction between E317 OE2 and R57 NH2 is indicated (and the distance is 2.9 Å) that is severed in our lipid-bound structure shown in b. The cartoon highlights the distinct conformation of α-helix αH from the central domain
Fig. 2
Fig. 2
Hydrogen-deuterium exchange (HDX) and mass spectrometry mapping onto the neurofibromin 2 head/tail structure (PDB entry 4zrj). a Differential deuterium exchange (ΔHDX) between apo and PIP2 bound residues are color coded from red to blue with warm colors representing increased conformational dynamics (red being the relative highest D2O uptake) and cool colors representing decreased conformational dynamics (blue being the lowest D2O uptake); gray, no statistically significant changes between compared conditions; black, regions that have no sequence coverage or include prolines that have no amide hydrogen exchange activity. I210 that binds the tail domain and shows largest degree of deprotection upon binding to PIP2 is shown in sticks and labeled. The tail domain is shown as a Cα-trace. b Superposition of the apo structure (yellow) onto the head–tail (PDB entry 4zrj; gray), and PIP2-bound structures (cyan). PIP2 is shown as spheres and the tail domain as a Cα-trace. The arrow indicates the movement upon binding of the tail domain of 7.3 Å at the tip of loop (residue K279)
Fig. 3
Fig. 3
The conformation of neurofibromin 2 dictates its binding. a Lipid co-sedimentation analysis of the PIP2 binding to wild type and our lipid binding deficient mutant neurofibromin 2. wild-type neurofibromin 2 (residues 1–339) is soluble in the absence of PIP2 and pellets in the presence of PIP2. Mutant (T59V, W60E, R309Q, R310Q) neurofibromin 2 (residues 1–339) remains soluble in the absence and presence of PIP2. S supernatant, P pellet, WT wild type, LBD lipid binding deficient. b Lipid co-sedimentation analysis of the PIP2 binding to wild-type and disease-derived mutant neurofibromin 2. Wild-type neurofibromin 2 (residues 1–339) is soluble in the absence of PIP2 and pellets in the presence of PIP2. Mutant (W60C) neurofibromin 2 (residues 1–339) is soluble in the absence of PIP2, while a small fraction pellets in the presence of PIP2. S supernatant, P pellet, WT wild type. Microscale thermophoresis (MST) measurements show the binding of PIP2 to c wild-type full-length neurofibromin 2 (Kd = 8.02 ± 0.91 μM) or to d our lipid binding deficient (LBD) mutant (T59V, W60E, R309Q, R310Q; Kd = 859.23 ± 184.65 μM). MST measurements show binding of LATS1 (residues 69–100) to e wild type (Kd = 39.31 ± 4.25 μM), f the neurofibromin/PIP2 complex (Kd = 3.77 ± 0.72 μM), or g to our LBD neurofibromin 2 mutant (Kd = 175.54 ± 34.49 μM). No binding was observed for the artificially closed A585W-R588K (AR) mutants to h PIP2, or i LATS1. Error bars represent ±S.D., n = 3 (three independent measurements with the same laser power)
Fig. 4
Fig. 4
Lipid binding deficient mutants of neurofibromin 2 display impaired inhibition of cell proliferation. a SC4, b HEK293T, or c hSCλ-shNF2 cells were transfected with expression vectors for wild type and lipid binding deficient neurofibromin 2 or empty vector control (pCDNA). Total cell numbers were counted over 72 h. Means of each data point were calculated from three independent biological replicates conducted in triplicate. Error bars represent ± S.D. Immunoblot analysis was used to verify similar expression levels of the indicated neurofibromin 2 alleles. Tubulin was used as a control. The blots shown are representative of three biological replicates. For SC4 cells: difference between pCDNA and lipid binding deficient neurofibromin 2, < 0.7680 (i.e., not significant); pCDNA and wild-type neurofibromin 2, < 0.0001 (i.e., significant); lipid binding deficient and wild-type neurofibromin 2 proteins, < 0.0001 (i.e., significant). For HEK293T cells: difference between pCDNA and lipid binding deficient neurofibromin 2, <0.0013 (i.e., significant); pCDNA and wild-type neurofibromin 2, <0.0001 (i.e., significant); lipid binding deficient and wild-type neurofibromin 2 proteins, <0.0001 (i.e., significant). For hSCλ-shNF2 cells: difference between pCDNA and lipid binding deficient neurofibromin 2, <0.2476 (i.e., not significant); pCDNA and wild-type neurofibromin 2, <0.0001 (i.e., significant); the lipid binding deficient and wild-type neurofibromin 2 proteins, <0.0001 (i.e., significant). Scalebar size is 400 μm. df Phase contrast microscopy images, taken at the 72 h time point, of SC4 cells that were used in the BrdU cell proliferation assay. SC4 cells transfected with d pCDNA, e neurofibromin 2, and f the neurofibromin 2 lipid binding deficient mutant. g Cells expressing lipid binding deficient mutants of neurofibromin 2 display impaired inhibition of BrdU incorporation. SC4 cells were transfected with expression vectors for wild type and lipid binding deficient neurofibromin 2 or empty vector control (pCDNA) and BrdU incorporation was assessed over 72 h. Means of each data point were calculated from three independent biological replicates conducted in triplicate. Error bars represent ± S.D. Difference between pCDNA and our lipid binding deficient mutant neurofibromin 2, <1.0000 (i.e., not significant); pCDNA and wild-type neurofibromin 2, <0.000 (i.e., significant); wild type and our lipid binding deficient mutant, <0.0001 (i.e., significant)
Fig. 5
Fig. 5
The lipid binding deficient mutant of neurofibromin 2 displays impaired inhibition of Rac1 activation and YAP activity. a 293 T or b SC4 cells were transfected with expression vectors for wild type or lipid binding deficient neurofibromin 2 or empty vector control (pCDNA) and levels of active Rac1 (Rac1-GTP) were assessed after 48 h. Levels of total Rac1, neurofibromin 2, and tubulin were assessed as controls. The blots shown are representative of three biological replicates. c HEK293T cells were transfected with expression vectors for wild type or lipid binding deficient neurofibromin 2 or empty vector control (pCDNA) along with YAP-driven luciferase and Renilla luciferase reporters. Activity of the luciferase reporter was assessed 24 h post transfection. Means of each data point were calculated from three independent biological replicates conducted in triplicate. Error bars represent ± S.D
Fig. 6
Fig. 6
Activation of the neurofibromin 2 tumor-suppressive function. In its inactive state, neurofibromin 2 is in a closed conformation through interactions of the FERM domain (teal; F1, residues 18–98; F2, residues 111–213; F3, residues 220–312) and the tail domain (pale orange). The α-helix C-terminal of F3 (residues 315–339; white) does not interact with the tail domain. PIP2 binds to F1 and the last α-helix (residues 291–312; not depicted) of F3, thereby causing the last F3 α-helix (residues 291–312) and the following α-helix αH (residues 315–339) to rearrange as one long and continuous α-helix (residues 290–337), thereby displacing the tail domain and severing the head–tail interaction which results in active tumor suppressor functions. The central α-helical domain is shown in gray. The head/tail neurofibromin 2 crystal structure (head structure from PDB entry 1isn; tail structure from PDB entry 4zrj) is shown below the schematic on the bottom left and our PIP2-bound structure on the bottom right

References

    1. Evans DG. Neurofibromatosis type 2 (NF2): a clinical and molecular review. Orphanet J. Rare Dis. 2009;4:16. doi: 10.1186/1750-1172-4-16. - DOI - PMC - PubMed
    1. Asthagiri AR, et al. Neurofibromatosis type 2. Lancet. 2009;373:1974–1986. doi: 10.1016/S0140-6736(09)60259-2. - DOI - PMC - PubMed
    1. Trofatter JA, et al. A novel moesin-, ezrin-, radixin-like gene is a candidate for the neurofibromatosis 2 tumor suppressor. Cell. 1993;75:826. doi: 10.1016/0092-8674(93)90501-G. - DOI - PubMed
    1. Xu HM, Gutmann DH. Merlin differentially associates with the microtubule and actin cytoskeleton. J. Neurosci. Res. 1998;51:403–415. doi: 10.1002/(SICI)1097-4547(19980201)51:3<403::AID-JNR13>3.0.CO;2-7. - DOI - PubMed
    1. Cooper J, Giancotti FG. Molecular insights into NF2/Merlin tumor suppressor function. FEBS Lett. 2014;588:2743–2752. doi: 10.1016/j.febslet.2014.04.001. - DOI - PMC - PubMed

Publication types

Substances