. 2018 Apr 6;9(1):1332.
doi: 10.1038/s41467-018-03717-8.

A giant amphipathic helix from a perilipin that is adapted for coating lipid droplets

Affiliations

A giant amphipathic helix from a perilipin that is adapted for coating lipid droplets

Alenka Čopič et al. Nat Commun. .

Abstract

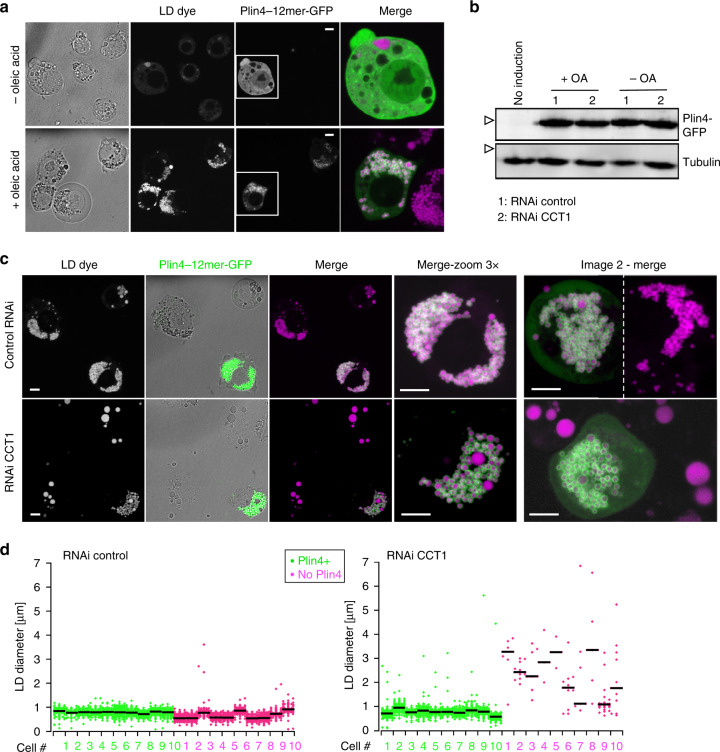
How proteins are targeted to lipid droplets (LDs) and distinguish the LD surface from the surfaces of other organelles is poorly understood, but many contain predicted amphipathic helices (AHs) that are involved in targeting. We have focused on human perilipin 4 (Plin4), which contains an AH that is exceptional in terms of length and repetitiveness. Using model cellular systems, we show that AH length, hydrophobicity, and charge are important for AH targeting to LDs and that these properties can compensate for one another, albeit at a loss of targeting specificity. Using synthetic lipids, we show that purified Plin4 AH binds poorly to lipid bilayers but strongly interacts with pure triglycerides, acting as a coat and forming small oil droplets. Because Plin4 overexpression alleviates LD instability under conditions where their coverage by phospholipids is limiting, we propose that the Plin4 AH replaces the LD lipid monolayer, for example during LD growth.


Conflict of interest statement

The authors declare no competing interests.

Figures

Fig. 1
Fig. 1
Plin4 contains a very long AH that localizes to LDs. a Schematic diagrams of human proteins with long AH regions (pink). In the proteins of the perilipin family (Plin1–5), CTP:Phosphocholine Cytidylyltransferase α (CCTα) and α-synuclein, in which the AH region contains 11-mer repeats, the corresponding bars are segmented to indicate the approximate repeat number. In Plin4, these repeats are remarkably conserved at the level of 33-mers. All perilipins also contain a predicted 4-helix bundle (blue), which has been crystalized in Plin3. b Helical wheel plot of one 33-mer repeat from Plin4, plotted as a 3–11 helix. c Weblogo generated from an alignment of 29 33-mer repeats from human Plin4 sequence. d Schematic representation of human Plin4. Position and length of different Plin4 constructs is also shown. e Localization of Plin4-AH-mCherry constructs of different length in HeLa cells (upper panels). Lower panels show colocalization of Plin4-AH (magenta) and LDs stained with Bodipy (green). Scale bar: 10 µm. f Quantification of the mean fraction of LDs stained with Plin4-AH per cell in HeLa cells. 40–60 cells in two independent experiments were quantified for each construct. Error bars depict s.e.m. from one experiment (the range between the two experiments is smaller than this error bar). g Localization of Plin4-4mer and Plin4-12mer GFP fusions in yeast. Lipid droplets are marked with Erg6-RFP. Scale bar: 5 µm
Fig. 2
Fig. 2
Hydrodynamic and secondary structure analysis of Plin4 AH fragments. a Elution profiles of the 4mer, 12mer, and 20mer fragments of Plin4 on a Superose 12 column. The black arrowheads indicate the elution volumes of protein standards of defined Stoke’s radii, which were used to calibrate the column. The indicated fractions were analyzed by SDS-PAGE with Sypro Orange staining. The white arrowheads indicate the migration of molecular weight (MW) standards on the gels. b Plot of the apparent Stoke’s radius vs MW for Plin4-4mer, 12mer, and 20mer (white circles) and protein standards (black circles) as determined from the chromatograms shown in a. The Stoke’s radius of the Plin4 fragments is about twofold higher than that of folded proteins of similar MW. c CD analysis of the Plin4 fragments. The spectra were acquired either in buffer (dashed gray lines) or in an equal volume of buffer and trifluoroethanol (black lines). PLIN4 concentration: 4mer, 19 µM; 8mer, 7.5 µM; 20mer, 4 µM
Fig. 3
Fig. 3
Influence of AH hydrophobicity on the selective targeting of Plin4 to LDs. a Helical wheel depicting cumulative mutations in the hydrophobic face of a Plin4 33-mer. The plot shows the hydrophobicity and hydrophobic moment of each mutant as calculated using Heliquest. bd Analysis of the mutants in the context of the Plin4-4mer in HeLa cells described in a. For example, the 2T→V mutant corresponds to a construct containing four identical 33mer repeats with two threonine to valine substitutions per repeat. All constructs were expressed as mCherry fusions. b Representative examples with large image showing mCherry staining and insets showing merge between the mCherry signal and the LD dye Bodipy. c Fraction of LDs per cell positive for the indicated Plin4 construct. d Quantification of maximum fluorescence on LDs, maximum fluorescence in the cytoplasm (excluding LDs), and mean fluorescence in the nuclear area for each Plin4 construct. 30–40 cells per experiment were quantified for each construct, and the error bars depict the range of means between two independent experiments. e At higher expression level, the 2T→V (not shown) and 3T→V mutants strongly stain the ER network in addition to LDs. In contrast, LD staining is similar between cells with different level of Plin4 expression. Scale bar: 10 µm
Fig. 4
Fig. 4
Influence of AH charge on the selective targeting of Plin4 to LDs. a Helical wheels depicting the mutations that were introduced into Plin4 33mer. In this series, charged residues in the polar face were mutated, and the hydrophobic face was either kept intact or modified with the previously characterized 2T→V mutation (Fig. 3). Charge-swap mutant is abbreviated as ‘csw’. The plot shows the hydrophobicity and hydrophobic moment of each mutant as calculated using Heliquest. b Representative images of the mutants expressed as mCherry fusions in HeLa cells LDs were stained with Bodipy. All mutants were prepared as identical 4-mer repeats. Scale bar: 10 µm. c Quantification of HeLa images, showing % of LDs per cell positive for the indicated Plin4 construct. 30–40 cells per experiment were quantified for each construct and the error bars depict the range of means between two independent experiments. Two sets of mutants were analyzed at different times in the project and are therefore presented on separate plots. d Representative images of the mutants expressed as GFP fusions in budding yeast. LDs were marked with Erg6-RFP. For consistency, the colors of the yeast images are inverted. Scale bar: 5 µm
Fig. 5
Fig. 5
Plin4 AH is not adapted to classical phospholipid bilayers. a Principle of the assay. Plin4 fragments labeled with NBD were mixed with liposomes and their membrane association was determined by measuring the increase in NBD fluorescence. b Typical measurements. NBD-Plin4-4mer or the 2T→V mutant were mixed with liposomes containing PC, phosphatidylethanolamine (PE), and cholesterol (50/17/33 mol%). The acyl chains of PC and PE varied from C16:0-C18:1 to C18:1-C18:1 as indicated. The spectra in solution or with diphytanoyl-PS liposomes are also shown. These spectra were used to calculate % binding for each construct (Methods). cf Effect of phospholipid unsaturation, PS, membrane curvature, and DOG on liposome binding of the indicated constructs as determined from experiments similar to b. The liposome composition (mol%) was: c PC (50), PE (17) and cholesterol (33) with an increasing fraction of C18:1-C18:1 at the expense of C16:0-C18:1 phospholipids; d C16:0-C18:1-PE (17), cholesterol (33) and an increasing fraction of C16:0-C18:1-PS (0 to 50) at the expense of C16:0-C18:1-PC (50–0); e C16:0-C18:1-PC (30), C16:0-C18:1-PS (20) C16:0-C18:1-PE (17) and cholesterol (33). The liposomes were extruded with polycarbonate filters of decreasing pore radius and the liposome radius was determined by dynamic light scattering; f C16:0-C18:1-PE (17), cholesterol (33) and an increasing fraction of DOG (0 to 15) at the expense of C16:0-C18:1-PC (50 to 35). g Influence of AH length on binding to diphytanoyl lipids. Liposomes contained PC (50), PE (17), and cholesterol (33) with an increasing fraction of diphytanoyl at the expense of C16:0-C18:1 phospholipids. h CD spectra of Plin4-20mer in solution or with increasing amounts of diphytanoyl-PS liposomes. Inset: titration of the CD signal at at 222 nm as a function of liposome concentration. Data shown in c, d, and g are means ± s.e.m. from three independent experiments; ef show the results of two independent experiments
Fig. 6
Fig. 6
Plin4 interacts directly with neutral lipids in vitro forming oil droplets. a Images of tubes in which a drop of triolein (10 µl) was vigorously mixed with a solution (190 µl) of increasing concentration of Plin4-12mer. b Representative image of the Plin4-oil emulsion by negative staining electron microscopy. Scale bar: 0.5 µm. c, d Dynamic light scattering measurement of the size distribution of an aliquot withdrawn from the middle of the oil emulsion obtained with 0.5 mg ml−1 Plin4-12mer, and comparison between three independent experiments, with dots representing peak maxima and vertical bars representing polydispersity. e Plin4-oil emulsion was visualized by confocal fluorescence microscopy. Unlabeled Plin4-12mer (0.3 mg ml−1) was mixed Plin4-12mer-Alexa568 at a ratio 20:1 (magenta), and oil was stained with Bodipy (green). Left panel shows Plin4 and right panels show zoom-ins of merged images. Scale bars: 5 µm. f Plin4 in the oil emulsion is protected from degradation by trypsin. Plin4-12mer (1 mg ml−1) was incubated in buffer only or vortexed with triolein as in a, then digested with 13 µg ml−1 (×1) or 130 µg ml−1 (×10) trypsin for the amount of time indicated. Samples were analyzed by SDS-PAGE with Sypro Orange staining. Five times less sample was loaded in the 0 min controls than in the other lanes. White arrowheads indicate the migration of molecular weight standards. Asterisks indicate the trypsin band. g, h Plin4-12mer (1 mg ml−1) before (solution) or after (emulsion) the reaction depicted in (a) was mixed with sucrose and loaded on the bottom of a sucrose gradient. After centrifugation, four fractions were collected from the bottom and equal volumes were analyzed by SDS-PAGE with Sypro Orange staining. See Supplementary Fig. 7 for uncropped gels in fh. i Model of a Plin4-12mer-covered oil droplet, drawn to scale. Calculation (see main text) suggests complete coverage of the oil surface by Plin4 AH
Fig. 7
Fig. 7
Plin4 AH expression in Drosophila S2 cells rescues the defect in LD size due to PC depletion. a Plin4-12mer-GFP localizes to LDs. Expression was induced with copper for 48 h. For the last 24 h, cells were either supplemented with oleic acid to induce LDs (+OA) or were kept in normal growth medium (−OA). LDs were stained with Autodot dye. Images were obtained with a spinning disc microscope and are presented as projected z-stacks. The merged images show a ×3 zoom of the area marked in the Plin4 images with LDs in magenta and Plin4 in green. Scale bar: 5 µm. b Western blot analysis of Plin4-12mer-GFP expression in non-induced cells (no copper addition, lane 1), or in copper-induced cells (lanes 2–5) that were subjected to the indicated treatments. Plin4-12mer levels were not affected by oleic acid treatment or by RNAi against CCT1 (c). Tubulin was used as loading control (uncropped membranes in Supplementary Fig. 7). White arrowheads indicate the migration of 70 kDa and 55 kDa molecular weight standards, respectively. c, d Cells were treated with RNAi against CCT1 to deplete PC or with control RNAi, followed by Plin4-12mer-GFP induction and oleic acid treatment; c images show a comparison of LD size between Plin4-transfected and non-transfected cells in the same field, with enlarged images of the merged channels; d graphs show quantification of LD size in individual cells in a representative of three experiments (shown in Supplementary Fig. 6b, c), with bars depicting median values

References

    1. Krahmer N, Farese RV, Jr, Walther TC. Balancing the fat: lipid droplets and human disease. EMBO Mol. Med. 2013;5:973–983. doi: 10.1002/emmm.201100671. - DOI - PMC - PubMed
    1. Pol A, Gross SP, Parton RG. Biogenesis of the multifunctional lipid droplet: lipids, proteins, and sites. J. Cell. Biol. 2014;204:635–646. doi: 10.1083/jcb.201311051. - DOI - PMC - PubMed
    1. Welte MA. Expanding roles for lipid droplets. Curr. Biol. 2015;25:R470–R481. doi: 10.1016/j.cub.2015.04.004. - DOI - PMC - PubMed
    1. Thiam AR, Farese RV, Jr, Walther TC. The biophysics and cell biology of lipid droplets. Nat. Rev. Mol. Cell Biol. 2013;14:775–786. doi: 10.1038/nrm3699. - DOI - PMC - PubMed
    1. Wang CW. Lipid droplet dynamics in budding yeast. Cell Mol. Life. Sci. 2015;72:2677–2695. doi: 10.1007/s00018-015-1903-5. - DOI - PMC - PubMed

Publication types

MeSH terms