Random forest based classification of alcohol dependence patients and healthy controls using resting state MRI
- PMID: 29626649
- PMCID: PMC5960433
- DOI: 10.1016/j.neulet.2018.04.007
Random forest based classification of alcohol dependence patients and healthy controls using resting state MRI
Abstract
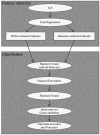
Currently, classification of alcohol use disorder (AUD) is made on clinical grounds; however, robust evidence shows that chronic alcohol use leads to neurochemical and neurocircuitry adaptations. Identifications of the neuronal networks that are affected by alcohol would provide a more systematic way of diagnosis and provide novel insights into the pathophysiology of AUD. In this study, we identified network-level brain features of AUD, and further quantified resting-state within-network, and between-network connectivity features in a multivariate fashion that are classifying AUD, thus providing additional information about how each network contributes to alcoholism. Resting-state fMRI were collected from 92 individuals (46 controls and 46 AUDs). Probabilistic Independent Component Analysis (PICA) was used to extract brain functional networks and their corresponding time-course for AUD and controls. Both within-network connectivity for each network and between-network connectivity for each pair of networks were used as features. Random forest was applied for pattern classification. The results showed that within-networks features were able to identify AUD and control with 87.0% accuracy and 90.5% precision, respectively. Networks that were most informative included Executive Control Networks (ECN), and Reward Network (RN). The between-network features achieved 67.4% accuracy and 70.0% precision. The between-network connectivity between RN-Default Mode Network (DMN) and RN-ECN contribute the most to the prediction. In conclusion, within-network functional connectivity offered maximal information for AUD classification, when compared with between-network connectivity. Further, our results suggest that connectivity within the ECN and RN are informative in classifying AUD. Our findings suggest that machine-learning algorithms provide an alternative technique to quantify large-scale network differences and offer new insights into the identification of potential biomarkers for the clinical diagnosis of AUD.
Keywords: Alcohol dependence; Functional connectivity; ICA; Resting state; fMRI.
Copyright © 2018 Elsevier B.V. All rights reserved.
Conflict of interest statement
All authors acknowledge that there is no conflict of biomedical financial interests in performing this study or in preparing this manuscript.
Figures


References
Publication types
MeSH terms
Grants and funding
LinkOut - more resources
Full Text Sources
Other Literature Sources
Medical
Miscellaneous

