. 2018 Jul:115:115-126.
doi: 10.1016/j.nbd.2018.03.014. Epub 2018 Apr 5.

Poloxamer 188 decreases membrane toxicity of mutant SOD1 and ameliorates pathology observed in SOD1 mouse model for ALS

Affiliations

Poloxamer 188 decreases membrane toxicity of mutant SOD1 and ameliorates pathology observed in SOD1 mouse model for ALS

Jacob J Riehm et al. Neurobiol Dis. 2018 Jul.

Abstract

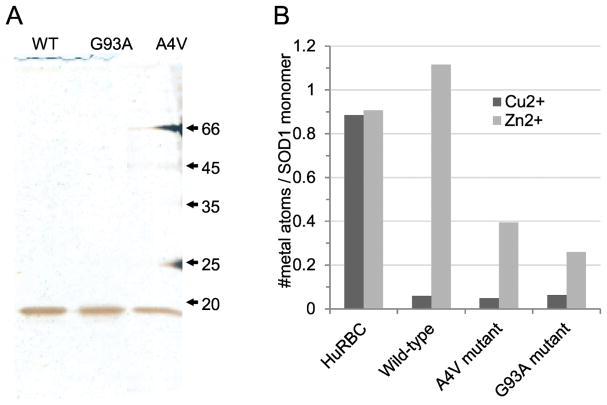
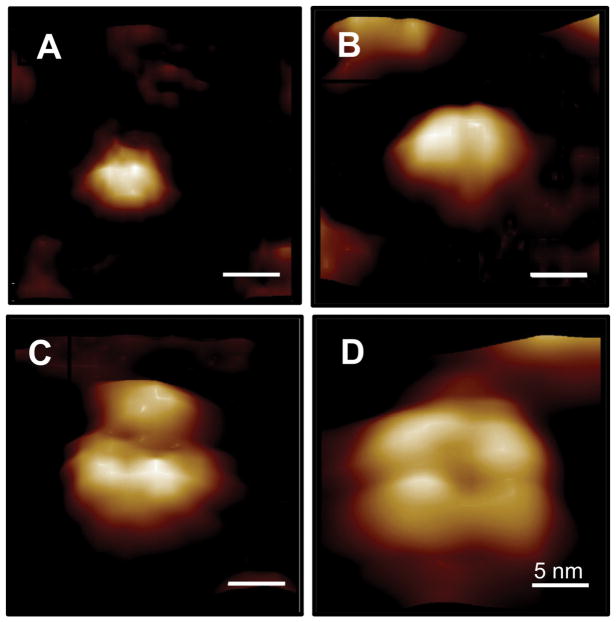
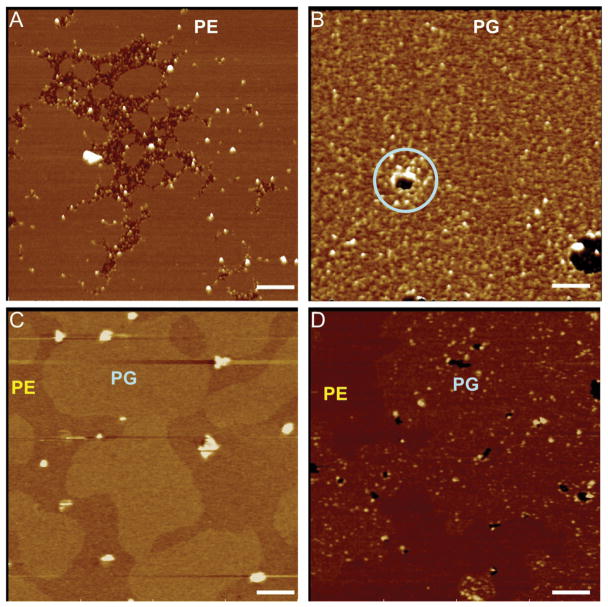
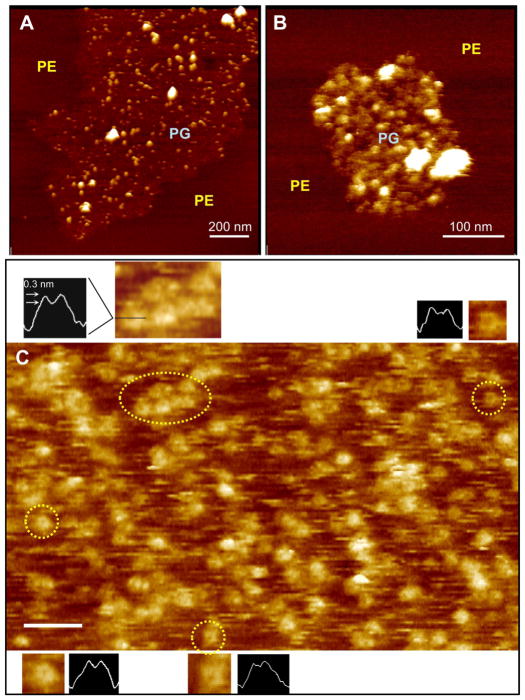
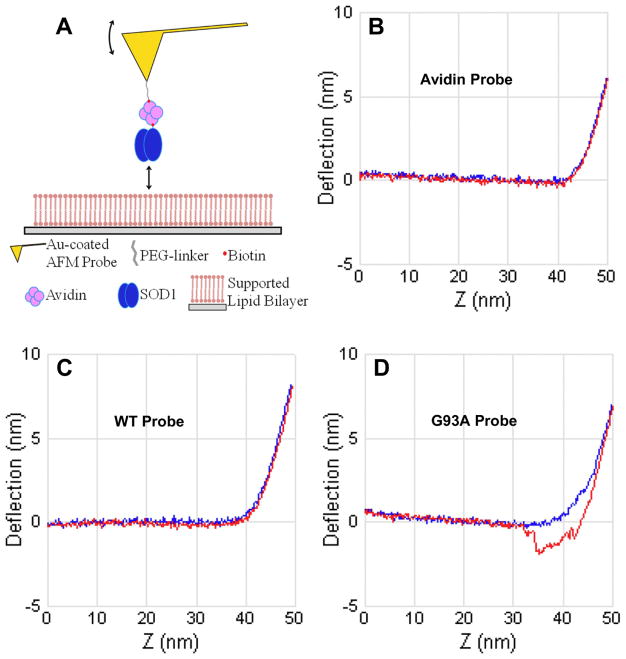
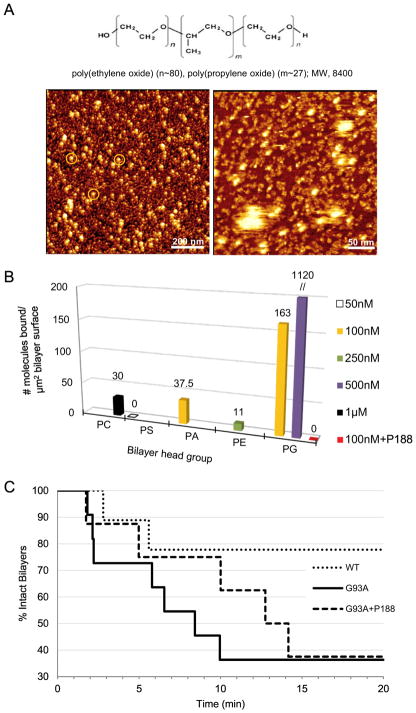
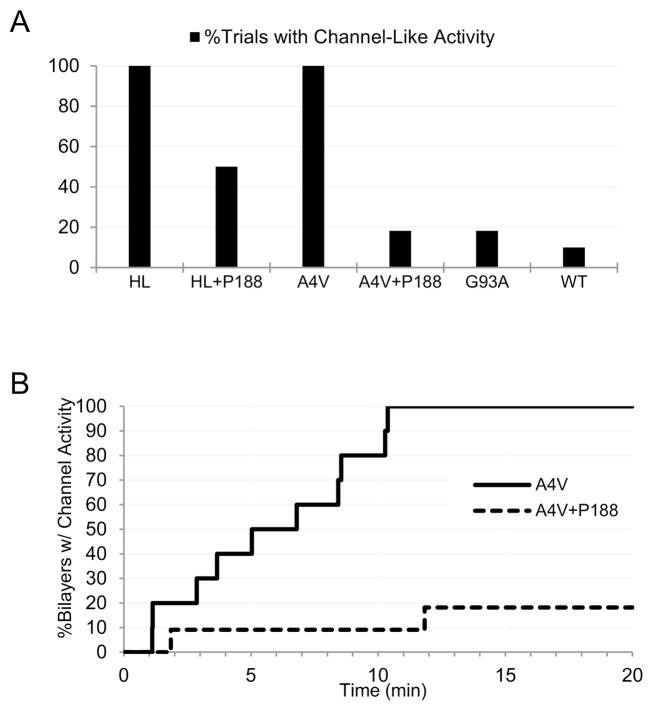
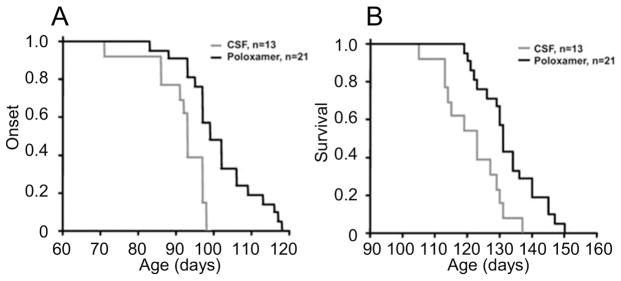
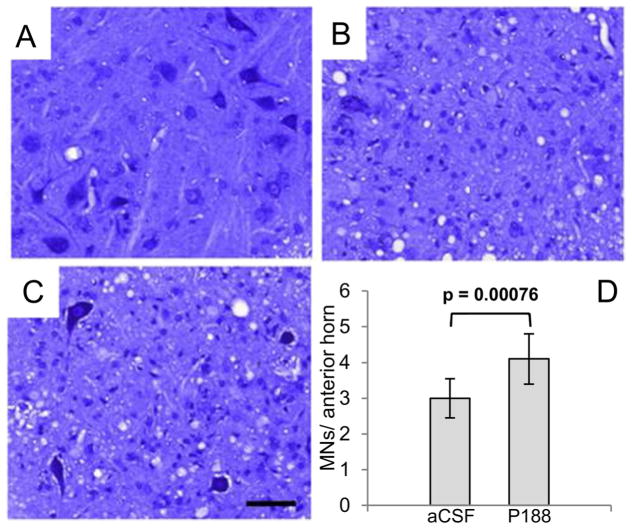
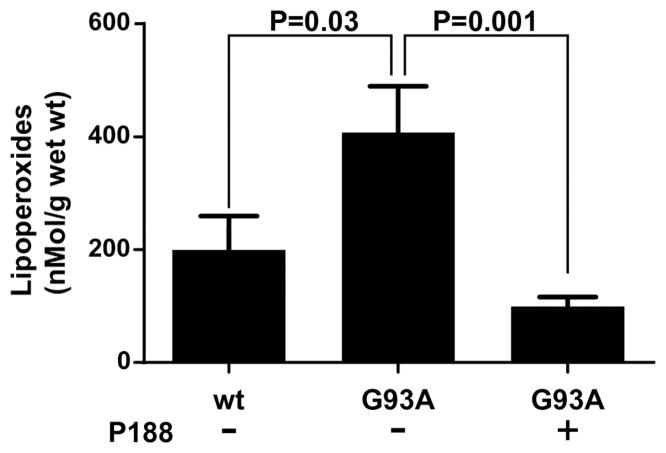
Here we report a gain in function for mutant (mt) superoxide dismutase I (SOD1), a cause of familial amyotrophic lateral sclerosis (FALS), wherein small soluble oligomers of mtSOD1 acquire a membrane toxicity. Phosphatidylglycerol (PG) lipid domains are selectively targeted, which could result in membrane damage or "toxic channels" becoming active in the bilayer. This PG-selective SOD1-mediated membrane toxicity is largely reversible in vitro by a widely-available FDA-approved surfactant and membrane-stabilizer P188. Treatment of G93ASOD1 transgenic mice with P188 significantly delayed symptoms onset, extended survival and decreased motoneuron death. The use of P188 or an analogue, which targets mtSOD1 misfolding-induced membrane toxicity, may provide a new direction for ALS treatment.

Keywords: AFM; ALS; Atomic force microscopy; Electrophysiology; F68; G93A; Lipid peroxidation; Membrane toxicity; P188; Poloxamer; Protein misfolding; SOD1; Superoxide dismutase.


Conflict of interest statement

Conflict of Interest: There are no conflicts for the authors regarding any aspect of the work represented in this manuscript.

Figures

Figure 1
Figure 1
(A) Silver-stained SDS-PAGE gel of the purified recombinant human SOD1s: WT, wild type SOD1; G93A, G93ASOD1; A4V, A4VSOD1 (mobility in kD). (B) Inductively-coupled plasma mass spectrometric copper and zinc metal analyses per SOD1 monomer of SOD1 and human erythrocyte SOD1 control, HuRBC.
Figure 2
Figure 2
HRF-AFM molecular diameters and topographies of the small soluble oligomeric species of lipid-free G93ASOD1 in HBS buffer pH 7.4. (A) monomer (4.1 ± 0.14 nm, n=20), (B) dimer (6.8 ± 0.15 nm, n=20), (C) tri-lobe (8.1 ± 0.32 nm, n=20), (D) tetramer (13.6 ± 0.31 nm, n=7). Full scale z-axis, 4 nm. Bar, 5 nm.
Figure 3
Figure 3
HRF-AFM shows small soluble oligomers of G93ASOD1 bind and damage bilayers composed of PG head groups, but not those of PE. Scans were performed before and after a 100 nM solution of G93ASOD1 protein was incubated 15 min atop the bilayers: (A) PE, where G93ASOD1 binding is seen only between unfused PE bilayers; (B) PG, where G93ASOD1 binds readily and locally damages the membrane (lt. blue circle); (C) 9:1 (w/w) PG:PE mixed bilayer, where no protein has been added, a 5 Å height difference exists between the two bilayers; (D) 9:1 (w/w) PG:PE mixed bilayer, where 100 nM G93ASOD1 protein is added and selectively binds PG subdomains. Full scale z-axis, 10 nm. Bar, 200 nm.
Figure 4
Figure 4
HRF-AFM of untreated G93ASOD1 bound to PG membrane reveals tetramer-sized assemblies, in some cases, assuming “open” channel-like conformations. (A,B) Lipid raft-like PG subdomains surrounded by PE with selectively bound untreated G93ASOD1 molecules of a size consistent with tetrameric structuring (12–15 nm). The membrane-bound G93ASOD1 oligomers (diameter of smaller white bumps 13.5 nm ± 0.4, n=20) co-adsorbed with larger aggregates (larger brighter structures) bound only to the PG subdomains. (C) High magnification HRF-AFM scan reveals tetramer-sized G93ASOD1 bound to DOPG bilayer in aqueous buffer. The locations representing four pairs of figure insets enlarged to show more detail, including cross sectional line traces through the centers of each structure (dotted yellow circles, insets, and black horizontal line in top left inset). Note the small circular darkened areas or depressions at the centers of many of the tetramer-sized structures (insets; approximately 5–8 nm across, 0.3 nm deep) indicating “open” channel-like structures that have inserted into the membrane. Full scale z-axis, 5 nm. Bar, 50 nm.
Figure 5
Figure 5
Single-molecule interfacial force spectroscopy measures the nanoscale unbinding force from a PG membrane surface of G93ASOD1 compared to WTSOD1. (A) Schematic of the fabricated nanoprobe. To measure unbinding, the nanoprobe is extended into controlled soft contact with the PG bilayer surface and the bending of the integrated microcantilever is monitored during controlled withdrawal. Forces down to ~50 pN can be measured with the HRF-AFM readout used. (B–D) Deflection (nm) vs Z-travel (nm) plots show the nanoprobe extension (from left to right) to the PG bilayer surface (horizontal blue line). When the nanoprobe contacts the bilayer surface the cantilever deflects upward (inflection point in blue line moves upward at right in plots). The nanoprobe is then withdrawn from the bilayer and the adhesion force, if any, is recorded (red line). Only the G93ASOD1 nanoprobe showed significant adhesion to the PG bilayer surface (as seen in D), corresponding to a force of ~100 pN. Data representative of three separate experiments and >1000 force scans for each plot shown.
Figure 6
Figure 6
P188 suppresses G93ASOD1 membrane toxicity. (A, upper) Chemical structure of tri-block copolymer P188. (A, lower) P188 molecules visualized directly using HRF-AFM. (Left image) Micelles each show a compacted hydrophobic core of ~20 nm in diameter (white spots) with a surrounding hydrophilic corona with a halo of ~5 nm (orange circles, left image). (Right image) Close inspection of a smaller area scan reveals a sub-monolayer coating of lumpy 10 nm aggregates, some assembled into higher ordered 10 nm wide twisted worm-like structures (right image) situated between the ~20 nm particles seen in A. P188 was adsorbed from a solution of 1 mM P188 in water and then scanned at RT. Full scale z-axis, 10 nm. (B) Binding assays as measured by HRF-AFM. Solutions of G93ASOD1 were incubated against each of 5 planar lipid bilayers composed of differing head groups. Binding of G93ASOD1 to PG is seen, but relatively little to PC, PS, PA or PE membranes. When 10 μM P188 is added to the assay, G93ASOD1 is no longer able to bind PG membrane (red square). Multiple areas across the bilayer surfaces were sampled to confirm representative binding. WTSOD1, the control Src homology 3 (SH3) domain of c-Src kinase, and avidin proteins showed little to no binding against the bilayers. (C) Single bilayer electrophysiology (SB-EP) shows that P188 suppresses PG-selective G93ASOD1 membrane toxicity. After ~10 min, G93ASOD1 reached its maximum toxicity on the PG-enriched reporting membrane (7 of 11 reporting membranes were ruptured, solid line). In contrast, membrane rupture was suppressed by a factor of ~2 (only 3 of 11 reporting membranes were ruptured, dashed line) in the presence of P188. In separate control experiments, 100% of the PG:PE reporting membranes that were stable for 2–3 min after formation maintained their stability over a total of ~20 min in buffer or P188 solution.
Figure 7
Figure 7
P188 suppresses A4VSOD1 membrane toxicity. (A) SB-EP recordings of highly purified A4VSOD1 consistently exhibit “toxic channel” activity (12/12 trials), while the addition of 10 μM P188 reduces this channel activity by ~80% (2/11 trials). Channel activity for hemolysin (HL) was observed in 100% of trials (9/9), and reduced to 50% (3/6) in the presence of P188. (B) By ~10 min post-addition of A4VSOD1, 100% of bilayers under test exhibit “toxic channel” activity (12/12), while only 9% of this activity (1/11) was observed in the presence of P188.
Figure 8
Figure 8
Plots of disease onset (A) and survival (B) of P188- vs. aCSF-treated G93ASOD1 mice.
Figure 9
Figure 9
Motoneuron pathology in aCSF control vs. P188-treated G93ASOD1 end-stage mice. Bar, 50 μm. Representative Nissl-stained sections of lumbar spinal cord of (A) Non-transgenic mice, (B) aCSF-treated G93ASOD1 mice, and (C) P188-treated G93ASOD1 mice. Note extensive loss of motoneurons in B relative to A and C. (D) Mean motoneuron numbers (MNs) from 4 different mice from both the aCSF and P188-treated G93A mice. Mice receiving P188 showed significantly higher numbers of motoneurons at end-stage (P < 0.001). Nissl-sections on healthy adult non-TG mice showed counts of 24 ±3 MNs/anterior horn.
Figure 10
Figure 10
Total lipid peroxides measured from spinal cords of non-transgenic mice (wt), a control group of aCSF-treated G93ASOD1 mice (G93A-), and P188-treated G93ASOD1 mice (G93A+).

References

    1. Acehan D, Malhotra A, Xu Y, Ren M, Stokes DL, Schlame M. Cardiolipin affects the supramolecular organization of ATP synthase in mitochondria. Biophysical Journal. 2011;100(9):2184–2192. - PMC - PubMed
    1. Allen MJ, Lacroix JJ, Ramachandran S, Capone R, Whitlock JL, Ghadge GD, … Lal R. Mutant SOD1 forms ion channel: implications for ALS pathophysiology. Neurobiology of Disease. 2012;45(3):831–838. - PMC - PubMed
    1. Banquy X, Lee DW, Kristiansen K, Gebbie MA, Israelachvili JN. Interaction forces between supported lipid bilayers in the presence of PEGylated polymers. Biomacromolecules. 2015;17(1):88–97. - PubMed
    1. Barber SC, Mead RJ, Shaw PJ. Oxidative stress in ALS: a mechanism of neurodegeneration and a therapeutic target. Biochimica et Biophysica Acta (BBA)-Molecular Basis of Disease. 2006;1762(11):1051–1067. - PubMed
    1. Beal MF. Mitochondria and the pathogenesis of ALS. Brain. 2000;123(7):1291–1292. - PubMed

Publication types