. 2018 Jun:16:381-387.
doi: 10.1016/j.redox.2018.03.004. Epub 2018 Mar 9.

Sorting cells alters their redox state and cellular metabolome

Affiliations

Sorting cells alters their redox state and cellular metabolome

Elizabeth M Llufrio et al. Redox Biol. 2018 Jun.

Abstract

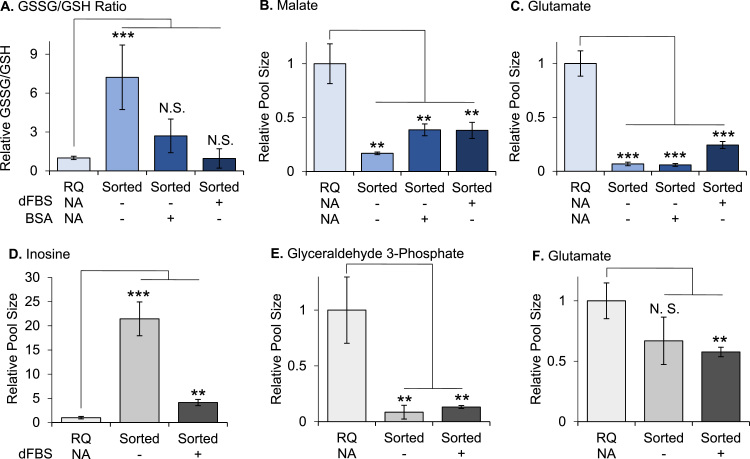
A growing appreciation of the metabolic artifacts of cell culture has generated heightened enthusiasm for performing metabolomics on populations of cells purified from tissues and biofluids. Fluorescence activated cell sorting, or FACS, is a widely used experimental approach to purify specific cell types from complex heterogeneous samples. Here we show that FACS introduces oxidative stress and alters the metabolic state of cells. Compared to unsorted controls, astrocytes subjected to FACS prior to metabolomic analysis showed altered ratios of GSSG to GSH, NADPH to NADP+, and NAD+ to NADH. Additionally, a 50% increase in reactive oxygen species was observed in astrocytes subjected to FACS relative to unsorted controls. At a more comprehensive scale, nearly half of the metabolomic features that we profiled by liquid chromatography/mass spectrometry were changed by at least 1.5-fold in intensity due to cell sorting. Some specific metabolites identified to have significantly altered levels as a result of cell sorting included glycogen, nucleosides, amino acids, central carbon metabolites, and acylcarnitines. Although the addition of fetal bovine serum to the cell-sorting buffer decreased oxidative stress and attenuated changes in metabolite concentrations, fetal bovine serum did not preserve the metabolic state of the cells during FACS. We conclude that, irrespective of buffer components and data-normalization strategies we examined, metabolomic results from sorted cells do not accurately reflect physiological conditions prior to sorting.


Figures

Fig. 1
Fig. 1
Sorting astrocytes alters their redox state. (A) Relative ratio of GSSG to GSH in rapidly quenched cells, delayed-quench cells, and sorted cells. Ratio was determined by LC/MS. (B) Relative ratio of GSSG to GSH in cells after they were transferred to sorting buffer with or without 200 μM H2O2 for four hours. (C) Comparison of ROS after cells were subjected to either a delayed quench or sorting. (D) Relative ratio of NADPH to NADP+ as determined with a commercial kit in rapidly quenched cells, delayed-quench cells, and sorted cells. (E) Levels of NAD+ and NADH as determined by LC/MS in rapidly quenched cells and sorted cells. NADH was below the limit of detection after sorting. (F) Microscope images of astrocytes in sorting buffer with and without 1% dFBS for four hours demonstrates that dFBS improves cell viability. Quantitation shows that 1% dFBS has a statistically significant effect on cell viability. Data shown are mean values +/- s.d. (n = 3 biological replicates). **p < 0.01, ***p < 0.001; RQ, Rapidly Quenched; DQ, Delayed Quench; dialyzed fetal bovine serum, dFBS.
Fig. 2
Fig. 2
Sorting cells causes widespread alterations in metabolism. (A) Ratio of ADP to ATP in rapidly quenched and sorted cells. (B) Ratio of ADP to ATP in cells after they were transferred to sorting buffer with or without 200 μM H2O2 for four hours. Data shown (A-B) are mean values +/- s.d. (n = 3 biological replicates). (C-F) Scatter plots displaying signals detected by untargeted metabolomics after filtering to remove isotopes, adducts, etc. For each signal, fold changes were calculated from the mean of rapidly quenched cells versus sorted cells (n = 3 biological replicates). Data were transformed by log2() for display. Signals above the y = log2(1.5) line were altered by a fold change ≥1.5. (C) Comparison of sorted cells to rapidly quenched cells without 1% dFBS when using a HILIC separation and negative-ionization mode. (D) Comparison of sorted cells to rapidly quenched cells without 1% dFBS when using a RPLC separation and positive-ionization mode. (E) Same as (C), but with 1% dFBS. (F) Same as (D), but with 1% dFBS. **p < 0.01.
Fig. 3
Fig. 3
Some representative metabolites whose relative concentrations change due to sorting. (A-E) Metabolite levels were quantified by LC/MS. (F) Glycogen levels were measured with a commercial kit. Data shown are mean values +/- s.d. (n = 3 biological replicates). *p < 0.05, **p < 0.01, ***p < 0.001; RQ, Rapidly Quenched; dFBS, dialyzed fetal bovine serum; lysoPC, lysophosphatidylcholine.
Fig. 4
Fig. 4
Attempts to preserve metabolism during sorting with dFBS and BSA as well as strategies to infer metabolites levels prior to FACS with data normalization failed. (A) Relative ratio of GSSG to GSH in rapidly quenched and sorted cells ±1% dFBS or 1% BSA, as determined by LC/MS. (B-C) Relative levels of malate and glutamate in rapidly quenched and sorted cells ±1% dFBS or 1% BSA, as determined by LC/MS. (D-F) Normalizing LC/MS data by the median metabolite signal intensity in each sample does not correct for metabolic alterations that result from sorting. See Fig. 3D, B, and Fig. S4B for comparisons of inosine, glyceraldehyde 3-phosphate, and glutamate before data normalization, respectively. Data shown are mean values +/- s.d. (n = 3 biological replicates). **p < 0.01, ***p < 0.001; RQ, Rapidly quenched; dFBS, dialyzed fetal bovine serum.

References

    1. Zamboni N., Saghatelian A., Patti G.J. Defining the metabolome: size, flux, and regulation. Mol. Cell. 2015;58:699–706. - PMC - PubMed
    1. Villas-Bôas S.G., Bruheim P. Cold glycerol–saline: the promising quenching solution for accurate intracellular metabolite analysis of microbial cells. Anal. Biochem. 2007;370:87–97. - PubMed
    1. Mayers J.R., Vander Heiden M.G. Nature and nurture: what determines tumor metabolic phenotypes? Cancer Res. 2017;77:3131–3134. - PubMed
    1. Zanetti K.A., Mette E., Maruvada P., Milner J., Moore S.C., Nicastro H.L., Ross S.A., Sampson J.N., Verma M., L J.S. The future of metabolomic profiling in population-based research: opportunities and challenges. J. Anal. Bioanal. Tech. 2014;5:1–4.
    1. Ng P.C., Lam H.S. Biomarkers in neonatology: the next generation of tests. Neonatology. 2012;102:145–151. - PubMed

Publication types