. 2018 Apr 7;7(8):e007805.
doi: 10.1161/JAHA.117.007805.

Mitochondrial Ca2+ Influx Contributes to Arrhythmic Risk in Nonischemic Cardiomyopathy

Affiliations

Mitochondrial Ca2+ Influx Contributes to Arrhythmic Risk in Nonischemic Cardiomyopathy

An Xie et al. J Am Heart Assoc. .

Abstract

Background: Heart failure (HF) is associated with increased arrhythmia risk and triggered activity. Abnormal Ca2+ handling is thought to underlie triggered activity, and mitochondria participate in Ca2+ homeostasis.

Methods and results: A model of nonischemic HF was induced in C57BL/6 mice by hypertension. Computer simulations were performed using a mouse ventricular myocyte model of HF. Isoproterenol-induced premature ventricular contractions and ventricular fibrillation were more prevalent in nonischemic HF mice than sham controls. Isolated myopathic myocytes showed decreased cytoplasmic Ca2+ transients, increased mitochondrial Ca2+ transients, and increased action potential duration at 90% repolarization. The alteration of action potential duration at 90% repolarization was consistent with in vivo corrected QT prolongation and could be explained by augmented L-type Ca2+ currents, increased Na+-Ca2+ exchange currents, and decreased total K+ currents. Of myopathic ventricular myocytes, 66% showed early afterdepolarizations (EADs) compared with 17% of sham myocytes (P<0.05). Intracellular application of 1 μmol/L Ru360, a mitochondrial Ca2+ uniporter-specific antagonist, could reduce mitochondrial Ca2+ transients, decrease action potential duration at 90% repolarization, and ameliorate EADs. Furthermore, genetic knockdown of mitochondrial Ca2+ uniporters inhibited mitochondrial Ca2+ uptake, reduced Na+-Ca2+ exchange currents, decreased action potential duration at 90% repolarization, suppressed EADs, and reduced ventricular fibrillation in nonischemic HF mice. Computer simulations showed that EADs promoted by HF remodeling could be abolished by blocking either the mitochondrial Ca2+ uniporter or the L-type Ca2+ current, consistent with the experimental observations.

Conclusions: Mitochondrial Ca2+ handling plays an important role in EADs seen with nonischemic cardiomyopathy and may represent a therapeutic target to reduce arrhythmic risk in this condition.

Keywords: arrhythmia; calcium; heart failure; mitochondria.


Figures

Figure 1
Figure 1
Computer model of mouse ventricular cell. A, Schematic diagrams of the 3‐dimensional structure of the cell model (left) and the Ca2+ release unit (CRU)–mitochondrial Ca2+ cycling model (right). B, The modified L‐type Ca2+ current model. Left: The Hodgkin‐Huxley (HH) scheme. Right: The equivalent Markov scheme of the HH scheme. To simulate a much lower channel open probability (≈5%–10%) observed in experiments, we added a new state (the final open state), with the opening rate from the d2f2fCa2 state being r1 and the closing rate being r2. CYTO indicates cytosolic space; DS, dyadic space; jm‐NaCa, mitochondrial Na+‐Ca2+ exchanger Ca2+ release; JSR, junctional sarcoplasmic reticulum; juni, mitochondrial Ca2+ uniporter uptake; jup, sarco/endoplasmic reticulum Ca2+‐ATPase (SERCA) uptake; LCC, L‐type Ca2+ channel; MITO, mitochondrial space; NSR, network sarcoplasmic reticulum; RyR, ryanodine receptor; SUB, submembrane space.
Figure 2
Figure 2
Telemetry of sham and nonischemic heart failure (NIHF) C57BL/6 mice. A, Examples of telemetric ECG recordings. ECG signals in the left and right panels were sampled from sham and NIHF mice, respectively. Waveforms were collected before (control) and after (0.2 and 2.5 mg/kg IP) isoproterenol injection. B, Heart rate (HR; beats per minute) and corrected QT (QTc) intervals (ms) were measured from lead II and plotted in left and right panels, respectively. Compared with the control mice, NIHF mice showed a longer QT interval. n=7 (mice) for each group. *P<0.05 compared with that in sham group.
Figure 3
Figure 3
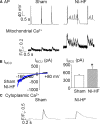
Representative action potentials (APs), mitochondrial Ca2+ transients, mitochondrial Ca2+ uniporter current (IMCU), and cytosol Ca2+ transients recorded from sham and nonischemic heart failure (NIHF) mouse ventricular myocytes. A, APs and mitochondrial Ca2+ transients simultaneously recorded from cardiomyopathic ventricular cells showing early afterdepolarizations (EADs). Stimulation (0.5 Hz) was used to evoke APs. The time scale bar is shown at 0 mV. Mitochondrial Ca2+ oscillations corresponded with EADs. B, Left panel: IMCU in mitoplasts isolated from both sham and NIHF ventricular cardiomyocytes. Right panel: The average IMCU at −160 mV (n=8 for sham, and n=7 for NIHF). C, Cytoplasmic Ca2+ transients without EADs. F/F0 indicates background‐subtracted normalized fluorescence.
Figure 4
Figure 4
Typical action potential (AP) and mitochondrial Ca2+ traces recorded synchronously from nonischemic heart failure (NI‐HF) mice and NIHF mice treated with Ru360 (1 µmol/L). Top panel: APs. Bottom panel: Mitochondrial Ca2+ transients. Triggered activity was inhibited by intracellular application of 1 µmol/L Ru360 in NIHF cardiomyocytes. Stimulation (0.5 Hz) was used to evoke APs. The time scale bar is shown at 0 mV. F/F0 indicates background‐subtracted normalized fluorescence.
Figure 5
Figure 5
Comparison of membrane currents in sham and nonischemic heart failure (NIHF) cardiomyocytes. A, Top panel: K+ currents recorded at +50 mV from both sham and NIHF cardiomyocytes. Middle panel: The average peak amplitudes of total K+ currents (IK + ‐peak) are shown (n=4 cells from 2 sham mice, and n=3 cells from 1 NIHF mouse). The holding potential was −80 mV. Voltages were from −110 to +50 mV, with a step of +10 mV and a duration of 5 seconds. Bottom panel: The average steady‐state currents of total K+ currents (IK + SS) are drawn (n=4 cells from 2 sham mice, and n=3 cells from 1 NIHF mouse). B, Top panel: L‐type Ca2+ currents recorded at 0 mV from both sham and NIHF cardiomyocytes. Bottom panel: The average peak amplitudes of L‐type Ca2+ currents (n=4 cells from 1 sham mouse, and n=5 cells from 1 NIHF mouse). The holding potential was −50 mV. Voltages were from −40 to +60 mV, with a step of +10 mV and a duration of 300 ms. C, The average inward Na+‐Ca2+ exchanger (NCX) currents (n=7 cells from 2 mice in sham group, and n=9 cells from 2 mice in NIHF group). Cells were put in a solution containing no Na+ and 10 µmol/L ryanodine. The holding potential was −40 mV. Ten 100‐ms steps from −40 to +10 mV were followed by a step to −100 mV to repolarized cells. This step was accompanied by rapidly applied Na+ to record NCX currents. *P<0.05 compared with that in sham group.
Figure 6
Figure 6
Mitochondrial Ca2+ uniporter (MCU) expression in wild‐type (WT) and MCU +/− mice and Na+‐Ca2+ exchanger (NCX) currents of WT nonischemic heart failure (NIHF) and MCU +/− NIHF mice. A, Representative Western blot results: Compared with WT mice, the MCU protein level is decreased in MCU +/− mice hearts. B, MCU mRNA expression obtained by quantitative real‐time reverse transcription–polymerase chain reaction is substantially reduced in MCU +/− mice hearts by 58% (n=6 mice in WT group, and n=8 mice in MCU +/− group). C, Compared with NIHF mice ventricular cardiomyocytes, the membrane NCX currents are significantly decreased in MCU +/− NIHF mice cardiomyocytes (n=7 cells from 2 mice in NI‐HF cardiomyocytes, and n=6 cells from 2 mice in MCU +/− NIHF cardiomyocytes). *P<0.05, **P<0.01 compared with that in NIHF group.
Figure 7
Figure 7
Action potentials (APs) and mitochondrial Ca2+ traces recorded simultaneously from nonischemic heart failure (NIHF) and mitochondrial Ca2+ uniporter (MCU) +/− NIHF mice. Top panel: APs. Early afterdepolarizations were eliminated in MCU +/− NIHF mouse cardiomyocytes. Bottom panel: Mitochondrial Ca2+ transients. Stimulation (0.5 Hz) was used to evoke APs. The time scale bar is shown at 0 mV. F/F0 indicates background‐subtracted normalized fluorescence.
Figure 8
Figure 8
Telemetry of nonischemic heart failure (NIHF) and mitochondrial Ca2+ uniporter (MCU)+/− NIHF CD1 mice. A, Examples of telemetric ECG recordings. ECG signals in top and bottom panels were sampled from NIHF (n=5) and MCU +/− NIHF (n=6) mice, respectively. Waveforms were collected before (control) and after (IP 2.5 mg/kg) isoproterenol injection. B, Heart rate (HR) and corrected QT (QTc) were measured from lead II and plotted in left and right panels, respectively. Compared with the NIHF mice, MCU +/− NIHF mice showed a reduced QT interval (n=4 mice for the NI‐HF group, and n=5 mice for the MCU +/− NIHF group). *P<0.05 compared with that in NIHF group.
Figure 9
Figure 9
The alterations of mitochondrial properties in nonischemic heart failure (NIHF) mice. A, Fluorescence staining results revealed that the overall mitochondrial mass increased from background‐subtracted normalized fluorescence (F/Fo) of 1.13±0.02 in sham ventricular cardiomyocytes (n=16) to 1.20±0.03 in NIHF cardiomyocytes (n=19). B, Compared with sham cardiomyocytes (n=12), the mitochondrial membrane potential was slightly depolarized in NIHF cardiomyocytes (n=10). Mitochondrial membrane potential was collapsed by 20 µmol/L carbonyl cyanide 4‐(trifluoromethoxy) phenylhydrazone (FCCP) in both sham and NIHF cardiomyocytes. C, Western blots of mitochondrial Ca2+ uniporter (MCU), mitochondrial Na+‐Ca2+ exchange (NCLX), and phosphorylated MCU. D, The expression of phosphorylated MCU was upregulated from 0.30±0.04 in sham group to 1.45±0.46 in NIHF group. GFP indicates green fluorescent protein; p‐tyrosine, phosphorylated tyrosine; TMRM, tetramethylrhodamine methyl ester. *P<0.05 compared with that in sham group.
Figure 10
Figure 10
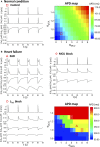
Computer simulation results. A, Action potential duration (APD) and Ca2+ cycling dynamics under the normal condition. Left panel: Time traces of membrane voltage, cytosolic Ca2+ concentration, sarcoplasmic reticulum Ca2+ concentration, and mitochondrial free Ca2+ concentration under the normal control condition. Right panel: Dependence of the APD on mitochondrial Ca2+ uniporter (MCU) activity (αMCU) and L‐type Ca2+ channel (LCC) conductance (αgCaL). B, APD and Ca2+ cycling dynamics under the heart failure condition. The layout of time traces for each case is the same as in A. Top left: Heart failure controls with early afterdepolarizations (EADs). Top right: MCU activity was reduced by 3‐fold (αMCU changed from 4 to 1). Bottom left: LCC conductance was reduced by 20% (αgCaL changed from 1.1 to 0.9). Bottom right: Dependence of the APD on MCU activity and LCC conductance. In this map, the APD jumps suddenly from ≈50 to >300 ms when EADs occur. The 3 specific cases shown above were marked on the map with different symbols. ICa,L indicates L‐type Ca2+ current.
Figure 11
Figure 11
Mechanistic insights from the computer model into the roles of mitochondrial Ca2+ handling in the genesis of early afterdepolarizations (EADs). A through C, Ca2+ concentrations in different compartments of the cell model vs the strength of mitochondrial Ca2+ uniporter (MCU), showing bistability. The simulations were performed as follows. We first started the simulations from the normal control MCU activity (αMCU=1) and increased αMCU gradually to 35, as indicated by the blue arrows (B). The system switches from no EADs (also low Ca2+ concentration states) to EADs (also high Ca2+ concentration states) at αMCU≈30, at which the mitochondrial free Ca2+ reaches 136 nmol/L (open arrow). For each αMCU, 50 beats were simulated for the cell to reach steady state before changing to a larger αMCU. We then started the simulations in the same way but from a high MCU activity (αMCU=35) to the normal control value (αMCU=1), as indicated by the red arrow (B). The system switches from EADs to no EADs at αMCU≈2.4. D. [Ca2+]mito, [Ca2+]i, [Ca2+]SR, INCX, IC a,L, and V vs time from 2 simulations for αMCU=5. In the first simulation (blue traces), the mitochondrial Ca2+ is free running (unclamped), and the cell is in the low Ca2+ state without EADs. In the second simulation (red traces), [Ca2+]mito is suddenly elevated to 200 nmol/L and held constant (clamped) for the rest of the simulation. 1, 2, and 3 mark the first 3 beats during the clamped phase. [Ca2+]mito indicates mitochondrial Ca2+ concentration; [Ca2+]i, intracellular Ca2+ concentration; [Ca2+]SR, SR Ca2+ concentration; INCX, NCX current; IcaL, L‐type Ca2+ current; V, membrane potential.
Figure 12
Figure 12
Schematic plot of the feedback loops involved in the action potential (AP) and Ca2+ cycling dynamics. APD indicates AP duration; [Ca2+]mito, mitochondrial Ca2+ concentration; [Ca2+]i, intracellular Ca2+ concentration; [Ca2+]SR, SR Ca2+ concentration;EAD, early afterdepolarization; LCC, L‐type Ca2+ channel; MCU, mitochondrial Ca2+ uniporter; NCX, Na+‐Ca2+ exchange; RyR, ryanodine receptor; SERCA, sarco/endoplasmic reticulum Ca2+‐ATPase.

Similar articles

Cited by

References

    1. Nuss HB, Kaab S, Kass DA, Tomaselli GF, Marban E. Cellular basis of ventricular arrhythmias and abnormal automaticity in heart failure. Am J Physiol. 1999;277:H80–H91. - PubMed
    1. Weiss JN, Garfinkel A, Karagueuzian HS, Chen PS, Qu Z. Early afterdepolarizations and cardiac arrhythmias. Heart Rhythm. 2010;7:1891–1899. - PMC - PubMed
    1. Zhao Z, Xie Y, Wen H, Xiao D, Allen C, Fefelova N, Dun W, Boyden PA, Qu Z, Xie LH. Role of the transient outward potassium current in the genesis of early afterdepolarizations in cardiac cells. Cardiovasc Res. 2012;95:308–316. - PMC - PubMed
    1. Ruiz‐Meana M, Fernandez‐Sanz C, Garcia‐Dorado D. The SR‐mitochondria interaction: a new player in cardiac pathophysiology. Cardiovasc Res. 2010;88:30–39. - PubMed
    1. Porter GA Jr, Hom J, Hoffman D, Quintanilla R, de Mesy Bentley K, Sheu SS. Bioenergetics, mitochondria, and cardiac myocyte differentiation. Prog Pediatr Cardiol. 2011;31:75–81. - PMC - PubMed

Publication types

MeSH terms

Substances