. 2018 May 1;27(5):977-987.e4.
doi: 10.1016/j.cmet.2018.02.024. Epub 2018 Apr 5.

Increased Tumor Glycolysis Characterizes Immune Resistance to Adoptive T Cell Therapy

Affiliations

Increased Tumor Glycolysis Characterizes Immune Resistance to Adoptive T Cell Therapy

Tina Cascone et al. Cell Metab. .

Abstract

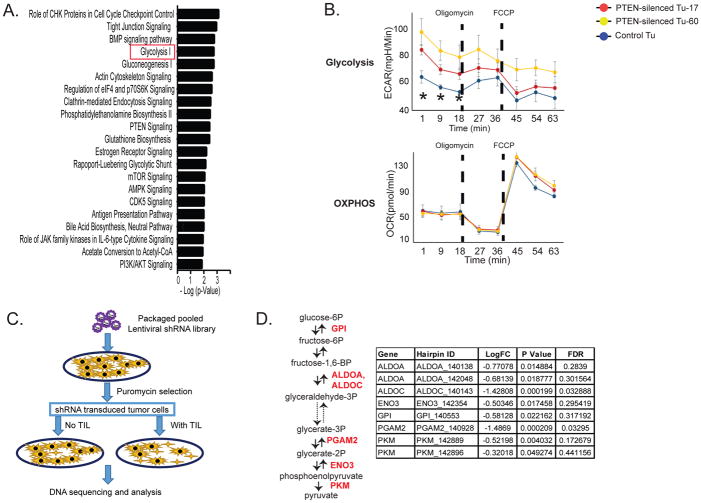
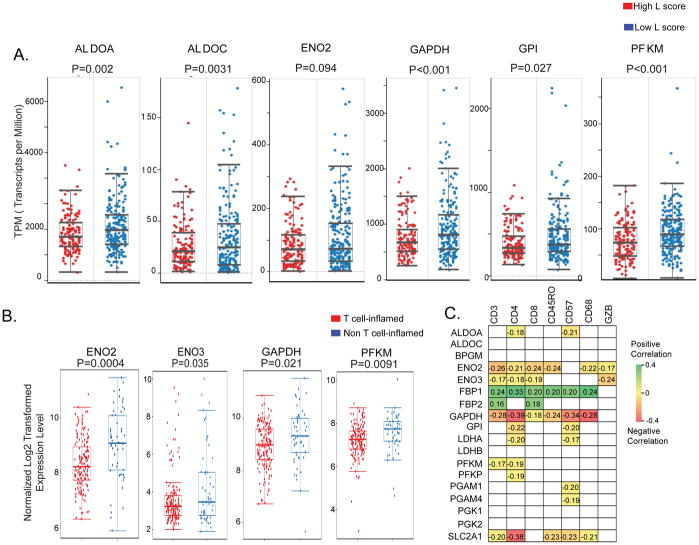
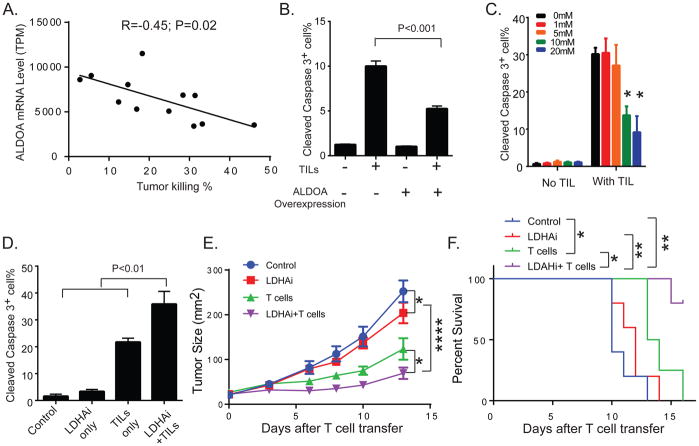
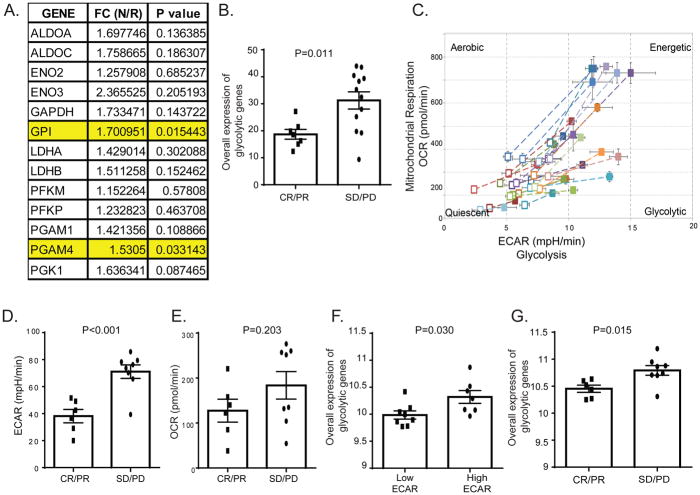
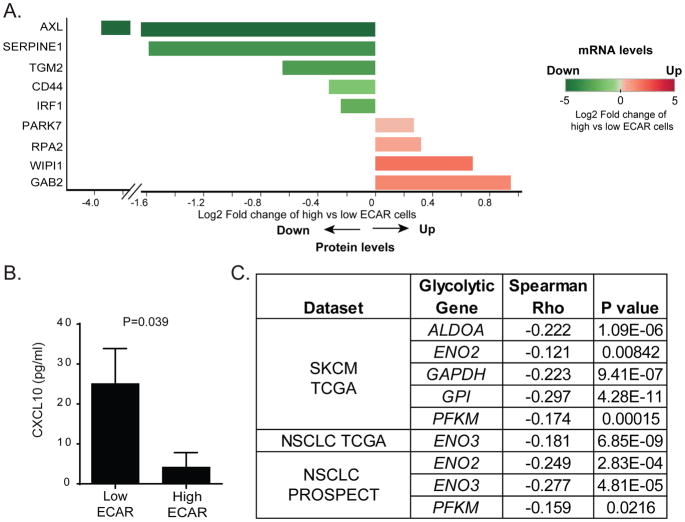
Adoptive T cell therapy (ACT) produces durable responses in some cancer patients; however, most tumors are refractory to ACT and the molecular mechanisms underlying resistance are unclear. Using two independent approaches, we identified tumor glycolysis as a pathway associated with immune resistance in melanoma. Glycolysis-related genes were upregulated in melanoma and lung cancer patient samples poorly infiltrated by T cells. Overexpression of glycolysis-related molecules impaired T cell killing of tumor cells, whereas inhibition of glycolysis enhanced T cell-mediated antitumor immunity in vitro and in vivo. Moreover, glycolysis-related gene expression was higher in melanoma tissues from ACT-refractory patients, and tumor cells derived from these patients exhibited higher glycolytic activity. We identified reduced levels of IRF1 and CXCL10 immunostimulatory molecules in highly glycolytic melanoma cells. Our findings demonstrate that tumor glycolysis is associated with the efficacy of ACT and identify the glycolysis pathway as a candidate target for combinatorial therapeutic intervention.

Keywords: adoptive T cell therapy; cancer immunotherapy; glycolysis; immune resistance; melanoma; non-small cell lung cancer; tumor metabolism reprogramming.


Conflict of interest statement

DECLARATION OF INTERESTS

P. Hwu is a consultant/an advisory board member for Immatics, Dragonfly, Sanofi, and GlaxoSmithKline. M.A. Davies is an advisory board member for Bristol-Myers Squibb, GlaxoSmithKline, Novartis, Roche, Genentech, Sanofi and Vaccinex. J.V. Heymach is a consultant/an advisory board member for AstraZeneca, Boehringer Ingelheim, EMD Serono, Genentech, Eli Lilly, Merck, Roche, Spectrum, Guardant, Janssen, Novartis, and Foundation Medicine. P. Hwu and W. Peng are PIs of grants to MD Anderson Cancer Center from GlaxoSmithKline. All other authors declare no competing interests. Currently, S. Malu and L.A. Garraway are employees of Eli Lilly, and R.M. Mbofung is an employee of Merck Research Laboratories.

Figures

Figure 1
Figure 1. Glycolysis-related genes are identified as candidate genes that promote resistance to T cell-mediated antitumor activity
A. List of pathways that are significantly modulated by silencing PTEN in melanoma cells. The mRNA expression profiles of PTEN-silenced and control cell lines were established from a melanoma cell line (A375) by microarray analysis. The two PTEN-silenced cell lines expressed shRNA hairpins that target different positions of the PTEN sequence (PTEN-silenced Tu-17 and Tu-60), and the corresponding control cell line (Control Tu) expressed a non-targeting shRNA hairpin. IPA was used to determine the pathways that are directly regulated by PTEN expression. B. Bioenergetic profiles of melanoma cells with or without silenced PTEN are shown. The Seahorse XF cell Mito stress test was used to define the bioenergetic profiles of PTEN-silenced and control cells. The changes in ECAR and OCR for the time indicated during a XF24 extracellular flux analyzer run are plotted. Oligomycin (1 uM) and FCCP (0.3 uM) were sequentially injected to the assay medium. The dash lines indicate the injection time points. *P<0.05. FCCP: carbonyl cyanide-4 (trifluoromethoxy) phenylhydrazone. C. A modified dropout screen used to identify genes that promote resistance to T cell-mediated tumor killing is shown. Patient-derived melanoma cells were transduced with a pooled shRNA library, followed by puromycin selection to eliminate non-transduced cells. After a 2-week cell culture to remove the genes that directly modulate cell survival, the cells were selected by autologous TILs with an effector to target (E:T) ratio of 1:1 that caused approximately 30% killing efficiency. The shRNA-targeted genes that promote resistance to T cell-induced tumor killing were underrepresented in the samples with TIL treatment. D. The identified candidate immune regulators involved in enzymatic steps of glycolysis are shown. LogFC: the base 2 log of the fold change of TIL-treated groups vs. control; FDR: false discovery rate. ALDOA and ALDOC: aldolase A and C; ENO3: enolase 3, GPI: glucose-6-phosphate isomerase; PGAM2: phosphoglycerate mutase 2.
Figure 2
Figure 2. Increased expression of glycolysis-related genes is associated with poor T cell infiltration in clinical samples of melanoma and NSCLC
A. Boxplots correlating the lymphocyte infiltration of tumors (L score) and the mRNA expression levels of tumor glycolytic genes are shown in melanoma samples (TCGA). L score in cutaneous melanoma patients was evaluated by pathologists and reported as numerical value on a 0–6 scale, where a score >3 indicates high abundance of tumor-infiltrating T cells. The mRNA gene expression is plotted as transcripts per million. B. Boxplots correlating the mRNA expression of the glycolytic genes with the levels of T cell signature genes in NSCLC samples from PROSPECT are shown. C. Significant correlations between the mRNA expression of the indicated glycolysis-related genes and the IHC immune markers scored in NSCLC samples from PROSPECT dataset are shown as Pearson correlation coefficients. P<0.05 was used to determine statistical significance. The gray squares represent no statistically significant correlations. BPGM: bisphosphoglycerate Mutase; ENO2: enolase 2; FBP1, FBP2: fructose-bisphosphatase 1 and 2; GAPDH: glyceraldehyde-3-phosphate dehydrogenase; LDHA, LDHB: lactate dehydrogenase A, B; PFKM: phosphofructokinase, muscle; PFKP: phosphofructokinase, platelet; PGAM1, PGAM4: phosphoglycerate mutase 1 and 4; PGK1: phosphoglycerate kinase; PGK2: phosphoglycerate kinase; SLC2A1: solute carrier family 2 member 1; GZB: granzyme B.
Figure 3
Figure 3. Increased tumor glycolytic activity impairs T cell-mediated apoptosis of melanoma cells
A. The linear regression of mRNA expression of ALDOA in patient-derived melanoma cell lines correlated with the percentage of T cell-mediated tumor killing is shown. Patient-derived melanoma cell lines (n=12) overexpressing Gp100 and H-2Db, which can be recognized by Pmel T cells derived from the TCR transgenic Pmel-1 mouse, were generated by lentivirus-based genetic manipulations. Transduced melanoma cells were co-cultured with Pmel T cells at an effector to target ratio of 10:1 for 3 hours. The percentage of T cell-induced tumor killing was then calculated by quantifying the number of cleaved caspase-3+ cells with respect to the total number of tumor cells by flow cytometry. The mRNA expression of glycolysis-related genes in patient-derived melanoma cells was determined by microarray analysis. The R and P-value of the correlation between the ALDOA expression and the sensitivity to T cell killing in this set of patient-derived melanoma cell lines are listed. B. Overexpression of ALDOA in melanoma cells promotes resistance to T cell-mediated tumor cell apoptosis. Patient-derived melanoma cells (Mel2400) were transduced with lentiviral vectors encoding either ALDOA-RFP or GFP-RFP. The percentage of cleaved caspase-3+ transduced melanoma cells (based on the expression of the reporter gene RFP) was determined by flow cytometry. C. The impaired effector function of TILs by lactic acid is shown. TILs (TIL2559) derived from a melanoma patient were treated overnight with different concentrations of lactic acid. *P<0.05 (with versus without lactic acid treatment) D. LDHAi increases T cell-induced killing of melanoma cells. Patient-derived melanoma cells (Mel2792) were pre-treated with 1 uM of GSK2837808A, and followed by co-culture with autologous TILs (TIL2792) for 4 hours. E. Targeting glycolysis pathway enhances the antitumor activity of T cells. B16 melanoma cells were implanted subcutaneously in C57BL/6 mice. Tumor-bearing mice were treated with either GSK2837808A (6 mg/kg) orally and/or adoptively transferred Pmel T cells. Mice treated with the relevant solvent were used as control. Tumor sizes were monitored by measuring the perpendicular diameters of the tumors and are shown as mean tumor area ± SEM. All experiments were carried out in a blinded, randomized fashion (n=4–5 mice per group). F. Kaplan-Maier plots show survivals of tumor-bearing mice treated with vehicle, GSK2837808A, T cell therapy and combination of GSK2837808A and T cell therapy (n=4–5 mice per group). *P<0.05, **P<0.01, and ****P<0.0001.
Figure 4
Figure 4. Increased tumor glycolytic activity is correlated with resistance to ACT in melanoma patients
A. The expression of glycolysis-related genes in FFPE samples (n=19) from melanoma patients treated with ACT was determined by RNA sequencing. Response to ACT was determined on the basis of Response Evaluation Criteria in Solid Tumors version 1.1 (RECIST v1.1). The FC indicates the gene expression fold change between non-responders (N) and responders (R). Non-responders are patients with stable disease (SD) or progressive disease (PD) after treatment with ACT. Responders are patients with complete or partial response (CR or PR) to ACT. A significantly higher expression of GPI and PGAM4 in non-responders compared to responders is highlighted. B. The association between the overall glycolytic gene expression measured in FFPE tumor samples from melanoma patients and the radiographic response of their tumor to TIL therapy is shown. The overall expression of glycolytic genes was determined as averaged mRNA expression of GPI and PGAM4 genes. C. The different bioenergetic profiles of melanoma cell lines are plotted. The levels of ECAR and OCR in the Mito stress tests were evaluated in patient-derived melanoma cell lines and used to generate cell energy phenotype profiles by the XF cell Energy Phenotype Report Generator. The baseline activity (open symbols) and the metabolic activity in response to mitochondrial stressors (closed symbols) of each cell line are connected by dashed lines. D, E. Elevated tumor glycolytic activity in melanoma cells from non-responders to ACT. Patient-derived melanoma cell lines were used to perform the Seahorse XF glucose stress test as described in the manufacturer’s protocol. The ECAR and OCR of each cell line were recorded 10 minutes after glucose injection in tumor cells. Cell lines were stratified into two groups based on their corresponding response to ACT. The ECAR (D) and OCR (E) levels of both groups are shown. F. Increased expression of glycolysis-related genes in glycolytic melanoma cells. Patient-derived melanoma cell lines were stratified into high ECAR cells vs. low ECAR cells based on the ECAR level determined by glucose stress test. G. Association between the overall expression of glycolytic genes and radiographic tumor response in melanoma cells derived from ACT-treated patients is shown. The averaged gene expression of GPI and PGAM4 genes was used to represent the overall expression of glycolytic genes in melanoma cell lines.
Figure 5
Figure 5. Phenotypic characterization of tumors with high glycolytic activity
A. Differentially expressed molecules between patient-derived melanoma cell lines with high versus low glycolytic activity are shown. Cell lines with the highest and lowest quartile ECAR levels were selected to compare the expression profiles determined by microarray and RPPA analyses. The log2 FC expression of molecules between high ECAR and low ECAR cells was calculated. The log2 FC that was statistically significant in both microarray and RPPA analyses is plotted (n=4 per group). On the x-axis, the direction and length of each bar represents the log2FC of the indicated molecules in high vs. low ECAR cells at the protein level. The color of each bar encodes quantitative value of the log2FC of the indicated molecules on the y-axis in high vs. low ECAR cells at the mRNA level. B. Reduced CXCL10 production by high ECAR cells compared to low ECAR cells. C. A negative correlation between the mRNA level of CXCL10 and the expression of glycolysis-related genes in melanoma and NSCLC datasets is shown.

Comment in

References

    1. Altman BJ, Stine ZE, Dang CV. From Krebs to clinic: glutamine metabolism to cancer therapy. Nature reviews Cancer. 2016;16:619–634. - PMC - PubMed
    1. Benci JL, Xu B, Qiu Y, Wu TJ, Dada H, Twyman-Saint Victor C, Cucolo L, Lee DS, Pauken KE, Huang AC, et al. Tumor Interferon Signaling Regulates a Multigenic Resistance Program to Immune Checkpoint Blockade. Cell. 2016;167:1540–1554. e1512. - PMC - PubMed
    1. Bossi D, Cicalese A, Dellino GI, Luzi L, Riva L, D’Alesio C, Diaferia GR, Carugo A, Cavallaro E, Piccioni R, et al. In Vivo Genetic Screens of Patient-Derived Tumors Revealed Unexpected Frailty of the Transformed Phenotype. Cancer Discov. 2016;6:650–663. - PubMed
    1. Brand A, Singer K, Koehl GE, Kolitzus M, Schoenhammer G, Thiel A, Matos C, Bruss C, Klobuch S, Peter K, et al. LDHA-Associated Lactic Acid Production Blunts Tumor Immunosurveillance by T and NK Cells. Cell Metab. 2016;24:657–671. - PubMed
    1. Cancer Genome Atlas N. Genomic Classification of Cutaneous Melanoma. Cell. 2015;161:1681–1696. - PMC - PubMed