. 2018 Mar 23:12:13.
doi: 10.3389/fninf.2018.00013. eCollection 2018.

A Statistically Representative Atlas for Mapping Neuronal Circuits in the Drosophila Adult Brain

Affiliations

A Statistically Representative Atlas for Mapping Neuronal Circuits in the Drosophila Adult Brain

Ignacio Arganda-Carreras et al. Front Neuroinform. .

Abstract

Imaging the expression patterns of reporter constructs is a powerful tool to dissect the neuronal circuits of perception and behavior in the adult brain of Drosophila, one of the major models for studying brain functions. To date, several Drosophila brain templates and digital atlases have been built to automatically analyze and compare collections of expression pattern images. However, there has been no systematic comparison of performances between alternative atlasing strategies and registration algorithms. Here, we objectively evaluated the performance of different strategies for building adult Drosophila brain templates and atlases. In addition, we used state-of-the-art registration algorithms to generate a new group-wise inter-sex atlas. Our results highlight the benefit of statistical atlases over individual ones and show that the newly proposed inter-sex atlas outperformed existing solutions for automated registration and annotation of expression patterns. Over 3,000 images from the Janelia Farm FlyLight collection were registered using the proposed strategy. These registered expression patterns can be searched and compared with a new version of the BrainBaseWeb system and BrainGazer software. We illustrate the validity of our methodology and brain atlas with registration-based predictions of expression patterns in a subset of clock neurons. The described registration framework should benefit to brain studies in Drosophila and other insect species.

Keywords: Drosophila adult brain; anatomical atlas; atlas-based image segmentation; average brain template; brain mapping; confocal microscopy; diffeomorphic image registration.


Figures

Figure 1
Figure 1
Group-wise inter-sex atlas of Drosophila adult brain. (A) Central slice of individual male brain used in the construction of the template. (B) Magnified view of the green square in (A). (C) Central slice of inter-sex template created using the sharpened normalized average (default ANTs method). (D) Magnified view of the green square in (C). (E,F) Same as (C,D) for the inter-sex template created using the median. Scale bar: 50 μm. (G) 3D surface rendering of anatomical regions of the Ito et al. (2014) atlas following its registration on the median template (color scheme according to Ito et al., 2014). (H) 3D view of central template slice with overlay of Ito et al. (2014) atlas regions.
Figure 2
Figure 2
Segmentation performances of individual and group-wise templates. The graphs plot, for males (Top) and females (Bottom), the inverse standard error of the mean (s.e.m.) as a function of the mean of each segmentation metric, computed in the original space of test brains and over all anatomical regions. (A) Dice coefficient. (B) Average inter-surface Euclidean distance. (C) Maximum (symmetric Hausdorff) inter-surface distance. The single male and female brains used as individual templates are labeled as FN or MN. For each gender, Mean and Median design the mean and median intensity group-wise templates, respectively.
Figure 3
Figure 3
Registration performances of individual and group-wise templates. The graphs plot, for males (Top) and females (Bottom), the inverse standard error of the mean (s.e.m.) as a function of the mean of the Dice coefficient, computed in the template space and over all anatomical regions. The single male and female brains used as individual templates are labeled as FN or MN. For each gender, Mean and Median design the mean and median intensity group-wise templates, respectively.
Figure 4
Figure 4
Evaluation of inter-sex templates in segmentation (A–C) and registration (D) tasks. The graphs plot the inverse standard error of the mean (s.e.m.) as a function of the mean of each segmentation metric, computed over all anatomical regions either in the test brain spaces (A–C) or in the template spaces (D). (A,D) Dice coefficient. (B) Average Euclidean inter-surface distance. (C) Maximum (symmetric Hausdorff) inter-surface distance. The single male and female brains used as individual templates are labeled as FN or MN. Mean and Median are the mean and median intensity group-wise inter-sex templates, respectively.
Figure 5
Figure 5
Comparison of the performances of inter-sex and sex-specific templates in the segmentation task. The graphs plot, for each of the 14 anatomical regions, the difference between the average Dice coefficient computed with either the inter-sex or the sex-specific templates as a function of the Dice coefficient computed with the sex-specific template. (Left) Males; (Right) Females. Error-bars: s.e.m.
Figure 6
Figure 6
Influence of the number of brains on inter-sex atlas performance in segmentation and registration tasks. Group-wise inter-sex atlases were created with an increasing number of brains. Performance was quantified by computing the average Dice coefficient of segmented anatomical regions of male and female test brains after segmentation (blue) or registration (orange). Performance measures were averaged over 10 repeats. Error bars: s.e.m.
Figure 7
Figure 7
Comparison with other templates (registration task). Dice coefficient obtained with our proposed group-wise templates (Median and Mean) and with other publicly available templates evaluated by registering female brains (Left), male brains (Middle), or both female and male brains (evaluation in template space). The male test set (Middle) was also used to evaluate the performance of an additional male-specific template (GifM) built using newly acquired nc82-stained samples. JFRC2010: single female template from the FlyLight database; FCWB: an inter-sex template that combines female and male brains from the FlyCircuit database; DmelF, DmelM, and DmelIS: symmetric group-wise female-specific, male-specific, and inter-sex templates, respectively, from Jefferis' lab.
Figure 8
Figure 8
Registration of gene expression patterns. (A) Z-projections of individual 3D image stacks showing nc82-staining (Gray), transgene expression pattern (Green), and manually delineated 3D axonal traces (Magenta). (B) Distribution of the normalized distances between axonal projections after registering nc82-stained sample brains from Clk6.1-gal4, Pdf-gal4, or cry-gal4(39) transgenic lines. Registration was performed using either the FlyLight template (JFRC2010), the Jefferis' lab symmetric inter-sex template (DmelIS), or our median-intensity inter-sex template (Median). The results of the statistical comparison (paired Wilcoxon test) between the JFRC2010 or DmelIS templates with the Median template are indicated as: ns, P > 0.05, *, P < 0.01, and ***, P < 0.001.
Figure 9
Figure 9
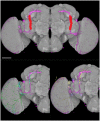
BrainGazer 3D space query over axonal tracts of five individual PDF-expressing sLNv profiles registered on the standard brain. (Top) The 3D space query brush tool is drawn (red) over one PDF profile (pink) in both brain hemispheres. (Bottom) The same PDF profile is shown with the four other PDF profiles on one hemisphere to illustrate individual variability. Scale bar: 50 μm.
Figure 10
Figure 10
Three Janelia Farm lines identified with the BrainGazer 3D space query using PDF-expressing sLNv axonal tracts as a query template. (Top) Overlay of the PDF (pink) and GAL4-driven GFP (green) profiles registered on the standard brain. (Middle) Overlap (red) between the PDF profile 1 and the GAL4-driven GFP profile (left), and co-labeling of anti-PDF (pink) and anti-GFP (green) shown in the overlap region (right). Bottom: co-labeling of anti-PDF (pink) and anti-GFP (green) shown for one hemisphere. Numbers refer to Janelia Farm lines with associated gene names. Scale bars: 50 μm (Top, Bottom) and 10 μm (Middle).

References

    1. Albert J. T., Göpfert M. C. (2015). Hearing in Drosophila. Curr. Opin. Neurobiol. 34, 79–85. 10.1016/j.conb.2015.02.001 - DOI - PMC - PubMed
    1. Anderson D. J. (2016). Circuit modules linking internal states and social behaviour in flies and mice. Nat. Rev. Neurosci. 17, 692–704. 10.1038/nrn.2016.125 - DOI - PubMed
    1. Auer T. O., Benton R. (2016). Sexual circuitry in Drosophila. Curr. Opin. Neurobiol. 38, 18–26. 10.1016/j.conb.2016.01.004 - DOI - PubMed
    1. Avants B. B., Epstein C. L., Grossman M., Gee J. C. (2008). Symmetric diffeomorphic image registration with cross-correlation: evaluating automated labeling of elderly and neurodegenerative brain. Med. Image Anal. 12, 26–41. 10.1016/j.media.2007.06.004 - DOI - PMC - PubMed
    1. Avants B. B., Tustison N. J., Song G., Cook P. A., Klein A., Gee J. C. (2011). A reproducible evaluation of ANTs similarity metric performance in brain image registration. NeuroImage 54, 2033–2044. 10.1016/j.neuroimage.2010.09.025 - DOI - PMC - PubMed

LinkOut - more resources