. 2017 Dec 6;9(1):88-99.
doi: 10.1039/c7sc04890d. eCollection 2018 Jan 7.

Polarisation effects on the solvation properties of alcohols

Affiliations

Polarisation effects on the solvation properties of alcohols

Stefan Henkel et al. Chem Sci. .

Abstract

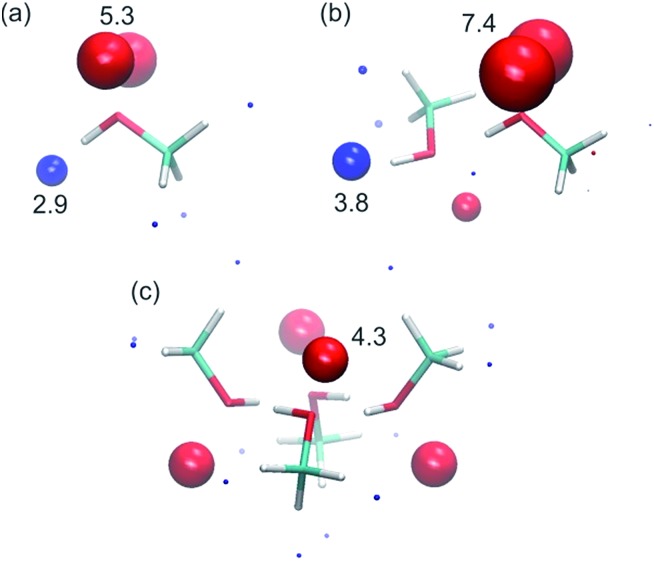
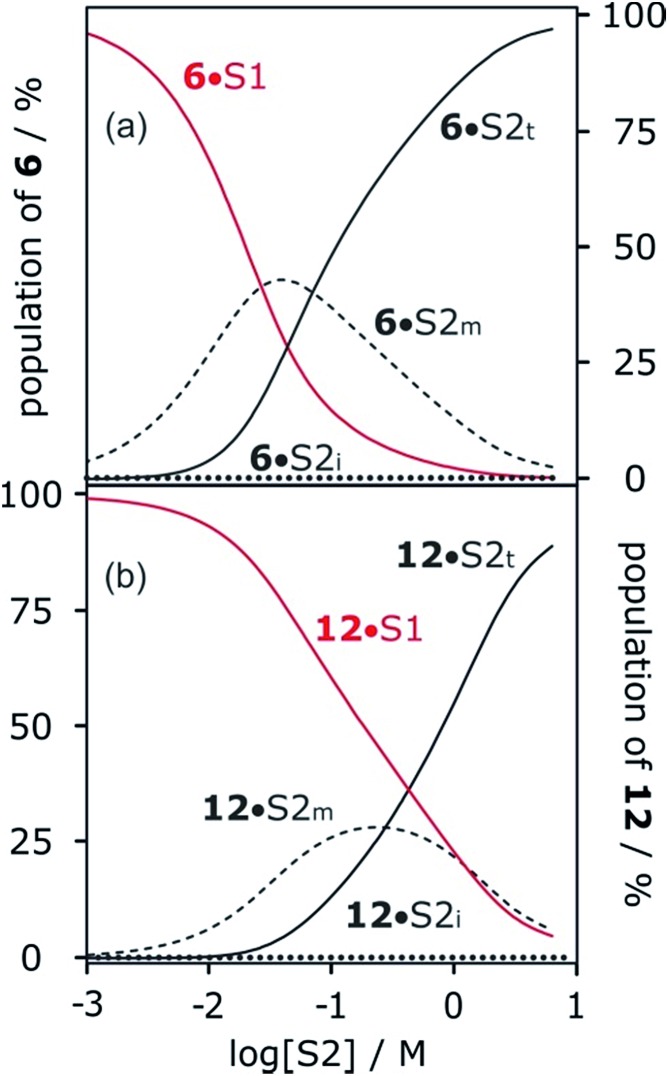
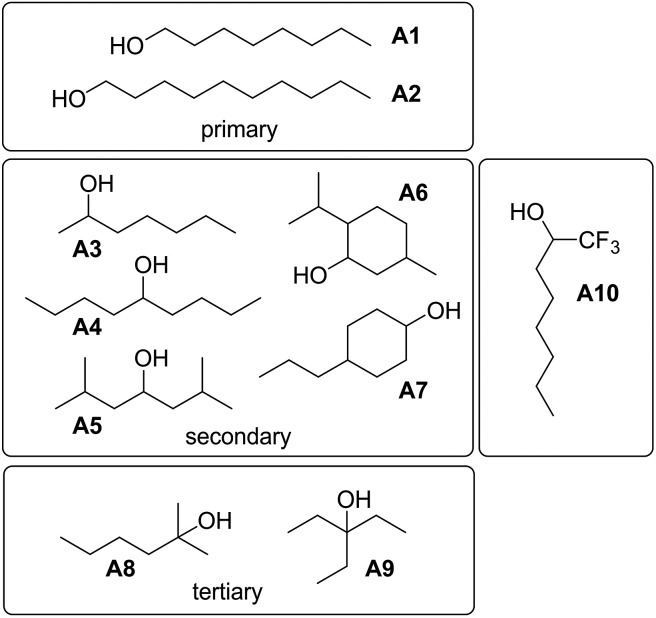
Alcohol solvents are significantly more polar than expected based on the measured H-bonding properties of monomeric alcohols in dilute solution. Self-association of alcohols leads to formation of cyclic aggregates and linear polymeric chains that have a different polarity from the alcohol monomer. Cyclic aggregates are less polar than the monomer, and the chain ends of linear polymers are more polar. The solvation properties of alcohols therefore depend on the interplay of these self-association equilibria and the equilibria involving interactions with solutes. Twenty-one different molecular recognition probes of varying polarity were used to probe the solvation properties of alkane-alcohol mixtures across a wide range of different solvent compositions. The results allow dissection of the complex equilibria present in these systems. Formation of a H-bond between two alcohol molecules leads to polarisation of the hydroxyl groups, resulting in an increase in binding affinity for subsequent interactions with the unbound donor and acceptor sites. The H-bond donor parameter (α) for these sites increases from 2.7 to 3.5, and the H-bond acceptor parameter (β) increases from 5.3 to 6.9. Polarisation is a short range effect limited to the first H-bond in a chain, and formation of subsequent H-bonds in longer chains does not further increase the polarity of chain ends. H-bond donor sites involved in a H-bond are unavailable for further interactions, because the formation of a bifurcated three-centre H-bond is three orders of magnitude less favourable than formation of a conventional two-centre H-bond. These findings are reproduced by quantum chemical calculations of the molecular electrostatic potential surfaces of alcohol aggregates. Thus, the overall solvation properties of alcohols depend on the speciation of different aggregates, the polarities of these species and the polarities of the solutes. At low alcohol concentrations, polar solutes are solvated by alcohol monomers, and at higher alcohol concentrations, solutes are solvated by the more polar chain ends of linear polymers. The less polar cyclic aggregates are less important for interactions with solutes. Similar behavior was found for ten different alcohol solvents. Tertiary alcohols are marginally less polar solvents than primary alcohols, due to steric interactions that destabilises the formation of polymeric aggregates leading to lower concentrations of polar chain ends. One alcohol with an electron-withdrawing substituent was studied, and this solvent showed slightly different behavior, because the H-bond donor and acceptor properties are different.


Figures

Fig. 1
Fig. 1. Schematic representation of the electrostatic solvent competition model. The free energy of interaction between acceptor (A) and donor (D) solutes can be estimated from the H-bond parameters of the solutes (α, β) and of the solvent (αS, βS) according to eqn (1).
Fig. 2
Fig. 2. Dependence of the association constant (log K) for formation of a 1 : 1 complex between a H-bond donor and acceptor on the concentration of a polar solvent (S2) in a non-polar solvent (S1). log KS1 is the D·A association constant in pure S1, and log KD and log KA are the D·S2 and A·S2 association constants in pure S1.
Fig. 3
Fig. 3. (a) Proposed bifurcated H-bond formed between an alcohol aggregate and a H-bond acceptor (A). (b) The two possible binding modes of 1 with a H-bond acceptor. Breaking the intramolecular H-bond in the three-site bifurcated H-bond would allow formation of a conventional two-site H-bond. (c) The two possible binding modes of 2 with a H-bond acceptor (A) both involve a bifurcated H-bond. (d) Reference phenols 3–5 that do not make intramolecular H-bonds.
Fig. 4
Fig. 4. Molecular recognition probes with values of the H-bond parameters, β and α. (a) H-bond acceptors (β). (b) H-bond donors (α).
Fig. 5
Fig. 5. Association constants (log K/M–1) for formation of 1 : 1 complexes between H-bond donor 13 and different H-bond acceptors as a function of concentration of 1-octanol (S2) in n-octane (S1) at 298 K. Acceptors are (a) 6, (b) 7, (c) 8, (d) 9, (e) 10, (f) 11, (g) 12.
Fig. 6
Fig. 6. Association constants (log K/M–1) for formation of 1 : 1 complexes between H-bond acceptor 6 (upper row) or 7 (lower row) and different H-bond donors as a function of concentration of 1-octanol (S2) in n-octane (S1) at 298 K. Donors are (a) 13, (b) 14, (c) 15.
Fig. 7
Fig. 7. Self-association of alcohols into dimers, linear and cyclic aggregates.
Fig. 8
Fig. 8. (a) Viscosity of 1-octanol in n-octane. (b) Apparent dipole moment of 1-octanol in cyclohexane. (c) Population of monomeric 1-octanol in n-octane and in n-decane measured by IR spectroscopy., Black lines in (b) and (c) correspond to fits of the experimental data to eqn (3)–(5) with αcoop = 9, Kn = 5 M–1 and Kc = 500 M–3. The grey lines show the populations of alcohol present as linear aggregates (solid line) and as cyclic tetramers (dashed line).
Fig. 9
Fig. 9. Different types of H-bond donor and acceptor site present in an alcohol solution. The internal H-bonded sites of linear and cyclic aggregates are considered to have similar properties.
Fig. 10
Fig. 10. Association constants (log K/M–1) for formation of the 7·13 complex as a function of concentration of 1-octanol (S2) in n-octane (S1) at 298 K. The corresponding values calculated values using eqn (1)–(7) are shown for two different representations of the H-bond properties of alcohol aggregates: (a) internal OH donor sites blocked and all other sites the same as the monomer (αi = 0, αt = αm = 2.7 and βi = βt = βm = 5.3); (b) internal OH donor sites blocked, internal OH acceptor sites the same as the monomer, and more polar terminal sites (αi = 0, αt = 3.5, αm = 2.7 and βi = 5.3, βt = 6.9, βm = 5.3).
Fig. 11
Fig. 11. SSIP representation of (a) a methanol monomer, (b) a methanol dimer and (c) a methanol cyclic tetramer. Values of the H-bond parameters are shown for the most polar SSIPs (α blue sites, and β red sites).
Fig. 12
Fig. 12. (a) Speciation of alcohol monomer (S2m), internal (S2i) and terminal (S2t) H-bonding sites in mixtures of 1-octanol (S2) and n-octane (S1). (b) Speciation of solvation states of H-bond acceptor solute 6 in mixtures of 1-octanol (S2) and n-octane (S1): 6·S1 solid red line; 6·S2m dashed line; 6·S2i dotted line; 6·S2t solid black line. (c) Speciation of solvation states of H-bond donor solute 13 in mixtures of 1-octanol (S2) and n-octane (S1): 13·S1 solid blue line; 13·S2m dashed line; 13·S2i dotted line; 13·S2t solid black line. Calculated using the following H-bond parameters for S2: αi = 0, αt = 3.5, αm = 2.7 and βi = 5.3, βt = 6.9, βm = 5.3.
Fig. 13
Fig. 13. Speciation of two different H-bond acceptors (A) in mixtures of 1-octanol (S2) and n-octane (S1). (a) 6 (β = 10.7). (b) 12 (β = 7.8). A·S1 solid red lines; A·S2m dashed lines; A·S2i dotted lines; A·S2t solid black lines. Calculated using the following H-bond parameters for S2: αi = 0, αt = 3.5, αm = 2.7 and βi = 5.3, βt = 6.9, βm = 5.3.
Fig. 14
Fig. 14. Alcohols A1–A10 used as S2 in mixed solvent titrations.
Fig. 15
Fig. 15. (a) 1H NMR dilution data for 1-decanol A2 in d12-cyclohexane (black) and for 3-ethyl-3-pentanol A9 in n-octane (blue). [S2] is the concentration of the alcohol. Points represent the change in the 1H NMR chemical shift of the signal due to the OH group as a function of alcohol concentration. Solid lines are fits of the experimental data with αcoop = 13, Kn = 7 M–1 and Kc = 590 M–3 for A2 and αcoop = 6, Kn = 2 M–1 and Kc = 7 M–3 for A9. (b) The corresponding speciation profiles are shown for comparison (dotted line, monomers; solid line, linear polymers; dashed line, cyclic tetramers).
Fig. 16
Fig. 16. Association constants (log K/M–1) for formation of the 6·13 complex as a function of alcohol concentration (S2) in n-octane (S1) at 298 K. Data highlighted are 1-octanol A1 (black), 3-ethyl-3-pentanol A9 (blue) and trifluoromethyl-2-octanol A10 (red).

References

    1. Abraham M. H., Grellier P. L., Prior D. V., Duce P. P., Morris J. J., Taylor P. J. J. Chem. Soc., Perkin Trans. 2. 1989;(6):699–711.
    1. Abraham M. H., Grellier P. L., Prior D. V., Morris J. J., Taylor P. J. J. Chem. Soc., Perkin Trans. 2. 1990;4:521–529.
    1. Hunter C. A. Angew. Chem., Int. Ed. 2004;43(40):5310–5324. - PubMed
    1. Abraham M. H., Buist G. J., Grellier P. L., McGill R. A., Prior D., Oliver S., Turner E., Morris J. J., Taylor P. J., Nicolet P., Maria P. C., Gal J. F., Abboud J. L. M., Doherty R. M., Kamlet M. J., Shuely W. J., Taft R. W. J. Phys. Org. Chem. 1989;2(7):540–552.
    1. Cabot R., Hunter C. A. Chem. Soc. Rev. 2012;41(9):3485–3492. - PubMed

LinkOut - more resources