. 2017 Oct 31;9(2):513-530.
doi: 10.1039/c7sc02664a. eCollection 2018 Jan 14.

MoleculeNet: a benchmark for molecular machine learning

Affiliations

MoleculeNet: a benchmark for molecular machine learning

Zhenqin Wu et al. Chem Sci. .

Abstract

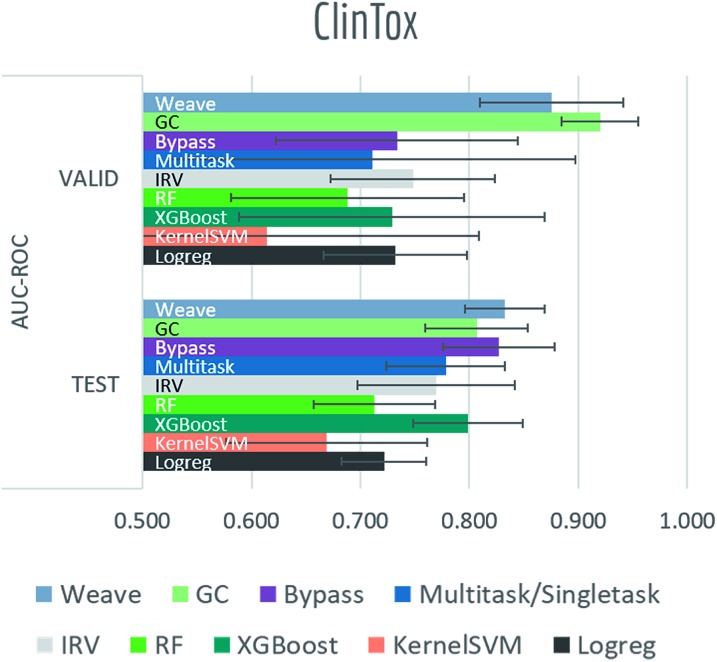
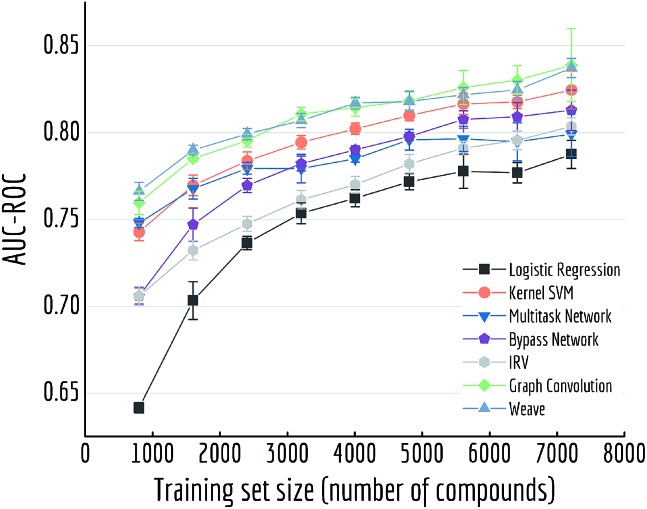
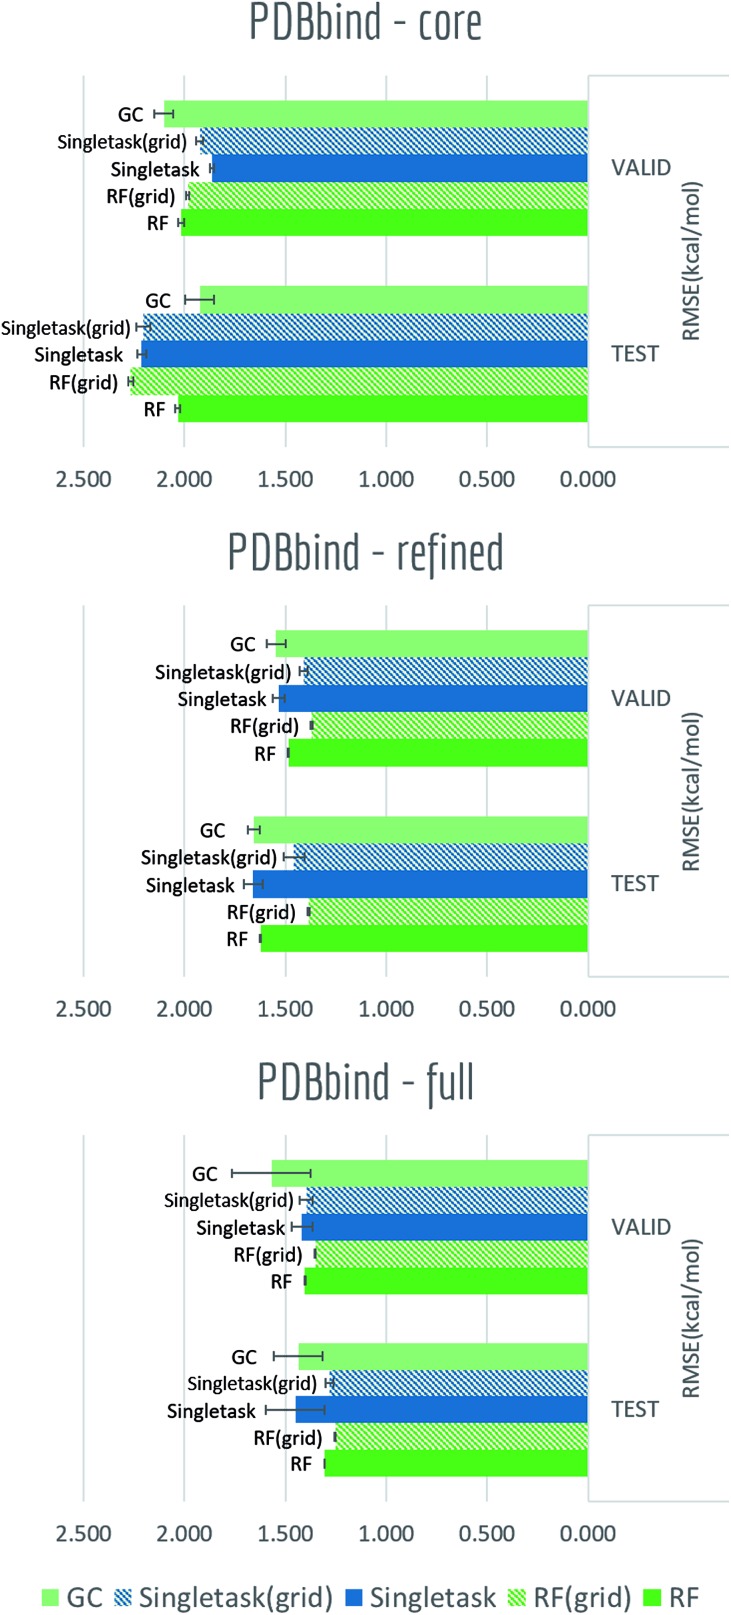
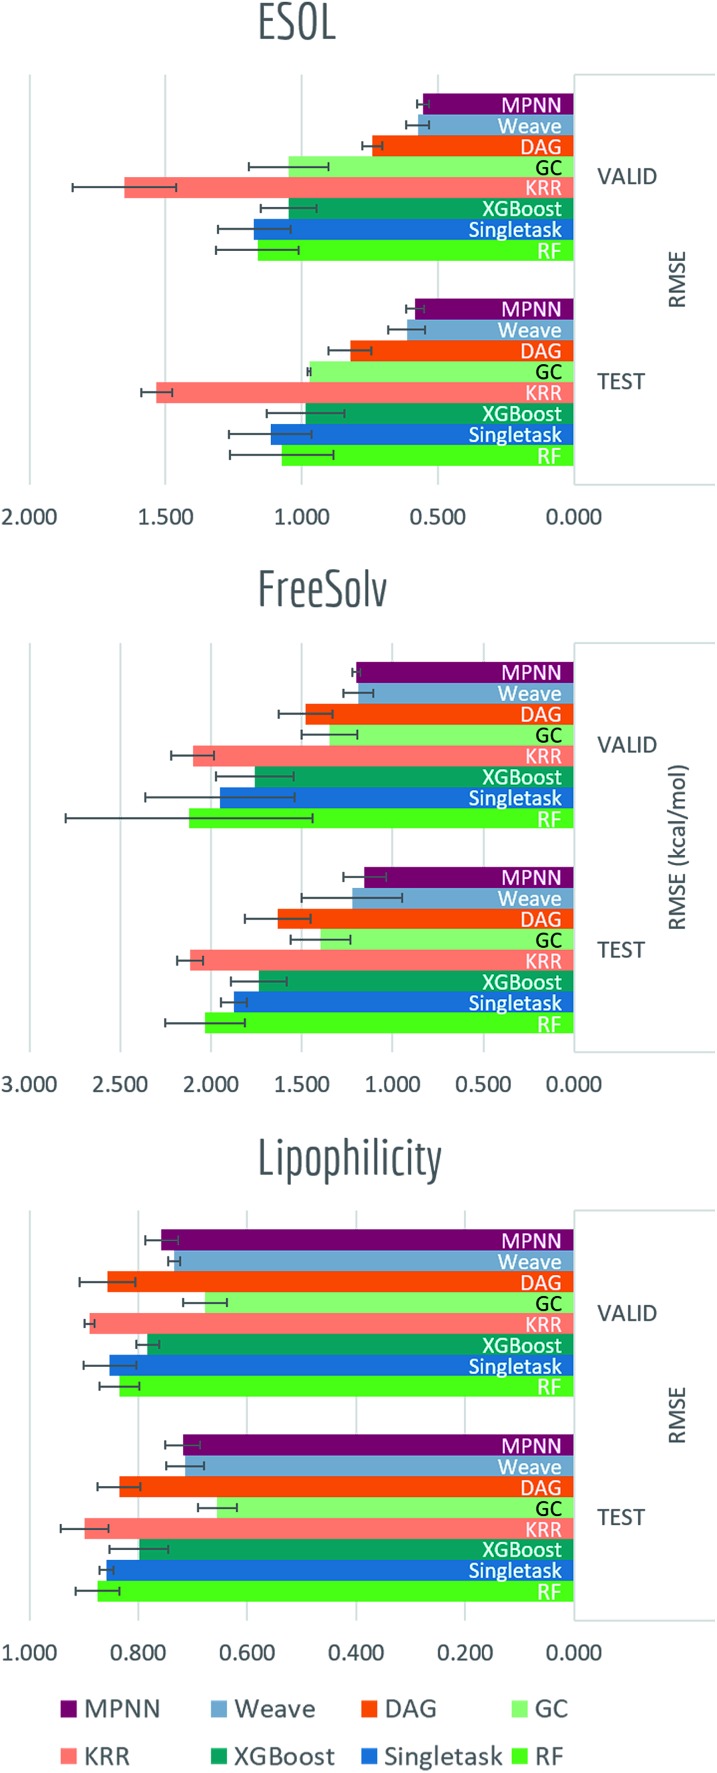
Molecular machine learning has been maturing rapidly over the last few years. Improved methods and the presence of larger datasets have enabled machine learning algorithms to make increasingly accurate predictions about molecular properties. However, algorithmic progress has been limited due to the lack of a standard benchmark to compare the efficacy of proposed methods; most new algorithms are benchmarked on different datasets making it challenging to gauge the quality of proposed methods. This work introduces MoleculeNet, a large scale benchmark for molecular machine learning. MoleculeNet curates multiple public datasets, establishes metrics for evaluation, and offers high quality open-source implementations of multiple previously proposed molecular featurization and learning algorithms (released as part of the DeepChem open source library). MoleculeNet benchmarks demonstrate that learnable representations are powerful tools for molecular machine learning and broadly offer the best performance. However, this result comes with caveats. Learnable representations still struggle to deal with complex tasks under data scarcity and highly imbalanced classification. For quantum mechanical and biophysical datasets, the use of physics-aware featurizations can be more important than choice of particular learning algorithm.


Figures

Fig. 1
Fig. 1. Example code for benchmark evaluation with DeepChem, multiple methods are provided for data splitting, featurization and learning.
Fig. 2
Fig. 2. Tasks in different datasets focus on different levels of properties of molecules.
Fig. 3
Fig. 3. Representation of data splits in MoleculeNet.
Fig. 4
Fig. 4. Receiver operating characteristic (ROC) curves and precision recall curves (PRC) for predictions of logistic regression and graph convolutional models under different class imbalance condition (details listed in Table 2). (A, B) task “FDA_APPROVED” from ClinTox, test subset; (C, D) task “Hepatobiliary disorders” from SIDER, test subset; (E, F) task “NR-ER” from Tox21, validation subset; (G, H): task “HIV_active” from HIV, test subset. Black dashed lines are performances of random classifiers.
Fig. 5
Fig. 5. Diagrams of featurizations in MoleculeNet.
Fig. 6
Fig. 6. Core structures of graph-based models implemented in MoleculeNet. To build features for the central dark green atom: (A) graph convolutional model: features are updated by combination with neighbour atoms; (B) directed acyclic graph model: all bonds are directed towards the central atom, features are propagated from the farthest atom to the central atom through directed bonds; (C) Weave model: pairs are formed between each pair of atoms (including not directly bonded pairs), features for the central atom are updated using all other atoms and their corresponding pairs, pair features are also updated by combination of the two pairing atoms; (D) message passing neural network: neighbour atoms' features are input into bondtype-dependent neural networks, forming outputs (messages). Features of the central atom are then updated using the outputs; (E) deep tensor neural network: no explicit bonding information is included, features are updated using all other atoms based on their corresponding physical distances; (F) ANI-1: features are built on distance information between pairs of atoms (radial symmetry functions) and angular information between triplets of atoms (angular symmetry functions).
Fig. 7
Fig. 7. Benchmark performances for biophysics tasks: PCBA, 4 models are evaluated by AUC-PRC on random split; MUV, 8 models are evaluated by AUC-PRC on random split; HIV, 8 models are evaluated by AUC-ROC on scaffold split; BACE, 9 models are evaluated by AUC-ROC on scaffold split. For AUC-ROC and AUC-PRC, higher value indicates better performance (to the right).
Fig. 8
Fig. 8. Benchmark performances for physiology tasks: ToxCast, 8 models are evaluated by AUC-ROC on random split; Tox21, 9 models are evaluated by AUC-ROC on random split; BBBP, 9 models are evaluated by AUC-ROC on scaffold split; SIDER, 9 models are evaluated by AUC-ROC on random split. For AUC-ROC, higher value indicates better performance (to the right).
Fig. 9
Fig. 9. Benchmark performances for physiology tasks: ClinTox, 9 models are evaluated by AUC-ROC on random split.
Fig. 10
Fig. 10. Out-of-sample performances with different training set sizes on Tox21. Each datapoint is the average of 5 independent runs, with standard deviations shown as error bars.
Fig. 11
Fig. 11. Benchmark performances of PDBbind: 5 models are evaluated by RMSE on the three subsets: core, refined and full. Time split is applied to all three subsets. Noe that for RMSE, lower value indicates better performance (to the right).
Fig. 12
Fig. 12. Benchmark performances for physical chemistry tasks: ESOL, 8 models are evaluated by RMSE on random split; FreeSolv, 8 models are evaluated by RMSE on random split; lipophilicity, 8 models are evaluated by RMSE on random split. Note that for RMSE, lower value indicates better performance (to the right).
Fig. 13
Fig. 13. Out-of-sample performances with different training set sizes on FreeSolv. Each datapoint is the average of 5 independent runs, with standard deviations shown as error bars.
Fig. 14
Fig. 14. Out-of-sample performances with different training set sizes on QM7. Each datapoint is the average of 5 independent runs, with standard deviations shown as error bars.
Fig. 15
Fig. 15. Benchmark performances for quantum mechanics tasks: QM7, 8 models are evaluated by MAE on stratified split; QM7b, 3 models (QM7b only provides 3D coordinates) are evaluated by MAE on random split; QM8, 7 models are evaluated by MAE on random split; QM9, 5 models are evaluated by MAE on random split. Note that for MAE, lower value indicates better performance (to the right).

References

    1. Gasteiger J., Zupan J. Angew. Chem., Int. Ed. 1993;32:503–527.
    1. Zupan J. and Gasteiger J., Neural networks in chemistry and drug design, John Wiley & Sons, Inc., 1999.
    1. Varnek A., Baskin I. J. Chem. Inf. Model. 2012;52:1413–1437. - PubMed
    1. Mitchell J. B. Wiley Interdiscip. Rev.: Comput. Mol. Sci. 2014;4:468–481. - PMC - PubMed
    1. Devillers J., Neural networks in QSAR and drug design, Academic Press, 1996.