Comparative Study
. 2018 Apr 9;13(4):e0195272.
doi: 10.1371/journal.pone.0195272. eCollection 2018.

ERASE-Seq: Leveraging replicate measurements to enhance ultralow frequency variant detection in NGS data

Affiliations
Comparative Study

ERASE-Seq: Leveraging replicate measurements to enhance ultralow frequency variant detection in NGS data

Nick Kamps-Hughes et al. PLoS One. .

Abstract

The accurate detection of ultralow allele frequency variants in DNA samples is of interest in both research and medical settings, particularly in liquid biopsies where cancer mutational status is monitored from circulating DNA. Next-generation sequencing (NGS) technologies employing molecular barcoding have shown promise but significant sensitivity and specificity improvements are still needed to detect mutations in a majority of patients before the metastatic stage. To address this we present analytical validation data for ERASE-Seq (Elimination of Recurrent Artifacts and Stochastic Errors), a method for accurate and sensitive detection of ultralow frequency DNA variants in NGS data. ERASE-Seq differs from previous methods by creating a robust statistical framework to utilize technical replicates in conjunction with background error modeling, providing a 10 to 100-fold reduction in false positive rates compared to published molecular barcoding methods. ERASE-Seq was tested using spiked human DNA mixtures with clinically realistic DNA input quantities to detect SNVs and indels between 0.05% and 1% allele frequency, the range commonly found in liquid biopsy samples. Variants were detected with greater than 90% sensitivity and a false positive rate below 0.1 calls per 10,000 possible variants. The approach represents a significant performance improvement compared to molecular barcoding methods and does not require changing molecular reagents.


Conflict of interest statement

Competing Interests: The authors are employed by Fluxion Biosciences, Swift Biosciences and Illumina. No individual authors received specific funding for this work. The affiliated companies provided support in the form of salaries for authors NKH, CIZ (Fluxion Biosciences), AM, LH, TH (Swift Biosciences), PP and CR (Illumina). The respective companies did not have any additional role in the study design, data collection and analysis, decision to publish, or preparation of the manuscript. The specific roles of these authors are articulated in the 'author contributions' section. Authors of this paper declare that their employment did not affect their interpretation of the scientific data. This does not alter our adherence to PLOS ONE policies on sharing data and materials.

Figures

Fig 1
Fig 1. ERASE-Seq concept and method.
(A) ERASE-Seq distinguishes true DNA variants from false positives by statistically comparing presence across a series of sample and control technical replicates. False positives arising from recurrent artifacts at error-prone loci (blue squares) are eliminated based on their presence in control replicates. False positives arising from stochastic errors (lined blue squares) are eliminated by inconsistent signal in sample replicates. This allows highly precise detection of true positives (dark blue squares) in final variant calls. (B) The ERASE-Seq molecular workflow is easily applied to amplicon panels by simply preparing and sequencing technical replicates of sample and control DNA in the same fashion they are already being used. Control DNA replicates only need to be generated and sequenced once and can be reused with subsequent samples. (C) The ERASE-Seq bioinformatics workflow begins with BAM file generation and processing of each library replicate. All base calls above a base quality threshold are used to create a pileup for each replicate. ERASE-Seq software converts the replicate pileups to a data matrix representing quantized allele frequencies for each variant in each replicate. The variant data matrix is analyzed using R in order to identify variants that are significantly enriched in sample versus control sequencing runs. These variants are then filtered by strand bias and allele frequency to produce a final set of low frequency somatic variant calls in VCF format.
Fig 2
Fig 2. False positive composition.
(A,B) The number of false positive calls in 0.05% allele frequency intervals is shown for ERASE-Seq using 1, 2, 3, and 4 replicates for the amplicon panels 56G and TST15. (C,D) The number of false positives using standard intra-sample variant calling metrics (base-quality, strand-bias and read-depth filters) are shown in 0.05% allele frequency intervals for 56G and TST15. They are further divided into recurrent artifacts and stochastic errors. Stochastic errors are those called in single replicate ERASE-Seq and recurrent artifacts are those eliminated in single replicate ERASE-Seq based on the background model.
Fig 3
Fig 3. Error reduction using ERASE-Seq.
Low frequency variants observed in three analytical DNA spikes mixtures are shown both by allele frequency in the top panel and by ERASE-Seq multiple hypothesis adjusted p-value in the bottom panel. True positives are shown in red and noise is shown in black. (A,D) A spiked DNA mixture is analyzed using the Swift Biosciences 56G amplicon panel. The 19 snvs and one indel ranging from 0.27–1.78% expected allele frequency are detected with perfect sensitivity and specificity using ERASE-Seq. (B,E) A spiked DNA mixture is analyzed using the Illuimina TruSight 15 amplicon panel. The 30 snvs and one indel ranging from 0.35–5.6% expected allele frequency are detected with perfect sensitivity and specificity using ERASE-Seq. (C,F) A more challenging spiked DNA mixture is analyzed using the Illuimina TruSight 15 amplicon panel. The 30 snvs and one indel range from 0.07–1.3% expected allele frequency. All variants above 0.3% allele frequency are detected with perfect sensitivity and specificity and robust detection of ultra-low frequency alleles is achieved with a small number of false positives.
Fig 4
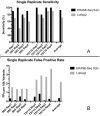
Fig 4. Single replicate ERASE-Seq performance.
The ERASE-Seq algorithm may also be used with single replicates to eliminate false positives resulting from recurrent artifacts. This fig demonstrates ERASE Seq’s large gains in resolution below 1% allele frequency as compared to Lofreq2, a high-performing standard low frequency calling algorithm that does not model background errors and therefore does not eliminate recurrent artifacts. Sensitivity in the 0.3–1% allele frequency range is shown along with false positive rate for four analytical samples using the TST15 amplicon panel and four analytical samples using the 56G amplicon panel. ERASE-Seq provides an average increase in sensitivity from 71% to 93% and a greater than six-fold reduction in false positive rate as compared to Lofreq2.
Fig 5
Fig 5. Observed vs expected allele frequencies.
ERASE-Seq demonstrates high reproducibility (R-squared = 0.961) in allele frequency determination between experiments, even in the ultralow allele frequency range. This graph compares measured allele frequencies between the 1% TST15 spike and the 0.25% TST15 spike. The 0.25% spike is a simple 4X dilution of the 1% spike into the same NA19129 DNA background so variant allele frequencies in the 0.25% spike are expected to be ¼ their value in the 1% spike. The y-axis plots observed variant allele frequencies in the 0.25% spike and the x-axis plots their expected values.
Fig 6
Fig 6. Robustness of the ERASE-Seq approach across different sample types.
We analyzed a previously produced data set looking at a Horizon cfDNA standard spike (fragmented DNA) using both an unrelated gDNA background standard and a more similar Horizon cfDNA standard. The false positive rate per 10,000 variant tests is plotted for all conditions. ERASE-Seq results from applying a background model using either background (empty triangle, circle) show a high reduction in the false positive rate for both as compared to a standard caller (filled round). Of the two, using a similar Horizon cfDNA background (empty circles) provides slightly better error correction, while both perform very well above 0.5% allele frequency. The same relationship holds when using two replicates for the Horizon cfDNA sample (square, rhombus), with very low false positive rates above 0.2%. Together, the data demonstrate consistent performance of the background model across sample types. A summary of the false positive rate dependence on the replicate number and control background data used is shown in S6 Table.

References

    1. Rehm HL. Disease-targeted sequencing: a cornerstone in the clinic. Nat Rev Genet. 2013;14(4):295–300. doi: 10.1038/nrg3463 - DOI - PMC - PubMed
    1. Boycott KM, Vanstone MR, Bulman DE, MacKenzie AE. Rare-disease genetics in the era of next-generation sequencing: discovery to translation. Nat Rev Genet. 2013;14(10):681–91. doi: 10.1038/nrg3555 . - DOI - PubMed
    1. Stadler ZK, Schrader KA, Vijai J, Robson ME, Offit K. Cancer genomics and inherited risk. J Clin Oncol. 2014;32(7):687–98. doi: 10.1200/JCO.2013.49.7271 . - DOI - PMC - PubMed
    1. Perera MA, Gamazon E, Cavallari LH, Patel SR, Poindexter S, Kittles RA, et al. The missing association: sequencing-based discovery of novel SNPs in VKORC1 and CYP2C9 that affect warfarin dose in African Americans. Clin Pharmacol Ther. 2011;89(3):408–15. doi: 10.1038/clpt.2010.322 - DOI - PMC - PubMed
    1. Frampton GM, Fichtenholtz A, Otto GA, Wang K, Downing SR, He J, et al. Development and validation of a clinical cancer genomic profiling test based on massively parallel DNA sequencing. Nat Biotechnol. 2013;31(11):1023–31. doi: 10.1038/nbt.2696 . - DOI - PMC - PubMed

Publication types

MeSH terms