. 2018 Jul:67:53-66.
doi: 10.1016/j.neurobiolaging.2018.03.009. Epub 2018 Mar 16.

Caloric restriction mitigates age-associated hippocampal differential CG and non-CG methylation

Affiliations

Caloric restriction mitigates age-associated hippocampal differential CG and non-CG methylation

Niran Hadad et al. Neurobiol Aging. 2018 Jul.

Abstract

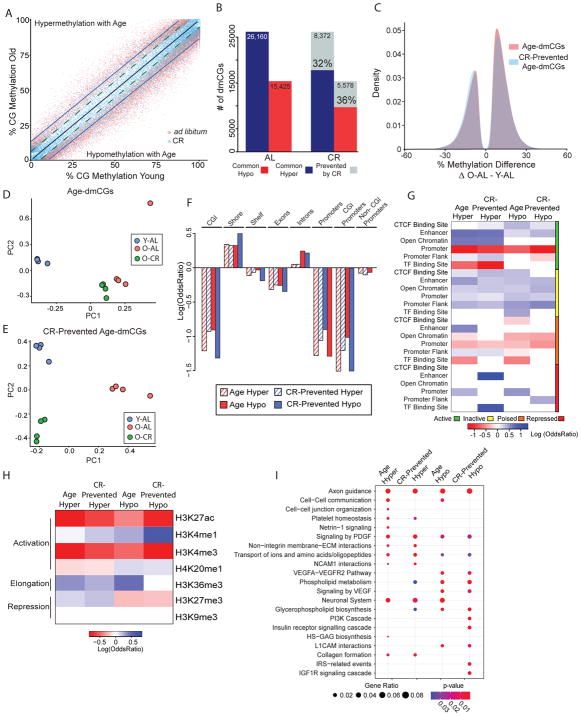
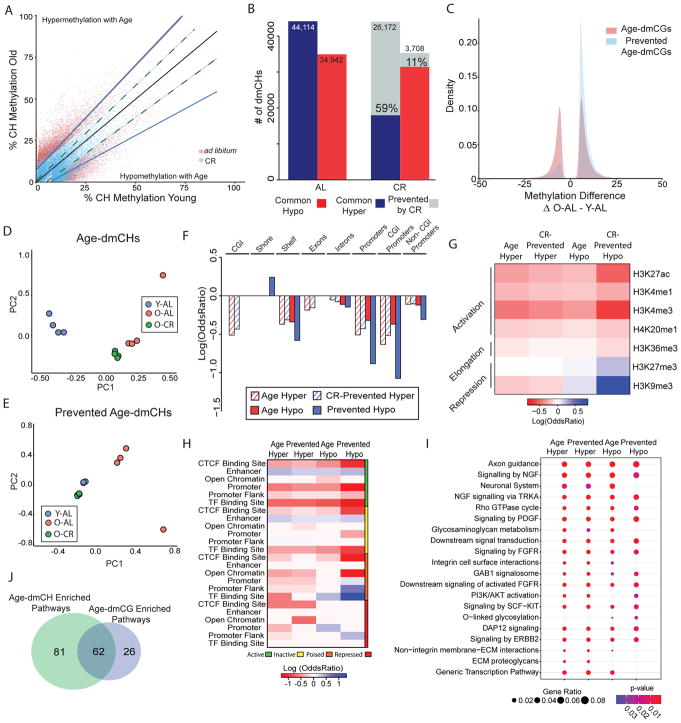
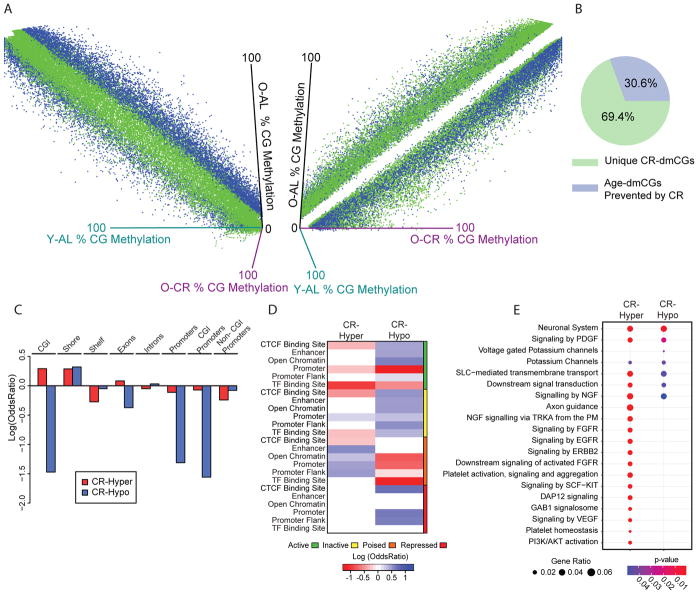
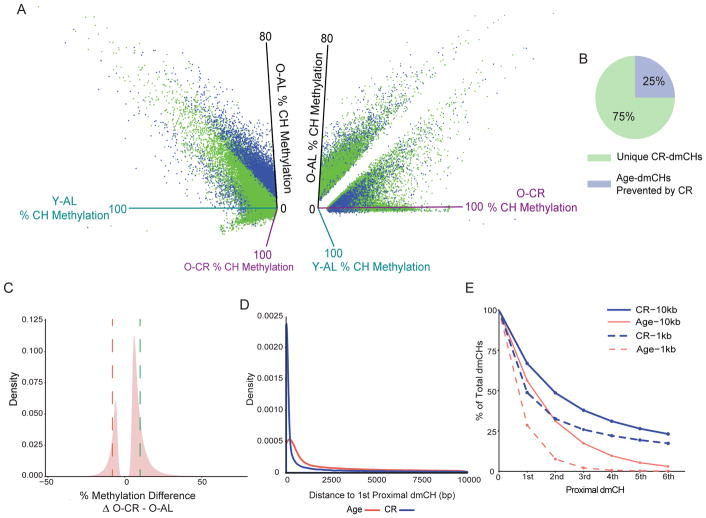
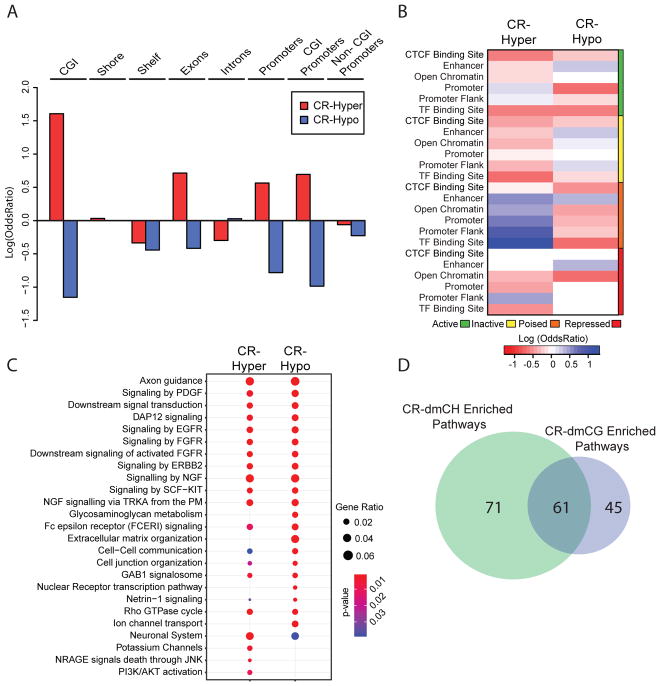
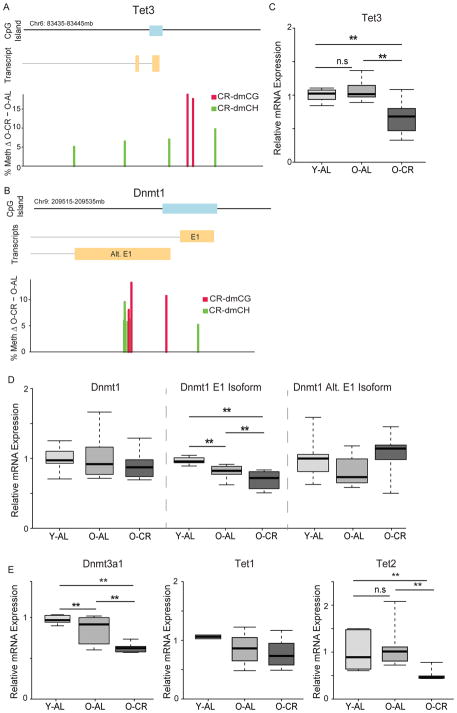
Brain aging is marked by cognitive decline and susceptibility to neurodegeneration. Calorie restriction (CR) increases neurogenesis, improves memory function, and protects from age-associated neurological disorders. Epigenetic mechanisms, including DNA methylation, are vital to normal central nervous system cellular and memory functions and are dysregulated with aging. The beneficial effects of CR have been proposed to work through epigenetic processes, but this is largely unexplored. We therefore tested whether life long CR prevents age-related hippocampal DNA methylation changes. Hippocampal DNA from young (3 months) and old (24 months) male mice fed ad libitum and 24-month-old mice fed a 40% calorie-restricted diet from 3 months of age were examined by genome-wide bisulfite sequencing to measure methylation with base specificity. Over 27 million CG and CH (non-CG) sites were examined. Of the ∼40,000 differentially methylated CG and ∼80,000 CH sites with aging, >1/3 were prevented by CR and were found across genomic regulatory regions and gene pathways. CR also caused alterations to CG and CH methylation at sites not differentially methylated with aging, and these CR-specific changes demonstrated a different pattern of regulatory element and gene pathway enrichment than those affected by aging. CR-specific DNA methyltransferase 1 and Tet methylcytosine dioxygenase 3 promoter hypermethylation corresponded to reduced gene expression. These findings demonstrate that CR attenuates age-related CG and CH hippocampal methylation changes, in combination with CR-specific methylation that may also contribute to the neuroprotective effects of CR. The prevention of age-related methylation alterations is also consistent with the prolongevity effects of CR working through an epigenetic mechanism.

Keywords: Aging; Caloric restriction; DNA methylation; Epigenetics; Hippocampus.


Conflict of interest statement

Conflict of interest: The authors declare no competing financial interests

Figures

Figure 1
Figure 1
Caloric-restriction prevents age-associated differential CG methylation. (A) Scatterplot depicting significant age-dmCG (n = 41,585, adjusted p-value < 0.05 & methylation difference between Old-AL and Young-AL > |5%|) methylation differences between young ad libitum (Y-AL) and old ad libitum (O-AL) groups (red dots) and young ad libitum (Y-AL) and old calorie-restricted (O-CR) groups (blue dots). Linear regression lines pass through Y-AL ~ Y-AL (black), O-AL ~ Y-AL (blue) and O-CR ~ Y-AL (dotted green) age-dmCG methylation values separated by hyper- and hypo- age-dmCGs. (B) Quantification of the number of age-dmCGs by hypermethylation (blue) and hypomethylation (red) in animals fed ad libitum (AL) or calorie-restricted (CR). Grey indicates age-dmCGs prevented by caloric-restriction (n=13,950). (C) Density plot of age-dmCGs (red) and prevented age-dmCGs (blue). PCA plots of mice by age-dmCGs (D) and prevented age-dmCGs (E). (F) Enrichment of age-dmCGs and prevented age-dmCGs in gene-regulatory regions. Red and blue indicate significant under-representation or over-representation (p < 0.05, hypergeometric test) respectively, while white shows no significance (p > 0.05). (G) Enrichment of age-dmCGs and prevented age-dmCGs in gene-centric regions, only significant enrichment is shown (p < 0.05, hypergeometric test). (H) Enrichment of age-dmCGs and prevented age-dmCGs in annotated histone marks from the adult mouse hippocampus. Red and blue indicate significant under-representation or over-representation (p < 0.05, hypergeometric test) respectively, while white shows no significance (p > 0.05). (I) Pathway analysis of genes containing significant age-dmCGs or prevented age-dmCGs. Top enrichment pathways are shown (FDR adjusted p-values < 0.05). Circle size indicates the ratio of genes containing age-dmCGs or prevented age-dmCGs in a pathway, color indicates p-values.
Figure 2
Figure 2
Caloric-restriction prevents age-associated differential CH methylation. (A) Scatterplot depicting significant age-dmCH (n = 79,056, adjusted p < 0.05 & methylation difference between Old-AL and Young-AL > |5%|) methylation differences between young ad libitum (Y-AL) and old ad libitum (O-AL) groups (red dots) and young ad lib (Y-AL) and old calorie-restricted (O-CR) groups (blue dots). Linear regression lines pass through Y-AL ~ Y-AL (black), O-AL ~ Y-AL (blue) and O-CR ~ Y-AL (dotted green) age-dmCH methylation values separated by hyper- and hypo- age-dmCHs. (B) Quantification of the number of age-dmCHs by hypermethylation (blue) and hypomethylation (red) in animals fed ad libitum (AL) or calorie-restricted (CR). Grey indicates age-dmCHs prevented by caloric-restriction (n = 29,880). (C) Distribution plot of age-dmCHs (red) and prevented age-dmCHs (blue). PCA plots of samples by age-dmCHs (D) and prevented age-dmCHs (E). (F) Enrichment of age-dmCHs and prevented age-dmCHs in gene-centric regions, only significant enrichments are shown (p < 0.05, hypergeometric test). (G) Enrichment of age-dmCHs and prevented age-dmCHs in annotated histone marks from the adult mouse hippocampus. Red and blue indicate significant under-representation or over-representation (p < 0.05, hypergeometric test) respectively, while white shows no significance (p > 0.05). (H) Enrichment of age-dmCHs and prevented age-dmCHs in gene-regulatory regions. Red and blue indicate significant under-representation or over-representation (p < 0.05, hypergeometric test) respectively, while white shows no significance (p > 0.05). (I) Pathway analysis of genes containing significant age-dmCHs or prevented age-dmCHs. Top enrichment pathways are shown (FDR adjusted p-values < 0.05). Circle size indicates the ratio of genes containing >2 age-dmCHs or prevented age-dmCHs in a pathway, color indicates p-values. (J) Overlap between pathways enriched for age-dmCHs and age-dmCGs.
Figure 3
Figure 3
CR induces changes in CG methylation independent of aging. (A) Left: 3D scatterplot showing the methylation levels of significant CR-dmCGs including unique CR-dmCGs (green) and age-dmCGs prevented by CR (blue) (adjusted p < 0.05 & methylation difference between Old-AL and Old-CR > |5%|) focusing on young-AL and old-AL. Right: 90° rotation on the Y-axis of the 3D plot showing that unique CR-dmCGs (green) regress away from the midline when comparing old-AL and Old-CR methylation levels. (B) Proportion of diet-dmCGs unique to CR (green) and those with an age interaction (prevented age-dmCGs, blue) (N = 46,813). (C) Enrichment of CR-dmCGs in gene-centric regions (p < 0.05, hypergeometric test). (D) Enrichment of CR-dmCGs in gene-regulatory regions. Red and blue indicate significant under-representation or over-representation (p < 0.05, hypergeometric test) respectively, while white shows no significance (p > 0.05). (E) Pathway analysis of genes containing >2 significant diet-dmCGs. Top enrichment pathways are shown (FDR adjusted p-values < 0.05). Circle size indicates the ratio of genes containing diet-dmCGs in a pathway, color indicates p-values.
Figure 4
Figure 4
CR induced differential CH methylation is clustered at specific genomic loci. (A) Left: 3D scatterplot showing the methylation levels of significant CR-dmCHs including unique CR-dmCHs (green) and age-dmCHs prevented by CR (blue) (adjusted p < 0.05 & methylation difference between Old-AL and Old-CR > |5%|) focusing on young-AL and old-AL. Right: 90° rotation on the Y-axis of the 3D plot showing unique CR-dmCH (green) regress away from the midline when comparing old-AL and Old-CR methylation levels. (B) Proportion of CR-dmCHs unique to CR (green) and those with age interaction (prevented age-dmCHs, blue) (N = 90,428). (C) Distribution of CR-dmCHs. Dotted lines mark the average methylation differences of hypomethylated CR-dmCHs (red, 8%) and hypermethylated CR-dmCHs (green, 10%). (D) Distribution plot comparing the proximity between dmCHs by age and CR focusing on 10 kb segments. (E) Line graph representing % of dmCHs by degree of proximity within 10kb (solid lines) or 1kb (dotted line) by age or by CR.
Figure 5
Figure 5
CR-induced differential CH methylation enrichment patterns. (A) Enrichment of CR-dmCHs in gene-centric regions, only significant enrichment is shown (p < 0.05, hypergeometric test). (B) Enrichment of CR-dmCHs in gene-regulatory regions. Red and blue indicate significant under-representation or over-representation (p < 0.05, hypergeometric test) respectively, while white shows no significance (p > 0.05). (C) Pathway analysis of genes containing >2 significant CR-dmCHs. Top enrichment pathways are shown (FDR adjusted p-values < 0.05). Circle size indicates the ratio of genes in pathway containing CR-dmCHs, color indicates p-values. (D) Overlap between pathways enriched for CR-dmCHs and CR-dmCGs.
Figure 6
Figure 6
CR-induced differential methylation of DNA regulatory enzymes. Calorie-restriction induces hypermethylation of CGs (red) and CHs (green) in the promoter regions of TET3 (A) and DNMT1 (B). (C) mRNA expression of TET3 decreases with CR but not age. (D) mRNA expression of DNMT1 using a pan-isoform assay does not change with CR or aging, however, when isoform-specific expression is analyzed the exon 1 (E1) isoform decreases with age and diet while the isoform using the alternative start site (Alt. E1) is unchanged with age or CR. (E) mRNA expression of DNMT3a1 decreases with diet and age. TET1 expression did not change in any condition and TET2 expression decreased with diet but not age. n=7–8/group, *p < 0.05, **p < 0.001, One-way ANOVA with Benjamini-Hochberg correction).

References

    1. Adams MM, Shi L, Linville MC, et al. Caloric restriction and age affect synaptic proteins in hippocampal CA3 and spatial learning ability. Exp Neurol. 2008;211(1):141–149. - PMC - PubMed
    1. Balasubramanian D, Akhtar-Zaidi B, Song L, et al. H3K4me3 inversely correlates with DNA methylation at a large class of non-CpG-island-containing start sites. Genome Med. 2012;4(5):47. - PMC - PubMed
    1. Booth LN, Brunet A. The Aging Epigenome. Molecular cell. 2016;62(5):728–744. - PMC - PubMed
    1. Calo E, Wysocka J. Modification of enhancer chromatin: what, how, and why? Molecular cell. 2013;49(5):825–837. - PMC - PubMed
    1. Cedar H, Bergman Y. Linking DNA methylation and histone modification: patterns and paradigms. Nature reviews Genetics. 2009;10(5):295–304. - PubMed

Publication types