. 2018 Oct;68(4):1519-1533.
doi: 10.1002/hep.29915.

Disruption of Renal Arginine Metabolism Promotes Kidney Injury in Hepatorenal Syndrome in Mice

Affiliations

Disruption of Renal Arginine Metabolism Promotes Kidney Injury in Hepatorenal Syndrome in Mice

Zoltan V Varga et al. Hepatology. 2018 Oct.

Abstract

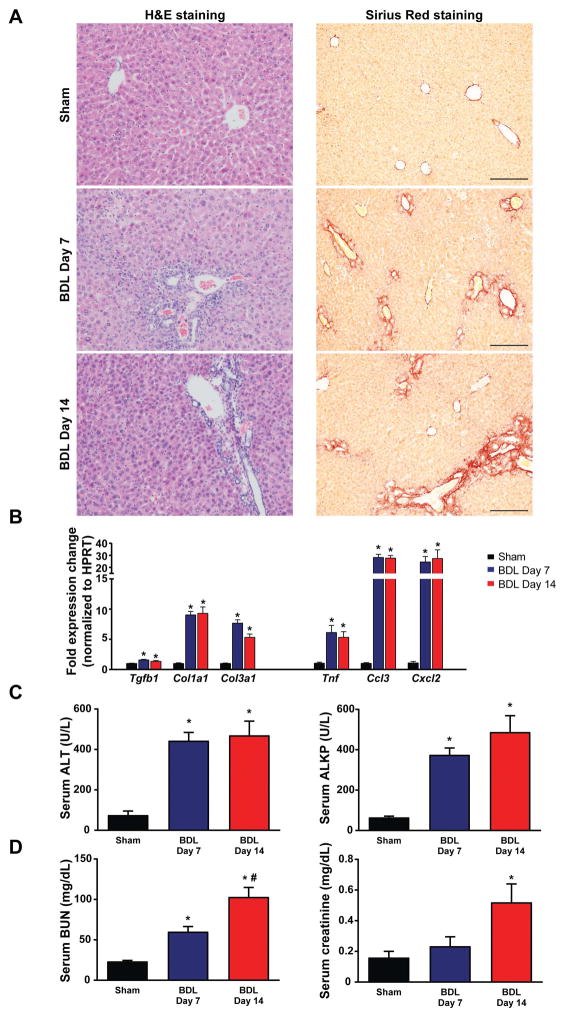
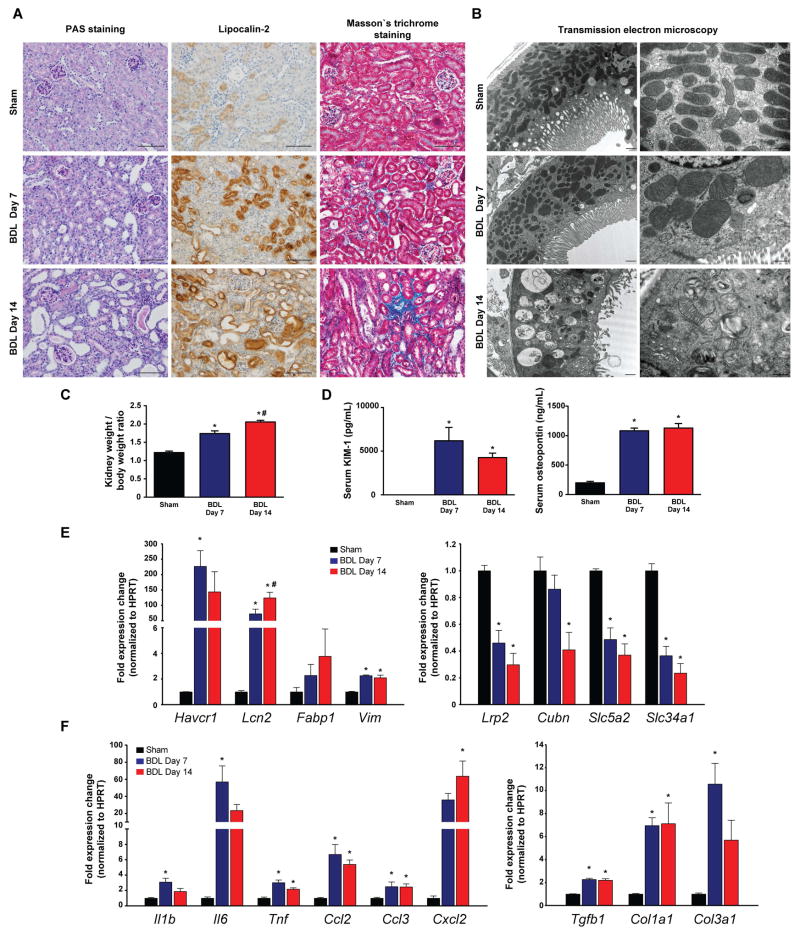
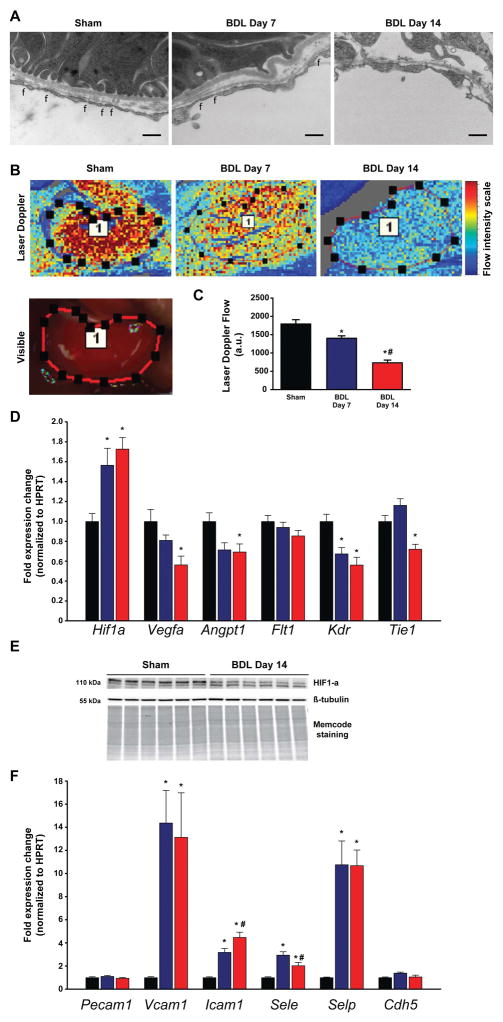
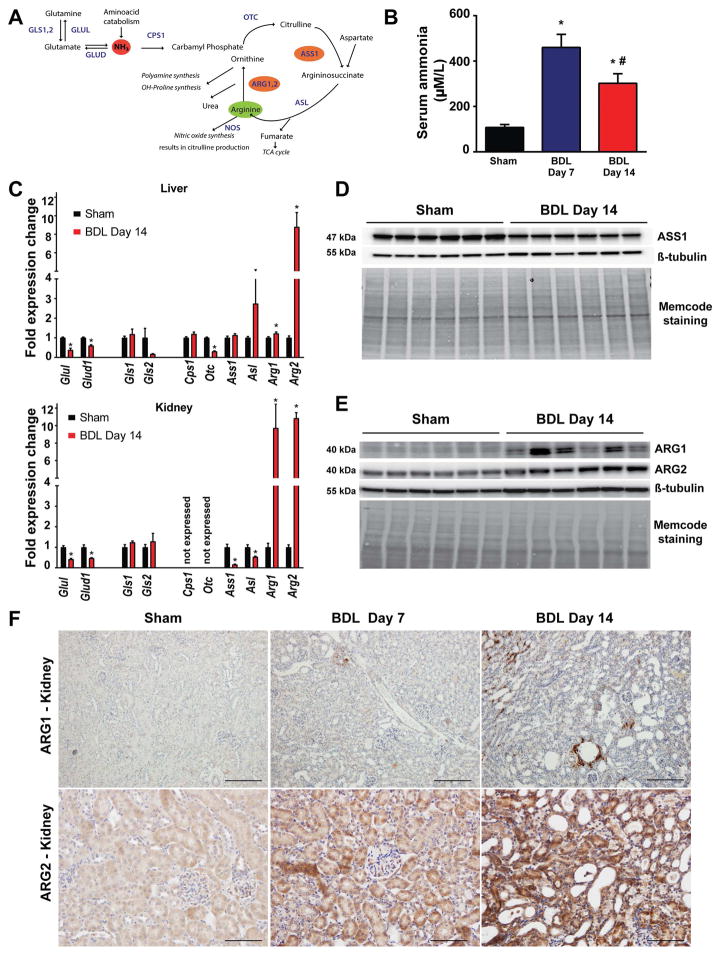
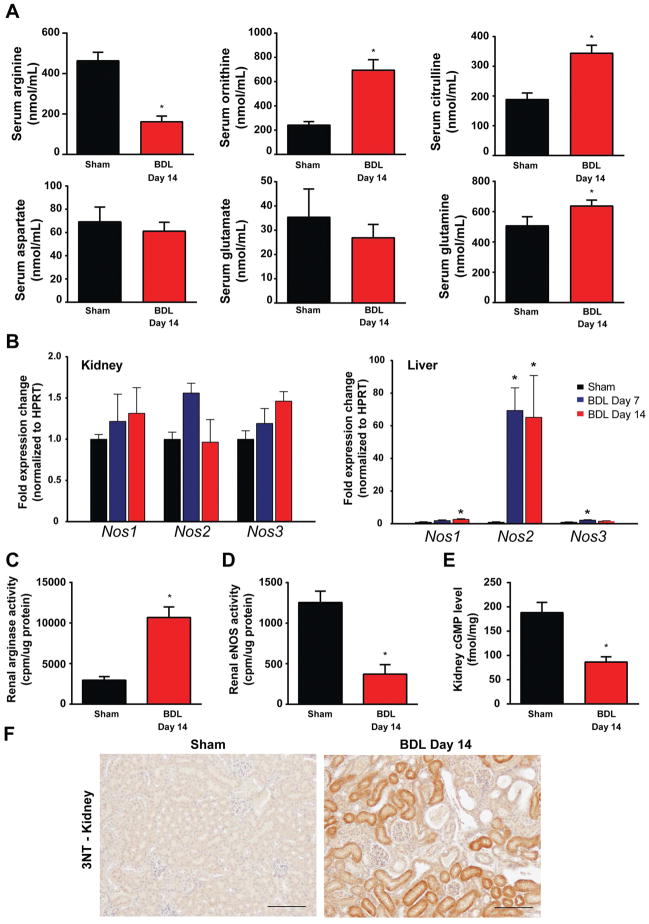
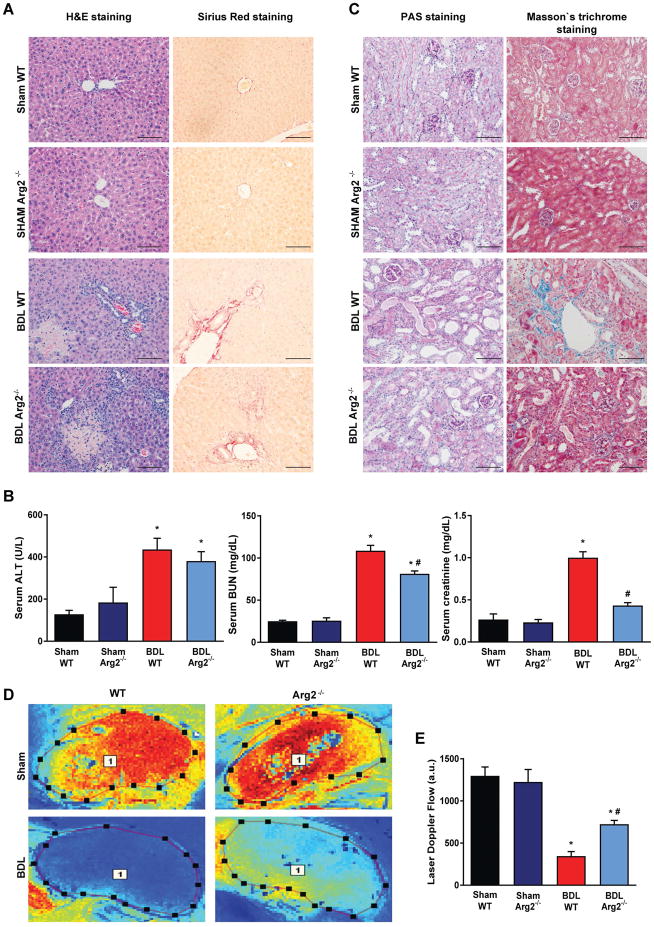
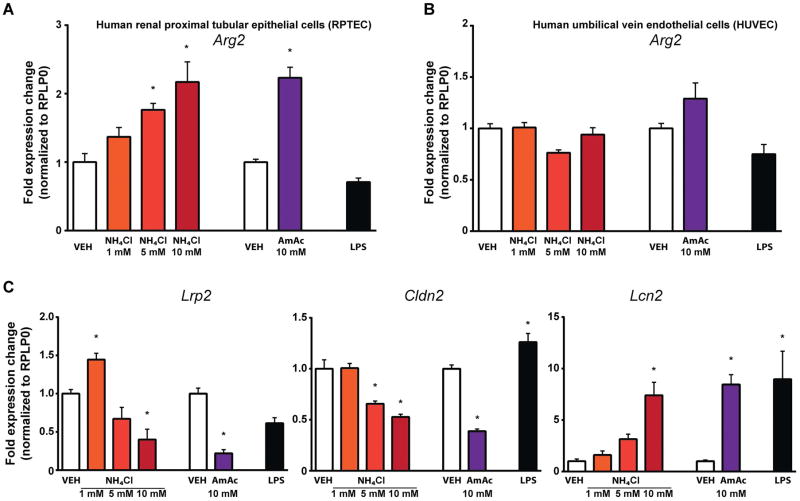
Tubular dysfunction is an important feature of renal injury in hepatorenal syndrome (HRS) in patients with end-stage liver disease. The pathogenesis of kidney injury in HRS is elusive, and there are no clinically relevant rodent models of HRS. We investigated the renal consequences of bile duct ligation (BDL)-induced hepatic and renal injury in mice in vivo by using biochemical assays, real-time polymerase chain reaction (PCR), Western blot, mass spectrometry, histology, and electron microscopy. BDL resulted in time-dependent hepatic injury and hyperammonemia which were paralleled by tubular dilation and tubulointerstitial nephritis with marked upregulation of lipocalin-2, kidney injury molecule 1 (KIM-1) and osteopontin. Renal injury was associated with dramatically impaired microvascular flow and decreased endothelial nitric oxide synthase (eNOS) activity. Gene expression analyses signified proximal tubular epithelial injury, tissue hypoxia, inflammation, and activation of the fibrotic gene program. Marked changes in renal arginine metabolism (upregulation of arginase-2 and downregulation of argininosuccinate synthase 1), resulted in decreased circulating arginine levels. Arginase-2 knockout mice were partially protected from BDL-induced renal injury and had less impairment in microvascular function. In human-cultured proximal tubular epithelial cells hyperammonemia per se induced upregulation of arginase-2 and markers of tubular cell injury.

Conclusion: We propose that hyperammonemia may contribute to impaired renal arginine metabolism, leading to decreased eNOS activity, impaired microcirculation, tubular cell death, tubulointerstitial nephritis and fibrosis. Genetic deletion of arginase-2 partially restores microcirculation and thereby alleviates tubular injury. We also demonstrate that BDL in mice is an excellent, clinically relevant model to study the renal consequences of HRS. (Hepatology 2018; 00:000-000).


Conflict of interest statement

Conflict of interest disclosure: All authors declare no conflict of interest.

Figures

Fig. 1
Fig. 1. Time-dependent changes in the markers of liver inflammation and fibrosis in bile duct-ligated mice
(A) Histological assessment of hepatic necrosis, and fibrosis in BDL mice. Scale bar represent 200 μm. (B) Expression of fibrotic markers TGF-β(Tgfb1), collagen 1(Col1a1), collagen 3(Col3a1) and inflammatory markers TNF-α(Tnf), MIP-1-α(Ccl3), MIP2(Cxcl2), in livers of sham operated mice (Sham) or in mice subjected to BDL and sacrificed on postoperative day 7 (BDL Day 7) or day 14 (BDL Day 14), respectively. (C) Enzymatic markers of liver and (D) kidney injury. Results are mean±S.E.M. *p<0.05 vs. sham #p<0.05 vs. BDL Day 7, n=5–6.
Fig. 2
Fig. 2. Bile duct-ligation induces massive tubular damage
(A) Histological assessment of tubular injury (PAS staining, and lipocalin-2 immunohistochemistry), as well as tubulointerstitial fibrosis (Masson’s trichrome staining). Scale bar represent 100 μm. (B) Transmission electron microscopic images of proximal tubular epithelial cells. Original magnification on left panels are 10,000X; high power fields are 25,000X. (C) Kidney/body weight ratio during the course of study. (D) Serum KIM-1 and osteopontin protein levels of sham operated mice (Sham) or of mice subjected to BDL and sacrificed on postoperative day 7 (BDL Day 7) or day 14 (BDL Day 14), respectively. (E) Expression of tubular injury markers KIM-1 (Havcr1), Lipocalin-2 (Lcn2), fatty acid binding protein 1 (Fabp1) and vimentin (Vim), and genes involved in absorptive function of proximal tubuli megalin (Lrp2), cubilin (Cubn), SGLT2 (Slc5a2), and sodium-dependent phosphate transport protein 2A (Slc34a2) in kidneys of sham operated mice (Sham) or mice subjected to BDL and sacrificed on postoperative day 7 (BDL Day 7) or day 14 (BDL Day 14), respectively. (F) Expression of inflammatory markers IL-1β(Il1b), IL-6(Il6), TNF-α(Tnf), MCP-1(Ccl2), MIP-1-α(Ccl3), MIP2(Cxcl2), and expression of fibrotic markers TGF-β(Tgfb1), collagen 1(Col1a1), collagen 3(Col3a1), in kidneys of sham operated mice (Sham) or in mice subjected to BDL and sacrificed on postoperative day 7 (BDL Day 7) or day 14 (BDL Day 14), respectively. Results are mean±S.E.M. *p<0.05 vs. sham, n=6.
Fig. 3
Fig. 3. Impaired renal microcirculation, and vascular inflammation leads to tubular hypoxia
(A) Transmission electron microscopic images of peritubular endothelial cells. Original magnification is 25,000X, scale bar represents 400 nm, f: fenestrations. (B) Representative illustration of renal microcirculation by Laser speckle contrast analysis. (C) Quantification of renal microvascular flow. (D) Gene expression of hypoxia-inducible factor 1-alpha(Hif1a), vascular endothelial growth factor A(Vegfa), angiopoietin 1(Angpt1), vascular endothelial growth factor receptor 1(Flt1), vascular endothelial growth factor receptor 2(Kdr), and tyrosine kinase with immunoglobulin-like and EGF-like domains 1(Tie1). (E) Hypoxia-inducible factor 1-alpha(HIF1α) protein expression analysis by Western blot. (F) Expression of vascular adhesion molecules platelet endothelial cell adhesion molecule 1(Pecam1), vascular cell adhesion molecule 1(Vcam1), intercellular adhesion molecule 1(Icam1), E-selectin(Sele), P-selectin(Selp), and VE-cadherin(Cdh5) in sham operated mice (Sham) or in mice subjected toBDL and sacrificed on postoperative day 7 (BDL Day 7) or day 14 (BDL Day 14), respectively. Results are mean±S.E.M. *p<0.05 vs. sham #p<0.05 vs. BDL Day 7, n=6.
Fig. 4
Fig. 4. Disruption of renal arginine metabolism in bile duct-ligated mice
(A) Schematic representation of pathways involved in arginine metabolism. (B) Serum ammonia levels and (C) hepatic and renal expression of genes involved in ammonia detoxification: glutamine synthetase(Glul), glutamate dehydrogenase(Glud1), glutaminase 1(Gls1), glutaminase 2(Gls2), carbamoyl-phosphate synthetase 1(Cps1), ornithine transcarbamylase(Otc), argininosuccinate synthase 1(Ass1), argininosuccinate lyase(Asl), arginase 1(Arg1), and arginase 2(Arg2) of sham operated mice (Sham) or of mice subjected to BDL and sacrificed on postoperative day 14 (BDL Day 14). (D) Argininosuccinate synthase (ASS1) protein expression analysis by Western blot and (E) Arginase-1 (ARG1) and Arginase-2 (ARG2) protein expression analysis by Western blot in sham operated mice (Sham) or in mice subjected to BDL and sacrificed on postoperative day 14 (BDL Day 14). β-tubulin and total protein staining (Memcode staining) is shown as loading controls. (F) Arginase-1 and Arginase-2 protein expression analysis by immunostaining in sham operated mice (Sham) or in mice subjected to BDL and sacrificed on postoperative day 7 (BDL Day 7) or day 14 (BDL Day 14), respectively. Scale bar represent 100 μm. Results are mean±S.E.M. *p<0.05 vs. sham, n=6.
Fig. 5
Fig. 5. Serum levels of arginine metabolism-related amino acids in bile duct-ligated mice
(A) Serum levels of arginine, ornithine, citrulline, aspartate, glutamate, and glutamine in sham operated mice (Sham) or in mice subjected to BDL and sacrificed on postoperative day 14 (BDL Day 14). (B) Renal and hepatic expression of nitric oxide synthase isoforms: Nos1–neuronal, Nos2–inducible, Nos3–endothelial, in sham operated mice (Sham–black bars) or in mice subjected to bile duct-ligation and sacrificed on postoperative day 7 (BDL Day 7–blue bars) or day 14 (BDL Day 14–red bars), respectively. Enzyme activity of arginases (C), and endothelial nitric oxide synthase (D). (E) Renal levels of cyclic guanosine monophosphate (cGMP) in sham operated mice (Sham–black bars) or in mice subjected to bile duct-ligation and sacrificed on postoperative day 14 (BDL Day 14–red bars). (F) 3-nitrotyrosine (3-NT) expression analysis, as a marker of nitrative stress by immunostaining in sham operated mice (Sham) or in mice subjected to BDL and sacrificed on postoperative day 14 (BDL Day 14). Scale bar represent 100 μm. Results are mean±S.E.M. *p<0.05 vs. sham, n=10–15 for amino acid analysis, n=6–8 in other experiments.
Fig. 6
Fig. 6. Arginase-2 deficient mice are partially rescued from kidney injury in bile duct-ligated mice
(A) Histological assessment of hepatic necrosis, and fibrosis in sham operated wild type (Sham WT) or Arginase-2-deficient mice (Sham Arg2−/−) or in wild type or Arginase-2-deficient mice subjected to bile duct-ligation and sacrificed on postoperative 14 (BDL WT, or BDL Arg2−/−), respectively. Scale bar represent 100 μm. (B) Enzymatic markers of liver and kidney injury. (C) Histological assessment of tubular injury (PAS staining) and tubulointerstitial fibrosis (Masson’s trichrome staining). Scale bar represent 100 μm. (D) Representative illustration of renal microcirculation assessment by Laser speckle contrast analysis. (E) Quantification of renal microvascular flow. Results are mean±S.E.M. *p<0.05 vs. Sham WT #p<0.05 vs. BDL WT, n=4–6.
Fig. 7
Fig. 7. Ammonia promotes tubular cell injury and the upregulation of arginase-2
(A) Arginase-2 (Arg2) expression in human proximal tubular cells exposed to either 1, 5, 10 mM NH4Cl, or 10 mM ammonium acetate (AmAc) for 48 h or in the presence of E. Coli O55:B5 LPS (100 ng/mL–6h). (B) Arginase-2 (Arg2) expression in human umbilical vein endothelial cells exposed to either 1, 5, 10 mM NH4Cl, or 10 mM ammonium acetate (AmAc) for 48 h or in the presence of E. Coli O55:B5 LPS (100 ng/mL–6h). (C) Megalin (Lrp2), Claudin (Cldn2), and Lipocalin-2 (Lcn2) gene expression in human proximal tubular cells exposed to either 1, 5, 10 mM NH4Cl, or 10 mM ammonium acetate (AmAc) for 48 h or in the presence of E. Coli O55:B5 LPS (100 ng/mL–6h). Results are mean±S.E.M. *p<0.05 vs. vehicle control #p<0.05 vs. LPS treated vehicle control, n=7.

References

    1. Blachier M, Leleu H, Peck-Radosavljevic M, Valla DC, Roudot-Thoraval F. The burden of liver disease in Europe: a review of available epidemiological data. J Hepatol. 2013;58:593–608. - PubMed
    1. Pericleous M, Sarnowski A, Moore A, Fijten R, Zaman M. The clinical management of abdominal ascites, spontaneous bacterial peritonitis and hepatorenal syndrome: a review of current guidelines and recommendations. Eur J Gastroenterol Hepatol. 2016;28:e10–18. - PubMed
    1. Davenport A, Sheikh MF, Lamb E, Agarwal B, Jalan R. Acute kidney injury in acute-on-chronic liver failure: where does hepatorenal syndrome fit? Kidney Int. 2017;92(5):1058–1070. - PubMed
    1. Garcia-Tsao G, Parikh CR, Viola A. Acute kidney injury in cirrhosis. Hepatology. 2008;48:2064–2077. - PubMed
    1. Cardenas A, Gines P, Uriz J, Bessa X, Salmeron JM, Mas A, Ortega R, et al. Renal failure after upper gastrointestinal bleeding in cirrhosis: incidence, clinical course, predictive factors, and short-term prognosis. Hepatology. 2001;34:671–676. - PubMed

Publication types

MeSH terms