. 2018 Apr 10:7:e33158.
doi: 10.7554/eLife.33158.

Glutamatergic drive along the septo-temporal axis of hippocampus boosts prelimbic oscillations in the neonatal mouse

Affiliations

Glutamatergic drive along the septo-temporal axis of hippocampus boosts prelimbic oscillations in the neonatal mouse

Joachim Ahlbeck et al. Elife. .

Abstract

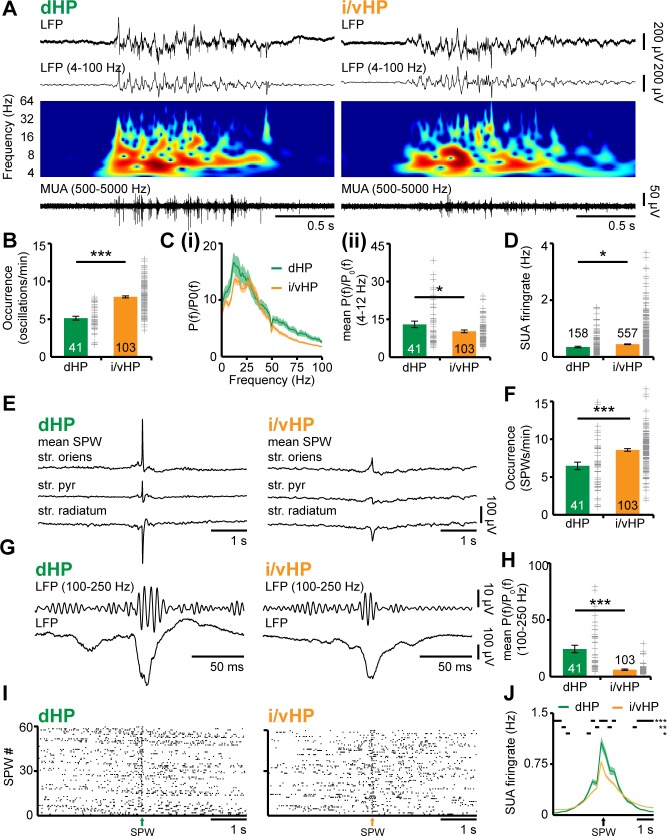
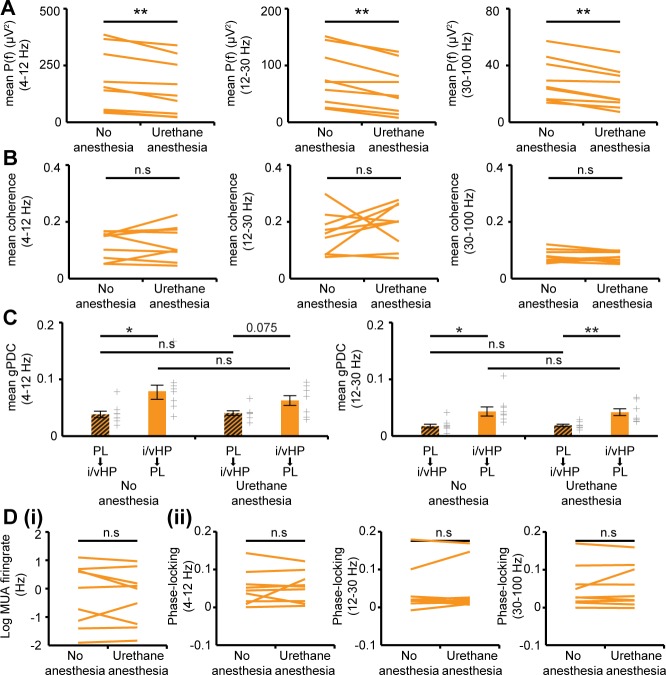
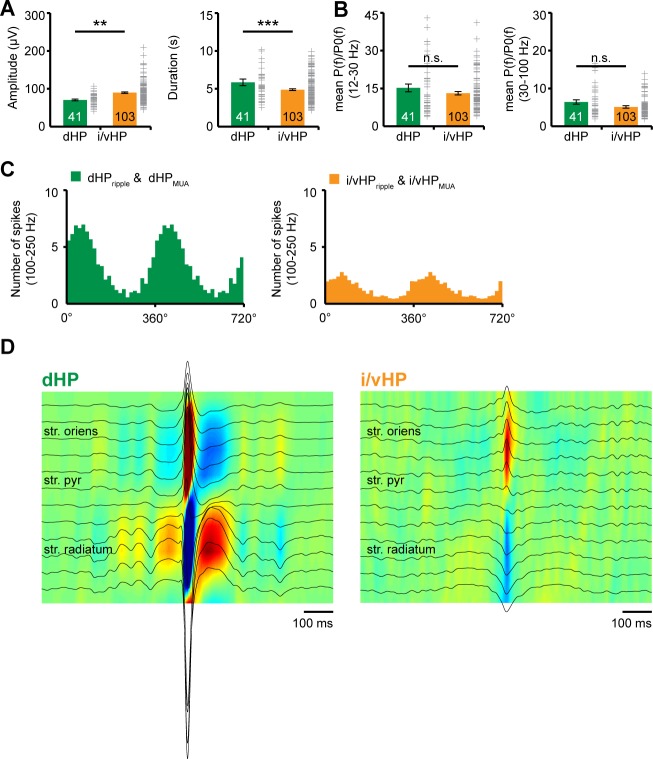
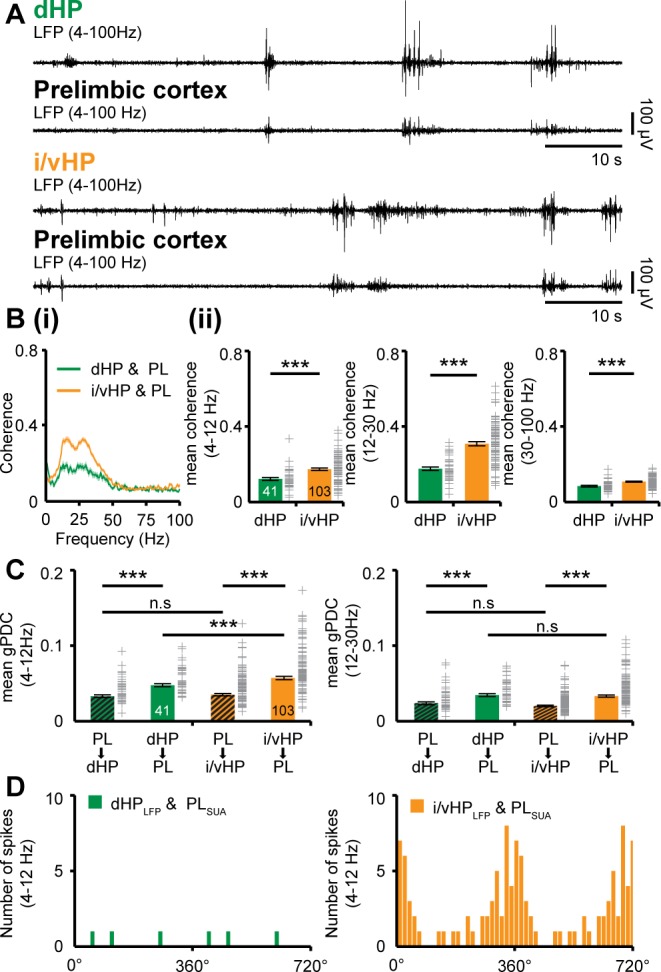
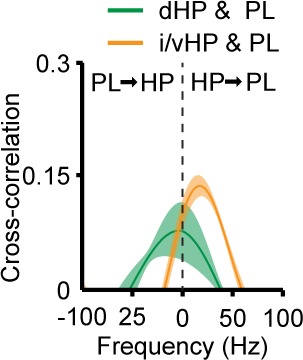
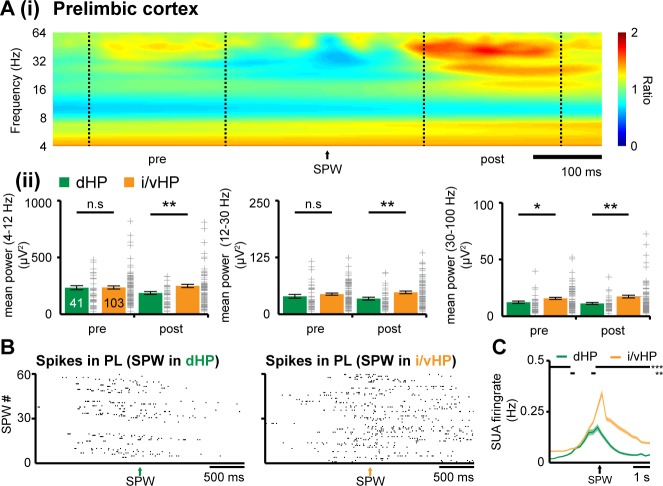
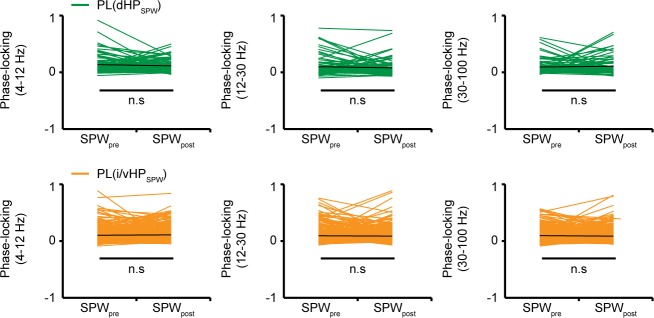
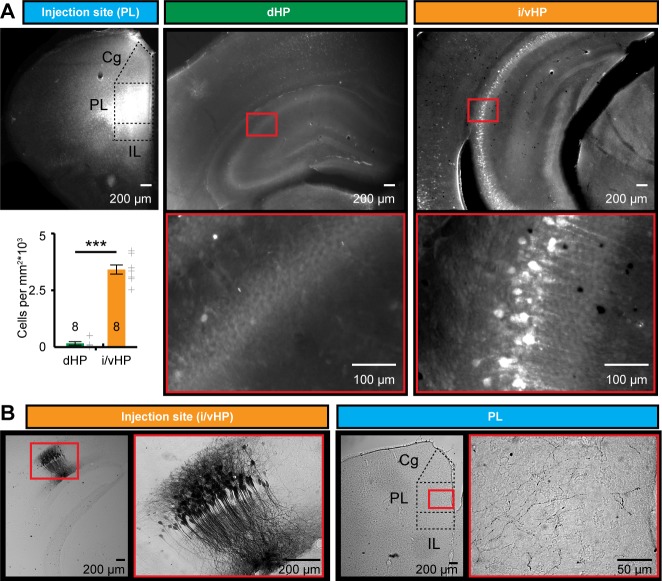
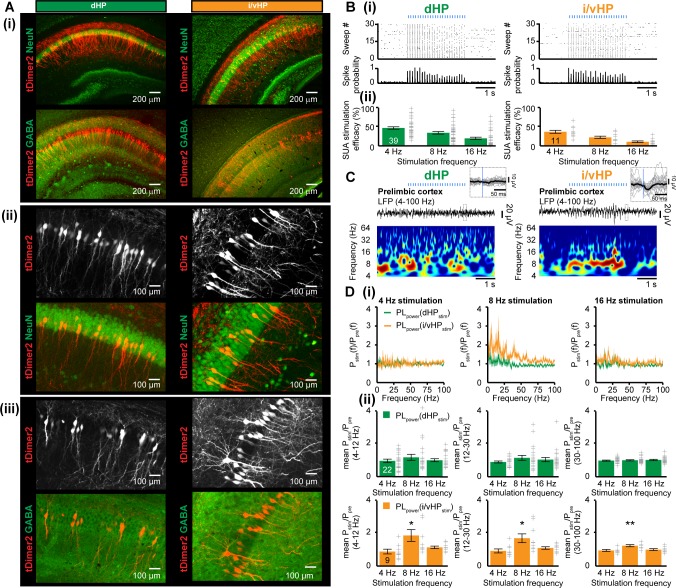
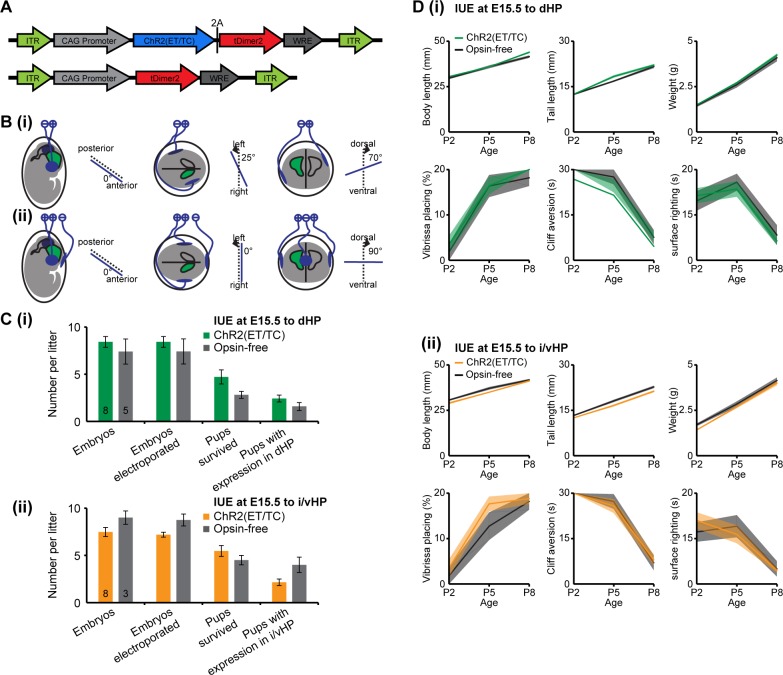
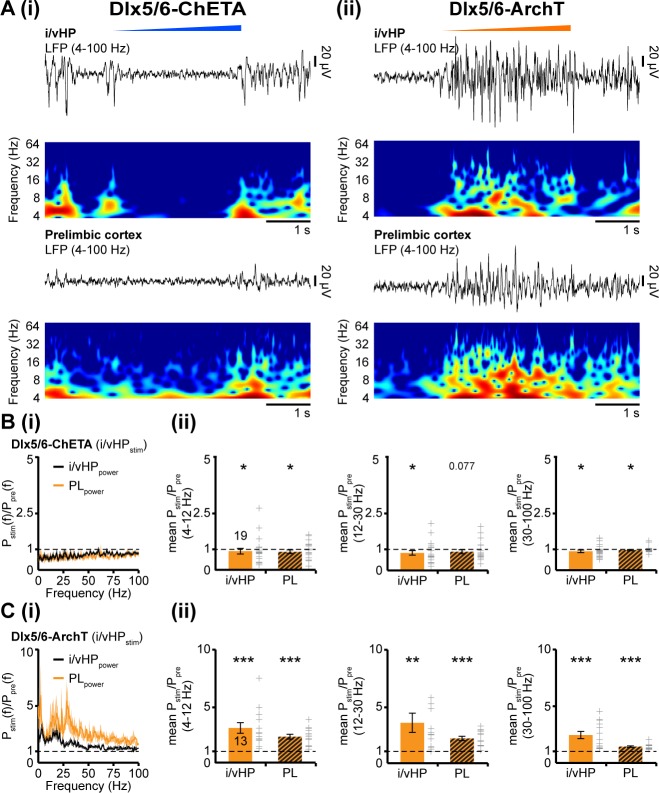
The long-range coupling within prefrontal-hippocampal networks that account for cognitive performance emerges early in life. The discontinuous hippocampal theta bursts have been proposed to drive the generation of neonatal prefrontal oscillations, yet the cellular substrate of these early interactions is still unresolved. Here, we selectively target optogenetic manipulation of glutamatergic projection neurons in the CA1 area of either dorsal or intermediate/ventral hippocampus at neonatal age to elucidate their contribution to the emergence of prefrontal oscillatory entrainment. We show that despite stronger theta and ripples power in dorsal hippocampus, the prefrontal cortex is mainly coupled with intermediate/ventral hippocampus by phase-locking of neuronal firing via dense direct axonal projections. Theta band-confined activation by light of pyramidal neurons in intermediate/ventral but not dorsal CA1 that were transfected by in utero electroporation with high-efficiency channelrhodopsin boosts prefrontal oscillations. Our data causally elucidate the cellular origin of the long-range coupling in the developing brain.

Keywords: cortical development; hippocampal; mouse; neuroscience; optogenetics; oscillations; prefrontal.


Conflict of interest statement

JA, LS, MC, SB, IH No competing interests declared

Figures

Figure 1.
Figure 1.. Patterns of discontinuous oscillatory activity in the CA1 area of the neonatal dHP and i/vHP in vivo.
(A) Characteristic theta burst activity recorded in the CA1 area of the dHP (left) and i/vHP (right) of a P9 mouse displayed after band-pass filtering (4–100 Hz) and the corresponding MUA (500–5000 Hz). Color-coded frequency plots show the wavelet spectrum of LFP at identical time scale. (B) Bar diagram (mean ±SEM) displaying the occurrence of discontinuous theta bursts in dHP (n = 41 mice) and i/vHP (n = 103 mice). (C) Power analysis of discontinuous oscillatory activity P(f) normalized to the non-oscillatory period P0(f) in dHP and i/vHP. (i) Power spectra (4–100 Hz) averaged for all investigated mice. (ii) Bar diagrams quantifying the mean power within theta frequency band (4–12 Hz) in dHP (n = 41 mice) and i/vHP (n = 103 mice) (D) Bar diagram displaying the SUA of dHP (n = 158 units) and i/vHP (n = 557 units) after clustering of spike shapes. (E) Characteristic SPWs and ripple events recorded in dHP (left) and i/vHP (right). (F) Bar diagrams (mean ±SEM) displaying the SPWs occurrence in dHP and i/vHP. (G) Characteristic SPW-ripple events recorded in dHP (left) and i/vHP (right). (H) Bar diagram displaying the mean power of ripples in dHP and i/vHP. (I) Spike trains from neurons in dHP (left) and i/vHP (right) aligned to SPWs. (J) Histograms of SUA aligned to SPWs (n = 232 units for dHP, n = 670 for i/vHP). Data are represented as mean ± SEM. *p<0.05, **p<0.01, ***p<0.001.
Figure 1—figure supplement 1.
Figure 1—figure supplement 1.. Properties of network and neuronal activity in i/vHP of neonatal non-anesthetized and urethane-anesthetized mice.
(A) Plots displaying the mean power of oscillatory events for theta, beta and gamma frequencies before and after urethane anesthesia (n = 9 mice). (B) Same as (A) for mean coherence between oscillatory events in i/vHP and PL. (C) Same as (A) for directed interactions between i/vHP and PL measured by mean gPDC in theta and beta frequency bands. (D) Impact of urethane anesthesia on the firing rate (i) and phase locking to theta, beta, and gamma oscillatory network activity. Each line corresponds to one investigated pup. Error bars represent SEM. *p<0.05, **p<0.01.
Figure 1—figure supplement 2.
Figure 1—figure supplement 2.. Properties of network and neuronal activity in dHP vs. i/vHP of neonatal mice.
(A) Bar diagrams displaying the amplitude and duration of discontinuous oscillatory events in dHP (n = 41 mice) and i/vHP (n = 103 mice). (B) Bar diagrams displaying the power spectrum of discontinuous oscillatory activity P(f) normalized to the non-oscillatory period P0(f) when averaged for beta (12–30 Hz) and gamma (30–100 Hz) frequency bands in dHP (left, n = 41 mice) and i/vHP (right, n = 103 mice). (C) Histograms displaying the phase-locking of hippocampal spikes to ripple activity in dHP (left) and i/vHP (right). (D) Current source density analysis illustrating sink/sources in dHP (left) and i/vHP (right) during SPWs. Error bars represent SEM. **p<0.01, ***p<0.001.
Figure 2.
Figure 2.. Dynamic coupling of hippocampal and prefrontal oscillatory activity along septo-temporal axis during neonatal development.
(A) Simultaneous LFP recordings of discontinuous oscillatory activity in dHP and PL (top) and i/vHP and PL (bottom). (B) Long-range synchrony within prefrontal-hippocampal networks. (i) Average coherence spectra for simultaneously recorded oscillatory events in dHP and PL as well as i/vHP and PL. (ii) Bar diagrams (mean ±SEM) displaying the coherence in theta (4–12 Hz), beta (12–30 Hz), and gamma (30–100 Hz) band when averaged for all investigated mice. (C) Directed interactions between PL and either dHP or i/vHP monitored by general Partial Directed Coherence (gPDC). Bar diagrams displaying the gPDC calculated for theta (4–12 Hz, left) and beta (12–30 Hz, right) frequency and averaged for all investigated animals (n = 41 mice for dHP and PL, n = 103 mice for i/vHP and PL). (D) Histograms displaying the phase-locking of prelimbic spikes to theta oscillations in dHP (left) and i/vHP (right). Note the different proportion of spikes significantly locked along the septo-temporal axis (dHP, 3 of 46 units; i/vHP, 52 of 310 units). Data are represented as mean ± SEM. *p<0.05, ***p<0.001.
Figure 2—figure supplement 1.
Figure 2—figure supplement 1.. Cross-correlation of the amplitudes of band pass (4–12 Hz)-filtered LFP recorded from dHP and PL (green) as well as from i/vHP and PL (orange).
Error bars represent SEM.
Figure 3.
Figure 3.. Coupling between neonatal PFC and HP during hippocampal SPWs.
(A) Power changes in the PL during hippocampal SPWs. (i) Color-coded frequency plot showing the relative power in the PL aligned to the onset of SPWs detected in i/vHP when normalized to the power change caused in the PL by SPWs in the dHP. All other colors than green represent power augmentation (red) or decrease (blue). (ii) Bar diagrams displaying mean power changes of prelimbic activity in different frequency bands (left, theta; middle, beta; right, gamma) before (pre) and after (post) hippocampal SPWs in the dHP and i/vHP (n = 41 mice for dHP, n = 103 mice for i/vHP). (B) Spike trains recorded in the PL before and after SPWs occurring either in the dHP (left) or i/vHP (right). (C) Histograms of prelimbic spiking in relationship with hippocampal SPWs (n = 148 units for dHP, n = 560 units for i/vHP). Data are represented as mean ± SEM. *p<0.05, **p<0.01, ***p<0.001.
Figure 3—figure supplement 1.
Figure 3—figure supplement 1.. Phase-locking of SUA in PL before (pre) and after (post) SPWs detected in dHP (top, green) and i/vHP (bottom, orange).
Figure 4.
Figure 4.. Long-range monosynaptic axonal projections connecting the neonatal PFC and hippocampal CA1 area along the septo-temporal axis.
(A) Photomicrographs depicting dense retrogradely labelled neurons in the CA1 area of i/vHP (right) but not dHP (middle) after FG injection into PL at P1 (left). Bar diagram displays the overall density of retrogradely stained neurons when averaged for all investigated pups (n = 8 mice). (B) Photomicrographs depicting anterogradely labeled axons targeting the PL of a P10 mouse (right) after iontophoretic BDA injection into the CA1 area of i/vHP at P7 (left). The site of injection and the area with the highest axonal density are depicted at higher magnification. Data are represented as mean ± SEM. ***p<0.001.
Figure 5.
Figure 5.. Optogenetic activation of pyramidal neurons in the CA1 area of dHP and i/vHP has different effects on the network activity of neonatal PL.
(A) Cell- and layer-specific transfection of dHP or i/vHP with CAG-ChR2(ET/TC)−2A-tDimer2 by site-directed IUE. (i) Photomicrographs depicting tDimer2-expressing pyramidal neurons (red) in the CA1 region of dHP (left) and i/vHP (right) when stained for NeuN (green, top panels) or GABA (green, bottom panels). (ii) Photomicrographs depicting the transfected hippocampal neurons when co-stained for NeuN and displayed at larger magnification. (iii) Photomicrographs depicting transfected hippocampal neurons when co-stained for GABA and displayed at larger magnification. (B) Optogenetic activation of pyramidal neurons in CA1 area along septo-temporal axis. (i) Representative raster plot and corresponding spike probability histogram for dHP (left) and i/vHP (right) in response to 30 sweeps of 8 Hz pulse stimulation (3 ms pulse length, 473 nm). (ii) Bar diagram displaying the efficacy of inducing spiking in dHP and i/vHP of different stimulation frequencies. (C) Characteristic light-induced discontinuous oscillatory activity in the PL of a P10 mouse after transfection of pyramidal neurons in the CA1 area of the dHP (left) or i/vHP (right) with ChR2(ET/TC) by IUE. The LFP is displayed after band-pass filtering (4–100 Hz) together with the corresponding color-coded wavelet spectrum at identical time scale. Inset, individual (gray) and averaged (black) prelimbic LFP traces displayed at larger time scale in response to light stimulation in HP. (D) Power analysis of prelimbic oscillatory activity Pstim(f) after light stimulation of dHP (green) and i/v HP (orange) at different frequencies (4, 8, 16 Hz) normalized to the activity before stimulus Ppre(f). (i) Power spectra (0–100 Hz) averaged for all investigated mice. (ii) Bar diagrams displaying mean power changes in PL during stimulation of either dHP (top panels) or i/vHP (bottom panels). Data are represented as mean ± SEM. *p<0.05, **p<0.01.
Figure 5—figure supplement 1.
Figure 5—figure supplement 1.. Experimental protocol for in utero electroporation of the hippocampus.
(A) Structure of the ChR2(ET/TC)-containing and opsin-free constructs. (B) Schematic drawing illustrating the orientation of electrode paddles for specific targeting of either (i) dHP or (ii) i/vHP pyramidal neurons. (C) Bar diagram displaying the mean number of embryos, electroporated embryos, surviving pups, and positively transfected pups when ChR2(ET/TC)-containing and opsin-free constructs for (i) dHP (n = 8 litters for opsin-containing group, n = 5 for opsin-free group) and (ii) i/vHP (n = 8 litters for opsin-containing group, n = 3 litters for opsin-free group). (D) Line plots displaying the developmental profile of somatic growth [body length, tail length, weight] and reflexes [vibrissa placing, cliff aversion and surface righting reflexes] of P2-8 pups expressing ChR2(ET/TC) or opsin-free constructs in (i) dHP (n = 17 for opsin-containing pups, n = 14 for opsin-free pups) and (ii) i/vHP (n = 9 for opsin-containing pups, n = 5 for opsin-free pups). Error bars represent SEM.
Figure 5—figure supplement 2.
Figure 5—figure supplement 2.. Response in prelimbic cortex for opsin-free animals.
Bar diagrams displaying the power changes in PL during light stimulation of pyramidal neurons in the CA1 area of dHP (top panels) or i/vHP (bottom panels) when normalized to the values before hippocampal stimulation for opsin-free animals. Error bars represent SEM.
Figure 6.
Figure 6.. Modulation of oscillatory activity in i/vHP by optogenetic manipulation of interneurons affects the entrainment of neonatal PL.
(A) Light-induced modulation of oscillatory activity in i/vHP and PL of a P9 mouse after transfection of interneurons in the CA1 area of the i/vHP with ChETA (i) or ArchT (ii). The LFP is displayed after band-pass filtering (4–100 Hz) together with the corresponding color-coded wavelet spectrum at identical time scale. (B) Power of oscillatory activity in i/vHP and PL after optogenetic activation of interneurons in i/vHP (Pstim(f)) normalized to the activity before stimulus Ppre(f). (i) Power spectra (0–100 Hz) averaged for all investigated mice. (ii) Bar diagrams displaying mean power changes in theta, beta, and gamma frequency bands for the oscillations recorded in i/vHP and PL during light stimulation in i/vHP. (C) Same as (B) for silencing of ArchT-transfected interneurons in i/vHP by yellow light. Data are shown as mean ± SEM. *p<0.05, **p<0.01, ***p<0.001.

References

    1. Adhikari A, Topiwala MA, Gordon JA. Synchronized activity between the ventral hippocampus and the medial prefrontal cortex during anxiety. Neuron. 2010;65:257–269. doi: 10.1016/j.neuron.2009.12.002. - DOI - PMC - PubMed
    1. Amaral DG, Scharfman HE, Lavenex P. The dentate gyrus: fundamental neuroanatomical organization (dentate gyrus for dummies) Progress in Brain Research. 2007;163:3–22. doi: 10.1016/S0079-6123(07)63001-5. - DOI - PMC - PubMed
    1. Baccala LA, Sameshima K, Takahashi DY. Generalized Partial Directed Coherence. 15th International Conference on Digital Signal Processing; 2007. pp. 163–166.
    1. Backus AR, Schoffelen JM, Szebényi S, Hanslmayr S, Doeller CF. Hippocampal-Prefrontal Theta Oscillations Support Memory Integration. Current Biology. 2016;26:450–457. doi: 10.1016/j.cub.2015.12.048. - DOI - PubMed
    1. Bannerman DM, Grubb M, Deacon RM, Yee BK, Feldon J, Rawlins JN. Ventral hippocampal lesions affect anxiety but not spatial learning. Behavioural Brain Research. 2003;139:197–213. doi: 10.1016/S0166-4328(02)00268-1. - DOI - PubMed

Publication types