

Alterations of Metabolic and Lipid Profiles in Polymyxin-Resistant Pseudomonas aeruginosa
- PMID: 29632014
- PMCID: PMC5971563
- DOI: 10.1128/AAC.02656-17
Alterations of Metabolic and Lipid Profiles in Polymyxin-Resistant Pseudomonas aeruginosa
Abstract
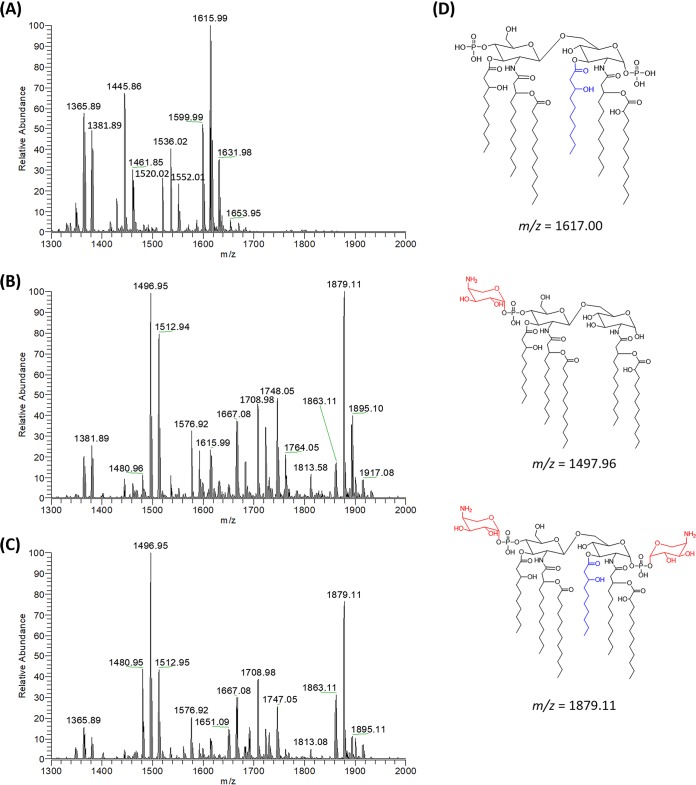
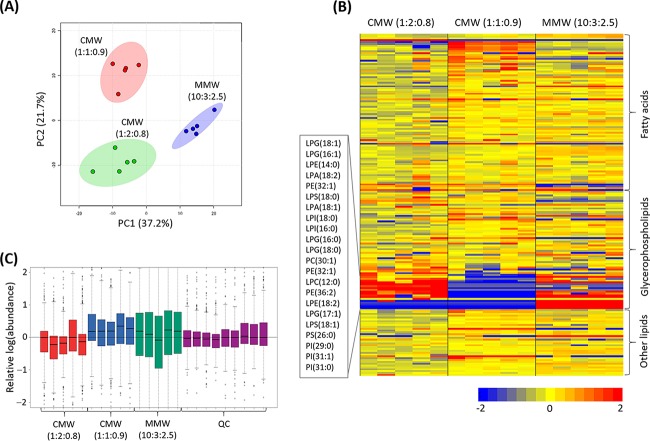
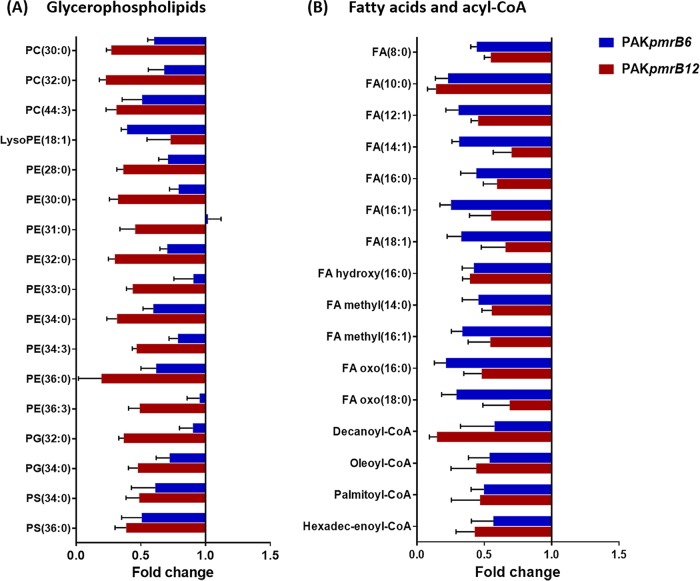
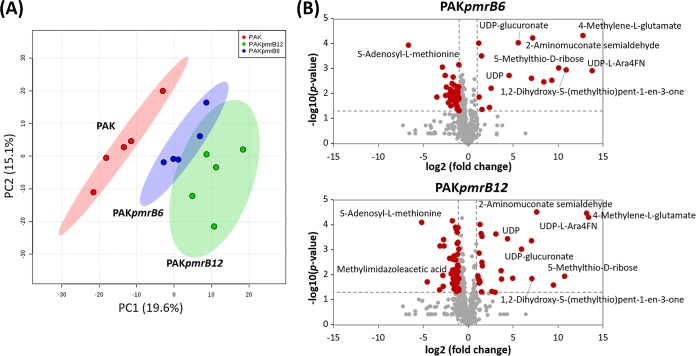
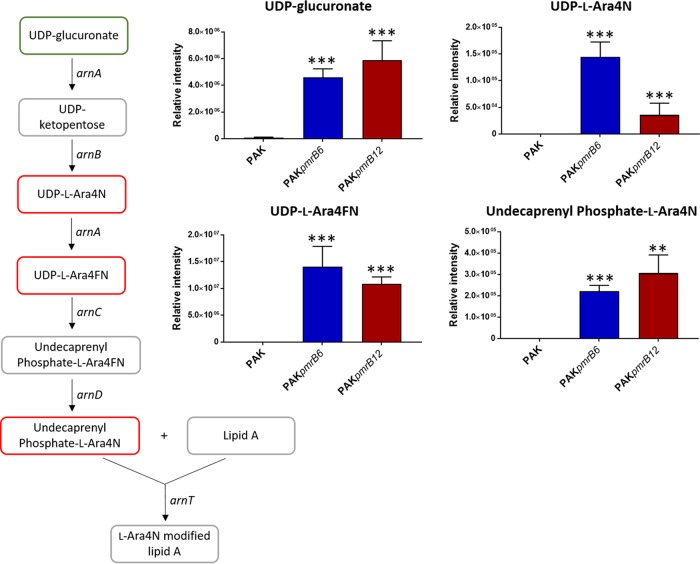
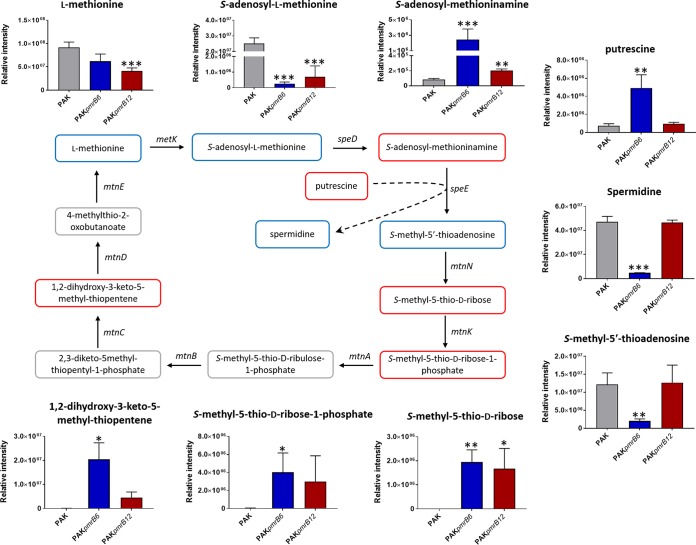
Multidrug-resistant Pseudomonas aeruginosa presents a global medical challenge, and polymyxins are a key last-resort therapeutic option. Unfortunately, polymyxin resistance in P. aeruginosa has been increasingly reported. The present study was designed to define metabolic differences between paired polymyxin-susceptible and -resistant P. aeruginosa strains using untargeted metabolomics and lipidomics analyses. The metabolomes of wild-type P. aeruginosa strain K ([PAK] polymyxin B MIC, 1 mg/liter) and its paired pmrB mutant strains, PAKpmrB6 and PAKpmrB12 (polymyxin B MICs of 16 mg/liter and 64 mg/liter, respectively) were characterized using liquid chromatography-mass spectrometry, and metabolic differences were identified through multivariate and univariate statistics. PAKpmrB6 and PAKpmrB12, which displayed lipid A modifications with 4-amino-4-deoxy-l-arabinose, showed significant perturbations in amino acid and carbohydrate metabolism, particularly the intermediate metabolites from 4-amino-4-deoxy-l-arabinose synthesis and the methionine salvage cycle pathways. The genomics result showed a premature termination (Y275stop) in speE (encoding spermidine synthase) in PAKpmrB6, and metabolomics data revealed a decreased intracellular level of spermidine in PAKpmrB6 compared to that in PAKpmrB12 Our results indicate that spermidine may play an important role in high-level polymyxin resistance in P. aeruginosa Interestingly, both pmrB mutants had decreased levels of phospholipids, fatty acids, and acyl-coenzyme A compared to those in the wild-type PAK. Moreover, the more resistant PAKpmrB12 mutant exhibited much lower levels of phospholipids than the PAKpmrB6 mutant, suggesting that the decreased phospholipid level was associated with polymyxin resistance. In summary, this study provides novel mechanistic information on polymyxin resistance in P. aeruginosa and highlights its impacts on bacterial metabolism.
Keywords: Pseudomonas aeruginosa; glycerophospholipids; l-Ara4N biosynthesis; lipid A modification; metabolomics; methionine salvage cycle; polymyxin resistance.
Copyright © 2018 American Society for Microbiology.
Figures
Similar articles
-
Comparative Metabolomics and Transcriptomics Reveal Multiple Pathways Associated with Polymyxin Killing in Pseudomonas aeruginosa.mSystems. 2019 Jan 8;4(1):e00149-18. doi: 10.1128/mSystems.00149-18. eCollection 2019 Jan-Feb. mSystems. 2019. PMID: 30637340 Free PMC article.
-
Metabolomics Study of the Synergistic Killing of Polymyxin B in Combination with Amikacin against Polymyxin-Susceptible and -Resistant Pseudomonas aeruginosa.Antimicrob Agents Chemother. 2019 Dec 20;64(1):e01587-19. doi: 10.1128/AAC.01587-19. Print 2019 Dec 20. Antimicrob Agents Chemother. 2019. PMID: 31611351 Free PMC article.
-
Lipid A Modification and Metabolic Adaptation in Polymyxin-Resistant, New Delhi Metallo-β-Lactamase-Producing Klebsiella pneumoniae.Microbiol Spectr. 2023 Aug 17;11(4):e0085223. doi: 10.1128/spectrum.00852-23. Epub 2023 Jul 11. Microbiol Spectr. 2023. PMID: 37432123 Free PMC article.
-
Synergistic combinations of polymyxins.Int J Antimicrob Agents. 2016 Dec;48(6):607-613. doi: 10.1016/j.ijantimicag.2016.09.014. Epub 2016 Oct 24. Int J Antimicrob Agents. 2016. PMID: 27865626 Free PMC article. Review.
-
Regulating polymyxin resistance in Gram-negative bacteria: roles of two-component systems PhoPQ and PmrAB.Future Microbiol. 2020 Apr;15(6):445-459. doi: 10.2217/fmb-2019-0322. Epub 2020 Apr 6. Future Microbiol. 2020. PMID: 32250173 Free PMC article. Review.
Cited by
-
Resistance and Heteroresistance to Colistin in Pseudomonas aeruginosa Isolates from Wenzhou, China.Antimicrob Agents Chemother. 2019 Sep 23;63(10):e00556-19. doi: 10.1128/AAC.00556-19. Print 2019 Oct. Antimicrob Agents Chemother. 2019. PMID: 31383654 Free PMC article.
-
Nitrite Promotes ROS Production to Potentiate Cefoperazone-Sulbactam-Mediated Elimination to Lab-Evolved and Clinical-Evolved Pseudomonas aeruginosa.Microbiol Spectr. 2022 Aug 31;10(4):e0232721. doi: 10.1128/spectrum.02327-21. Epub 2022 Jul 5. Microbiol Spectr. 2022. PMID: 35863024 Free PMC article.
-
Metabolomic studies of Pseudomonas aeruginosa.World J Microbiol Biotechnol. 2019 Nov 7;35(11):178. doi: 10.1007/s11274-019-2739-1. World J Microbiol Biotechnol. 2019. PMID: 31701321 Free PMC article. Review.
-
Repressed Central Carbon Metabolism and Its Effect on Related Metabolic Pathways in Cefoperazone/Sulbactam-Resistant Pseudomonas aeruginosa.Front Microbiol. 2022 Mar 3;13:847634. doi: 10.3389/fmicb.2022.847634. eCollection 2022. Front Microbiol. 2022. PMID: 35308347 Free PMC article.
-
Constitutive Phenotypic Modification of Lipid A in Clinical Acinetobacter baumannii Isolates.Microbiol Spectr. 2022 Aug 31;10(4):e0129522. doi: 10.1128/spectrum.01295-22. Epub 2022 Jul 21. Microbiol Spectr. 2022. PMID: 35861511 Free PMC article.
References
-
- Mesaros N, Nordmann P, Plésiat P, Roussel-Delvallez M, Van Eldere J, Glupczynski Y, Van Laethem Y, Jacobs F, Lebecque P, Malfroot A. 2007. Pseudomonas aeruginosa: resistance and therapeutic options at the turn of the new millennium. Clin Microbiol Infect 13:560–578. doi:10.1111/j.1469-0691.2007.01681.x. - DOI - PubMed
Publication types
MeSH terms
Substances
Grants and funding
LinkOut - more resources
Full Text Sources
Other Literature Sources
Medical
