

Mitochondrial DNA and TLR9 drive muscle inflammation upon Opa1 deficiency
- PMID: 29632021
- PMCID: PMC5978453
- DOI: 10.15252/embj.201796553
Mitochondrial DNA and TLR9 drive muscle inflammation upon Opa1 deficiency
Abstract
Opa1 participates in inner mitochondrial membrane fusion and cristae morphogenesis. Here, we show that muscle-specific Opa1 ablation causes reduced muscle fiber size, dysfunctional mitochondria, enhanced Fgf21, and muscle inflammation characterized by NF-κB activation, and enhanced expression of pro-inflammatory genes. Chronic sodium salicylate treatment ameliorated muscle alterations and reduced the muscle expression of Fgf21. Muscle inflammation was an early event during the progression of the disease and occurred before macrophage infiltration, indicating that it is a primary response to Opa1 deficiency. Moreover, Opa1 repression in muscle cells also resulted in NF-κB activation and inflammation in the absence of necrosis and/or apoptosis, thereby revealing that the activation is a cell-autonomous process and independent of cell death. The effects of Opa1 deficiency on the expression NF-κB target genes and inflammation were absent upon mitochondrial DNA depletion. Under Opa1 deficiency, blockage or repression of TLR9 prevented NF-κB activation and inflammation. Taken together, our results reveal that Opa1 deficiency in muscle causes initial mitochondrial alterations that lead to TLR9 activation, and inflammation, which contributes to enhanced Fgf21 expression and to growth impairment.
Keywords: endosome; mitochondrial dynamics; muscle disease; systemic inflammation.
© 2018 The Authors.
Figures
- A
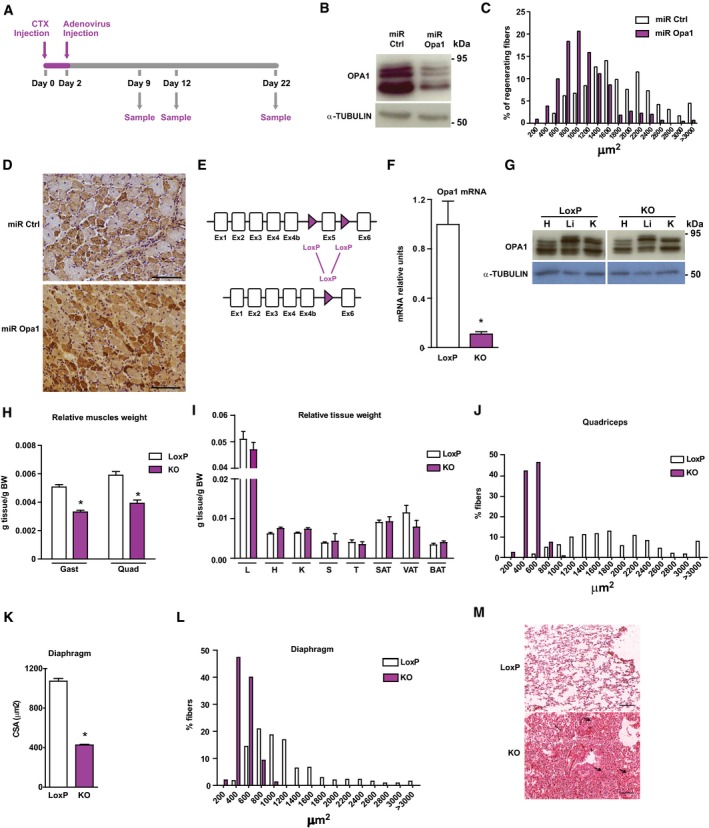
Scheme of the experimental design of CTX‐induced injury.
- B
Opa1 protein levels in control C2C12 myoblasts, which were transduced with control miRNA (miR Ctrl) or in Opa1 loss‐of‐function C2C12 myoblasts, which were transduced with adenoviruses encoding for miRNA against Opa1 (miR Opa1) (n = 5).
- C
Distribution of myofiber size in mice treated with miR Ctrl or miR Opa1 adenoviruses at dpi 12 (n = 5).
- D
Representative image of dMHC immunohistochemistry from gastrocnemius muscle treated with miR Ctrl or miR Opa1 adenoviruses (12 dpi). Scale bars, 100 μm.
- E
Partial genomic structure of the Opa1 gene showing the scission of exon 5, thus deleting all Opa1 protein isoforms.
- F
Opa1 mRNA levels in the gastrocnemius muscle of loxP (non‐expressing Cre Opa1loxP/loxP mice) and skeletal muscle‐specific KO mice (KO) (n = 10).
- G
Opa1 protein levels in tissue homogenates from control (loxP) and skeletal muscle‐specific KO mice (KO).
- H, I
Relative weight of muscles (gastrocnemius (Gast) and quadriceps (Quad)) (panel H) (n = 18) and organs (liver (L), heart (H), kidney (K), spleen (S), T thymus (T), subcutaneous adipose tissue (SAT), visceral adipose tissue (VAT), and brown adipose tissue (BAT)) (panel I) (n = 32) of 9‐week‐old loxP and KO mice. These data are expressed as g of tissue/g of body weight (BW).
- J
Distribution of myofiber size of 150 myofibers in quadriceps muscle.
- K, L
Mean cross‐sectional area (CSA) (K) and distribution of myofiber size (L) of 150 myofibers in diaphragm muscle.
- M
Representative images of hematoxylin and eosin‐stained lung sections from loxP and KO mice. Thick arrows indicate congestion and atelectasis. Thin arrows indicate normal parenchyma. Asterisks show bronchioles. Scale bars, 100 μm.
- A
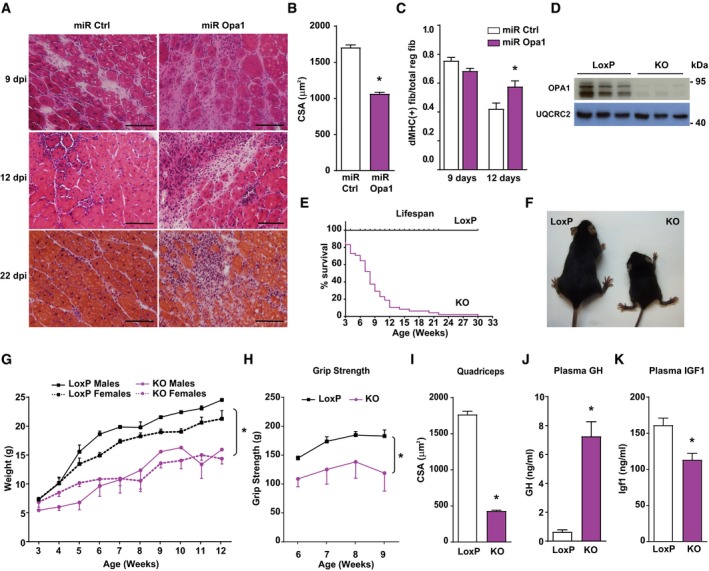
Transversal sections of gastrocnemius muscles of 3‐month‐old mice injected with CTX as an injury‐induced model and, 2 days later, with adenoviruses encoding for non‐targeting miRNA (miR Ctrl) or miRNA targeting Opa1 (miR Opa1). Samples were taken on various days after the injury (dpi, n = 5). Scale bars, 100 μm.
- B
Mean cross‐sectional area (CSA) of 150 myofibers per gastrocnemius muscle at dpi 12.
- C
Quantification of positive MHC myofibers vs. total regenerating myofibers of gastrocnemius muscle treated with miR Ctrl or miR Opa1 adenoviruses at dpi 9 and 12 (n = 5).
- D
Opa1 protein levels in tissue homogenates of control (loxP) and skeletal muscle‐specific KO mice (KO). The skeletal muscle used was gastrocnemius muscle (n = 6).
- E
Survival curves for loxP and Opa1 KO mice (n = 25).
- F
Picture of loxP and KO mice at 9 weeks of age.
- G
Body weight of loxP and KO male and female mice (n = 25).
- H
Grip strength in loxP and KO mice. loxP (n = 7) and KO (n = 4).
- I
Mean cross‐sectional area (CSA) of 150 myofibers in quadriceps muscle.
- J–K
Plasma concentration of growth hormone (GH) (J) and Igf1 (K) of loxP (n = 8) and KO mice (n = 10).
- A
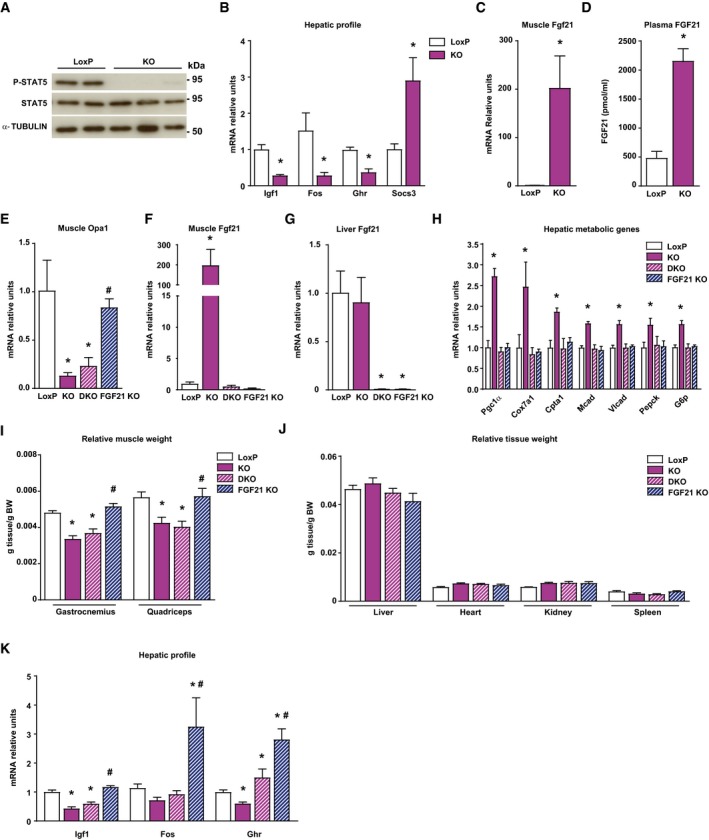
Stat5 phosphorylation in livers of loxP and KO mice (n = 10).
- B
mRNA levels of Igf1, Fos, growth hormone receptor (Ghr), and Socs3 in liver of loxP and KO mice (n = 5).
- C
Fgf21 gene expression in muscle of loxP and KO mice (n = 8).
- D
FGF21 levels in plasma of loxP (n = 8) and KO mice (n = 10).
- E–G
Opa1 mRNA levels in muscle (E), and Fgf21 gene expression in muscle (F) and liver (G) of loxP, Opa1 KO, FGF21 KO, and double KO (Opa1 + FGF21 KO, DKO) (n = 8).
- H
Hepatic expression of genes encoding Pgc1α, respiratory complex IV subunit Cox7a1, fatty acid oxidation components (Cpta1, Mcad, and Vlcad), and gluconeogenic enzymes (Pepck and G6p) in loxP, Opa1 KO, DKO, and Fgf21 KO mice (n = 7).
- I, J
Relative weight of gastrocnemius and quadriceps muscles, (I) and organs (J) of loxP, Opa1 KO, DKO, and Fgf21 KO mice (n = 10). These data are expressed as g of tissue/g of body weight (BW).
- K
Igf1, Fos, and Ghr mRNA levels in the livers of loxP, Opa1 KO, DKO, and Fgf21 KO mice (n = 10).
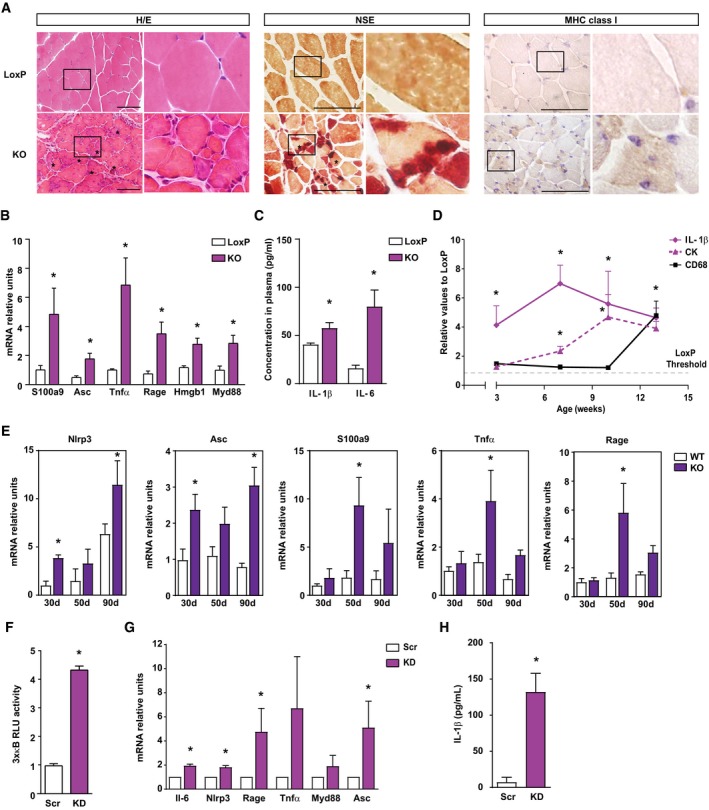
Representative images of hematoxylin and eosin (H/E) staining, non‐specific esterase (NSE) staining and MHC class I expression in gastrocnemius muscle sections of 6‐week‐old loxP and skeletal muscle‐specific Opa1 KO mice. Inset panels are 4× magnification of the outlined areas. Asterisks in H/E indicate necrotic fibers. Asterisks in NSE indicate the presence of macrophages. Scale bars, 100 μm.
Expression of NF‐κB target genes in muscles of loxP and KO mice (n = 7).
Circulating IL‐1β and IL‐6 measured in plasma of 8‐ to 10‐week‐old loxP and KO mice (n = 9).
Quantification of IL‐1β and CD68 expression in gastrocnemius, and CK activity in plasma of loxP and Opa1 KO animals at 3, 7, 10, and 13 weeks of age. Values of Opa1 KO mice are represented relative to the loxP group. The staining quantification was performed using Trainable Weka Segmentation plugin from ImageJ (5 images per group).
Expression of NF‐κB target genes in muscles of control and inducible skeletal muscle‐specific Opa1‐KO mice at 30, 50, and 90 days after tamoxifen treatment (n = 6).
Transcriptional activity of NF‐κB in myoblast expressing scramble shRNA (Scr) or shRNA against Opa1 (KD) (n = 5).
Expression of NF‐κB target genes in Scr and KD myoblasts (n = 6).
Levels of IL‐1β in culture media from C2C12 myoblasts (n = 6).
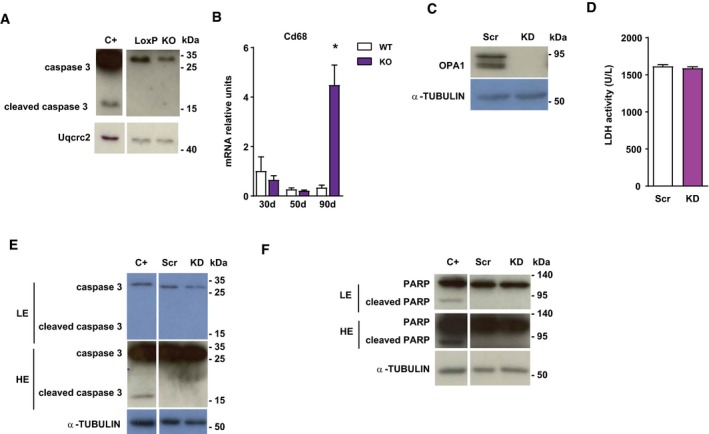
- A
Caspase 3 expression in loxP and skeletal muscle‐specific Opa1 KO mice.
- B
CD68 expression in muscles of control and inducible muscle‐specific Opa1 KO mice at 30, 50, and 90 days after tamoxifen treatment (n = 4).
- C
Opa1 protein levels in C2C12 control myoblasts (Scr) and in stably depleted Opa1 myoblasts (KD).
- D
LDH activity in cultured media of Scr and Opa1 KD myoblasts (n = 8).
- E, F
Caspase 3 (E) and Parp (F) expression in Scr and Opa1 KD myoblasts. Apoptosis‐positive control was obtained by treating C2C12 myoblasts with 10 μm staurosporin for 4 h.
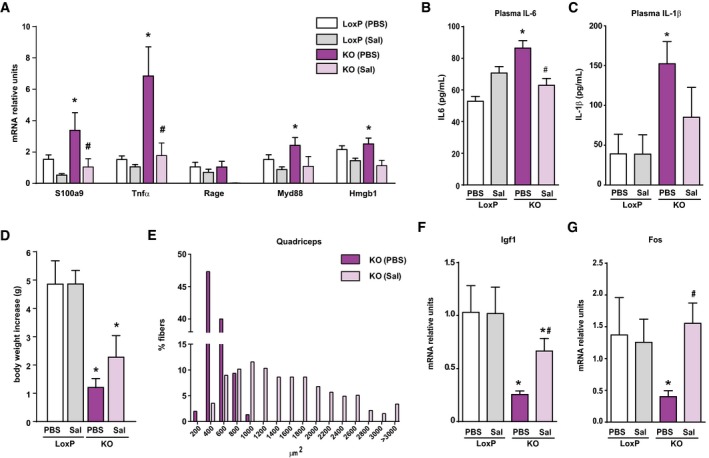
- A
Expression of NF‐κB target genes in muscles of loxP and KO mice treated with sodium salicylate (Sal) or with PBS (PBS).
- B, C
Circulating IL‐6 (B) and IL‐1β (C) measured in plasma of loxP and KO mice treated or not with sodium salicylate.
- D
Body weight increase in loxP and KO mice treated or not with salicylate for 20 days.
- E
Distribution of myofiber size in quadriceps muscles from loxP and KO mice treated or not with salicylate.
- F, G
Igf1 (F) and Fos (G) mRNA levels in liver from salicylate‐treated and non‐treated mice.
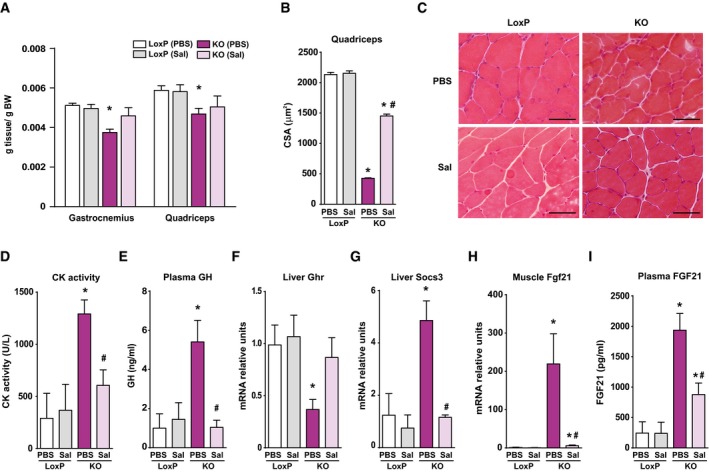
- A
Relative weight of gastrocnemius and quadriceps muscles of loxP and KO mice treated with sodium salicylate (Sal) or PBS (PBS) for 30 days.
- B
Mean CSA of 150 myofibers in quadriceps muscles.
- C
Representative H/E staining of quadriceps muscles of LoxP and KO mice treated with salicylate or PBS. Scale bars, 50 μm.
- D
Creatine kinase (CK) activity measured in plasma of salicylate‐treated and PBS‐treated mice.
- E
Circulating GH levels from salicylate‐treated and PBS‐treated animals.
- F, G
Growth hormone receptor (GHR) (F) and SOCS3 (G) mRNA levels in livers of treated and PBS‐treated animals.
- H
Fgf21 mRNA levels measured in tibialis muscle of salicylate‐treated and PBS‐treated mice.
- I
Concentration of Fgf21 in plasma of loxP and treated and PBS‐treated KO mice.
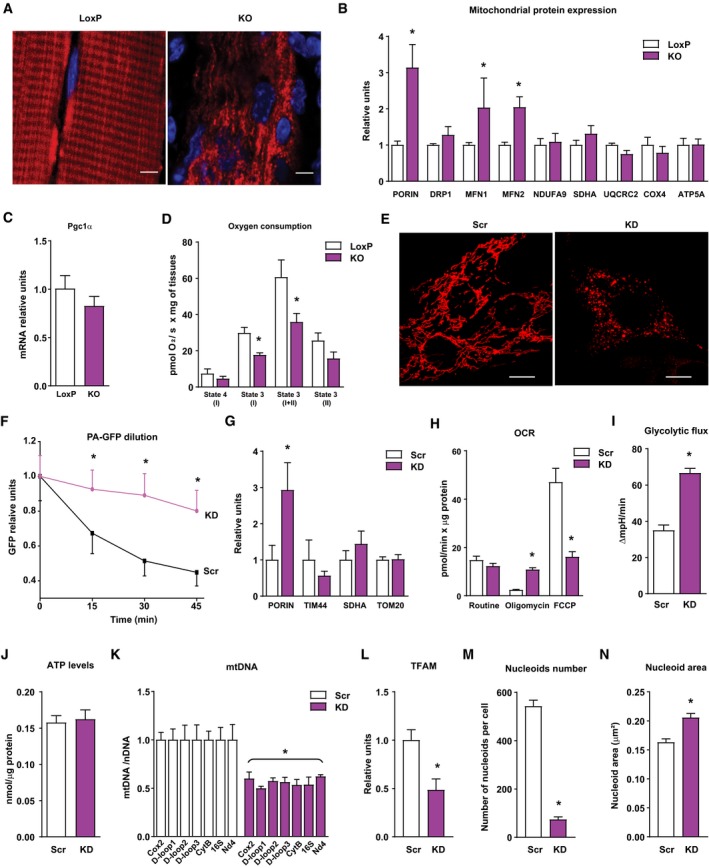
- A
Representative images of mitochondrial network of tibialis muscles of loxP and KO mice electroporated with cDNA encoding DsRed2‐Mito vector (n = 3). Scale bars, 5 μm.
- B
Relative mitochondrial protein expression of gastrocnemius muscles of loxP and KO mice. Values were corrected by α‐tubulin (10 observations per group).
- C
PGC‐1α expression in muscles of loxP and KO mice (n = 7).
- D
Mitochondrial respiration assayed in isolated myofibers of tibialis muscles (2–4 mg) from loxP or KO mice (n = 6).
- E
Mitochondrial morphology of control (Scr) and Opa1 KD (KD) C2C12 myoblasts. Scale bars, 10 μm.
- F
Estimation of mitochondrial fusion as PA‐GFP dilution in control (black line, n = 27) and Opa1‐silenced (purple line, n = 17) C2C12 myoblasts.
- G
Expression of mitochondrial proteins in Scr and Opa1 KD myoblasts (n = 4).
- H
Mitochondrial oxygen consumption rates (OCR) measured in intact Scr or Opa1‐silenced C2C12 myoblasts (n = 5). Five mM glucose was used as a substrate. Proton leak (respiration independent of ATP synthesis) was induced by 1.25 μM oligomycin (complex V inhibitor). Respiratory electron transfer system (ETS) capacity was analyzed using 1 μM FCCP. Non‐mitochondrial electron transport OCR was determined by the addition of the complex III inhibitor antimycin A (0.1 μM) and subtracted from the total OCR in order to obtain mitochondrial OCR.
- I
Glycolytic flux assessed as extracellular acidification rates were measured in intact Scr or KD C2C12 myoblasts (n = 5). Five mM glucose was used as a substrate.
- J
ATP content in Scr and Opa1 KD C2C12 myoblasts (n = 15).
- K
mtDNA levels relative to nuclear DNA (Tert) (n = 4).
- L
TFAM protein levels (n = 4).
- M, N
Nucleoid composition in Scr and Opa1 KD myoblasts. Number of mtDNA nucleoids per cell (M) and area of each nucleoid (N). Data are from a representative experiment with 20 cells randomly quantified per condition.
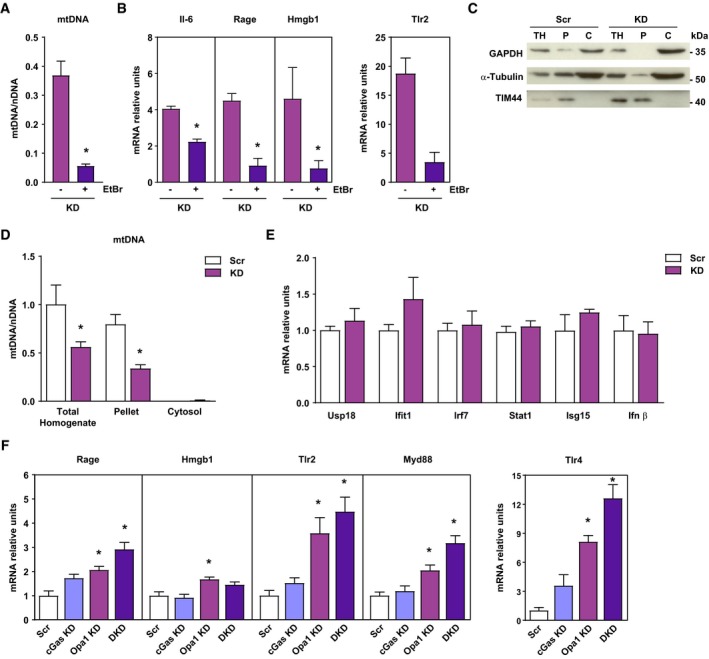
- A, B
mtDNA levels relative to nuclear DNA (D‐loop1 to Tert) and expression of NF‐κB target genes of Opa1 KD (KD) treated or not with EtBr. Relative values to untreated control myoblasts (n = 3).
- C
Representative experiment of cytosolic extraction by digitonin protocol. Total homogenate (TH), pellet fraction after cytosolic extraction (P), and cytosolic extract (C).
- D
mtDNA levels relative to nuclear DNA (D‐loop1 to Tert) in total homogenate, pellet and cytosolic fraction of Scr and Opa1 KD (KD) cells (n = 3).
- E
Scr and KD mRNA expression of interferon‐stimulated genes (ISG) and Ifnβ (n = 6).
- F
Expression of NF‐κB target genes in control (Scr), cGas depleted (cGas KD), Opa1 depleted (Opa1 KD), and double cGas‐Opa1 ablated (DKD) cells (n = 6).
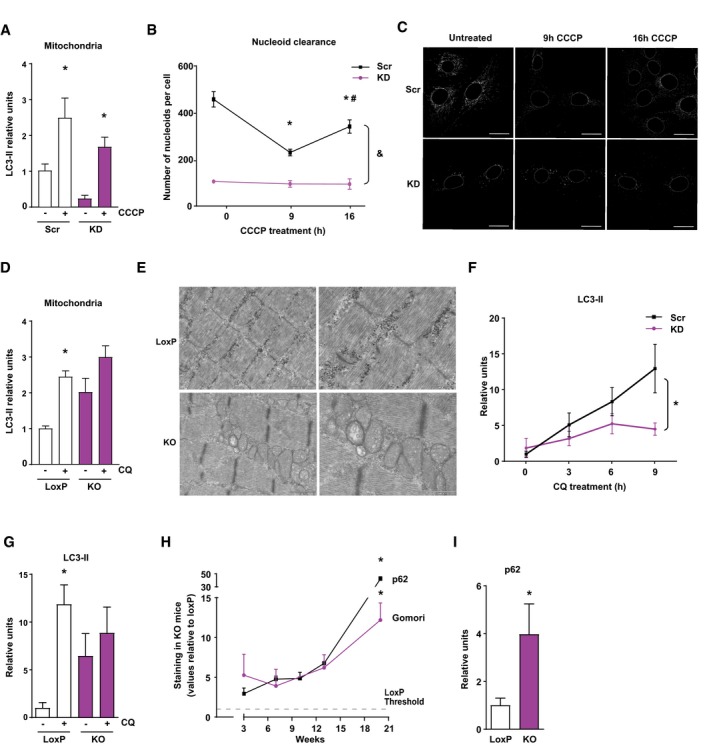
LC3‐II recruitment to mitochondrial enriched fractions in Scr and KD myoblasts after 30 min of CCCP treatment (n = 4).
Study of mitophagy completion by mtDNA nucleoid clearance upon long CCCP treatment in Scr and KD cells. Data represent mean ± SEM of three independent experiment with 20 cells randomly quantified per condition. *P < 0.05 vs. Scr untreated, # P < 0.05 vs. 9 h of treatment, and & P < 0.05 KD vs. Scr.
Representative images of the nucleoid clearance upon CCCP treatment. Scale bars 20 μm.
Relative LC3‐II protein levels in mitochondrial enriched fractions of quadriceps muscle after 5 days of intraperitoneal treatment with chloroquine (CQ) (10 observations per group).
Electron micrographs of gastrocnemius muscles from 3‐week‐old loxP and KO mice. Scale bars, 1 μm in left panels, and 500 nm in right panels.
Time‐course study of LC3‐II protein levels in Scr and KD C2C12 myoblasts under CQ treatment (n = 6).
Relative LC3‐II protein levels in total homogenates of gastrocnemius muscle after 5 days of intraperitoneal treatment with CQ (six observations per group).
Quantification of p62 expression and Gomori's Trichrome staining in gastrocnemius muscle of Opa1 KO animals at 3, 7, 10, 13, and 20 weeks of age. Values of Opa1 KO mice are represented relative to the loxP group. This quantification was performed using Trainable Weka Segmentation plugin from ImageJ (five images per group).
Relative expression of 3‐week‐old mice of p62 (seven and four observations in control and KO mice, respectively).
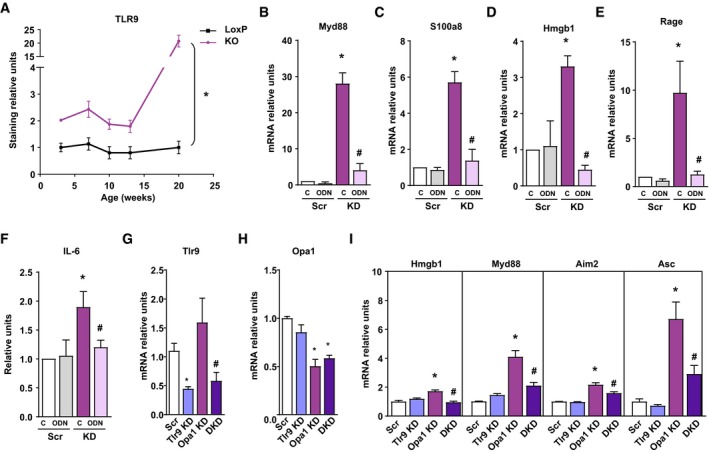
- A
Quantification of TLR9 expression immunostaining in gastrocnemius muscle of Opa1 KO animals at 3, 7, 10, 13, and 20 weeks of age. This quantification was performed using Trainable Weka Segmentation plugin from ImageJ (five images per group). Represented values are relative to loxP group.
- B–E
MyD88, S100A8, HMGB1, and RAGE expression in Scr and KD myoblasts treated with ODN2088 (ODN) or ODN2088 negative control (C) 1 μM (n = 9).
- F
IL‐6 levels detected in cultured medium of myoblasts (Scr and KD) treated with ODN2088 (ODN) or ODN2088 negative control (C) (n = 9).
- G, H
Expression of genes of TLR9 (G) and Opa1 (H) upon single or double knock‐down. n = 8 (G); n = 3 (H).
- I
Expression of NF‐κB target genes in control (Scr), Tlr9 depleted (Tlr9 KD), Opa1 depleted (Opa1 KD), and double Tlr9‐Opa1 ablated (DKD) cells (n = 3).
Similar articles
-
Mitochondrial DNA induces Foley catheter related bladder inflammation via Toll-like receptor 9 activation.Sci Rep. 2018 Apr 23;8(1):6377. doi: 10.1038/s41598-018-24818-w. Sci Rep. 2018. PMID: 29686303 Free PMC article.
-
Inhibition of the Fission Machinery Mitigates OPA1 Impairment in Adult Skeletal Muscles.Cells. 2019 Jun 15;8(6):597. doi: 10.3390/cells8060597. Cells. 2019. PMID: 31208084 Free PMC article.
-
Proteolytic processing of OPA1 links mitochondrial dysfunction to alterations in mitochondrial morphology.J Biol Chem. 2006 Dec 8;281(49):37972-9. doi: 10.1074/jbc.M606059200. Epub 2006 Sep 26. J Biol Chem. 2006. PMID: 17003040
-
OPA1 processing in cell death and disease - the long and short of it.J Cell Sci. 2016 Jun 15;129(12):2297-306. doi: 10.1242/jcs.159186. Epub 2016 May 17. J Cell Sci. 2016. PMID: 27189080 Review.
-
The dynamin GTPase OPA1: more than mitochondria?Biochim Biophys Acta. 2013 Jan;1833(1):176-83. doi: 10.1016/j.bbamcr.2012.08.004. Epub 2012 Aug 11. Biochim Biophys Acta. 2013. PMID: 22902477 Review.
Cited by
-
The Impact of Mitochondrial Deficiencies in Neuromuscular Diseases.Antioxidants (Basel). 2020 Oct 9;9(10):964. doi: 10.3390/antiox9100964. Antioxidants (Basel). 2020. PMID: 33050147 Free PMC article. Review.
-
Neuregulin, an Effector on Mitochondria Metabolism That Preserves Insulin Sensitivity.Front Physiol. 2020 Jun 23;11:696. doi: 10.3389/fphys.2020.00696. eCollection 2020. Front Physiol. 2020. PMID: 32655416 Free PMC article. Review.
-
Dysregulated Mitochondrial Dynamics and Metabolism in Obesity, Diabetes, and Cancer.Front Endocrinol (Lausanne). 2019 Sep 3;10:570. doi: 10.3389/fendo.2019.00570. eCollection 2019. Front Endocrinol (Lausanne). 2019. PMID: 31551926 Free PMC article. Review.
-
Intracellular to Interorgan Mitochondrial Communication in Striated Muscle in Health and Disease.Endocr Rev. 2023 Jul 11;44(4):668-692. doi: 10.1210/endrev/bnad004. Endocr Rev. 2023. PMID: 36725366 Free PMC article. Review.
-
A Glimpse of Inflammation and Anti-Inflammation Therapy in Diabetic Kidney Disease.Front Physiol. 2022 Jul 6;13:909569. doi: 10.3389/fphys.2022.909569. eCollection 2022. Front Physiol. 2022. PMID: 35874522 Free PMC article. Review.
References
-
- Alexander C, Votruba M, Pesch UE, Thiselton DL, Mayer S, Moore A, Rodriguez M, Kellner U, Leo‐Kottler B, Auburger G, Bhattacharya SS, Wissinger B (2000) OPA1, encoding a dynamin‐related GTPase, is mutated in autosomal dominant optic atrophy linked to chromosome 3q28. Nat Genet 26: 211–215 - PubMed
-
- Amati‐Bonneau P, Valentino ML, Reynier P, Gallardo ME, Bornstein B, Boissiere A, Campos Y, Rivera H, de la Aleja JG, Carroccia R, Iommarini L, Labauge P, Figarella‐Branger D, Marcorelles P, Furby A, Beauvais K, Letournel F, Liguori R, La Morgia C, Montagna P et al (2008) OPA1 mutations induce mitochondrial DNA instability and optic atrophy ‘plus’ phenotypes. Brain 131: 338–351 - PubMed
-
- Baixauli F, Acin‐Perez R, Villarroya‐Beltri C, Mazzeo C, Nunez‐Andrade N, Gabande‐Rodriguez E, Ledesma MD, Blazquez A, Martin MA, Falcon‐Perez JM, Redondo JM, Enriquez JA, Mittelbrunn M (2015) Mitochondrial respiration controls lysosomal function during inflammatory T cell responses. Cell Metab 22: 485–498 - PMC - PubMed
-
- Caielli S, Athale S, Domic B, Murat E, Chandra M, Banchereau R, Baisch J, Phelps K, Clayton S, Gong M, Wright T, Punaro M, Palucka K, Guiducci C, Banchereau J, Pascual V (2016) Oxidized mitochondrial nucleoids released by neutrophils drive type I interferon production in human lupus. J Exp Med 213: 697–713 - PMC - PubMed
Publication types
MeSH terms
Substances
LinkOut - more resources
Full Text Sources
Other Literature Sources
Medical
