. 2018 Apr 24;115(17):E4061-E4070.
doi: 10.1073/pnas.1712345115. Epub 2018 Apr 9.

PARP-1 protects against colorectal tumor induction, but promotes inflammation-driven colorectal tumor progression

Affiliations

PARP-1 protects against colorectal tumor induction, but promotes inflammation-driven colorectal tumor progression

Bastian Dörsam et al. Proc Natl Acad Sci U S A. .

Abstract

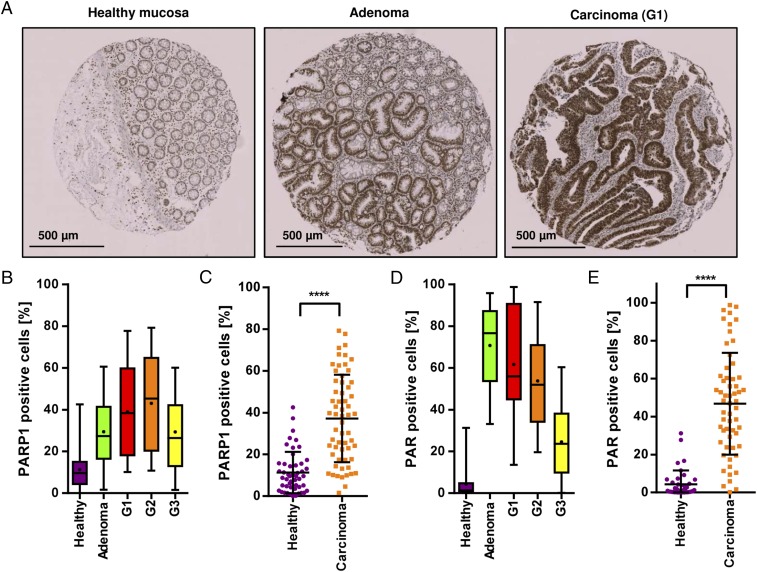
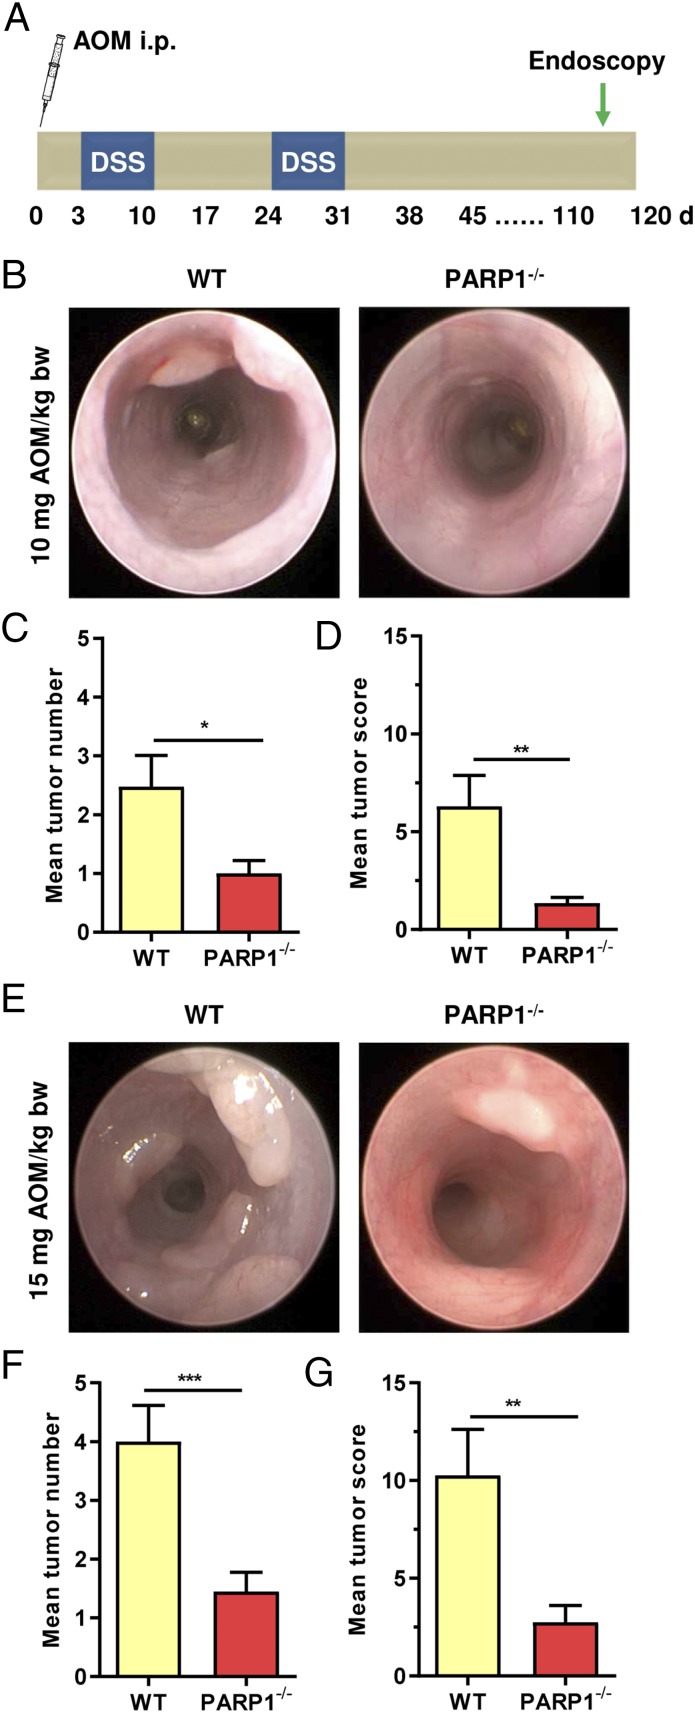
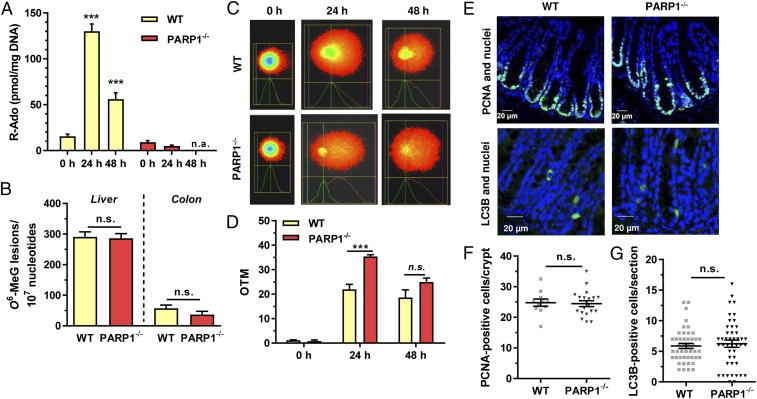
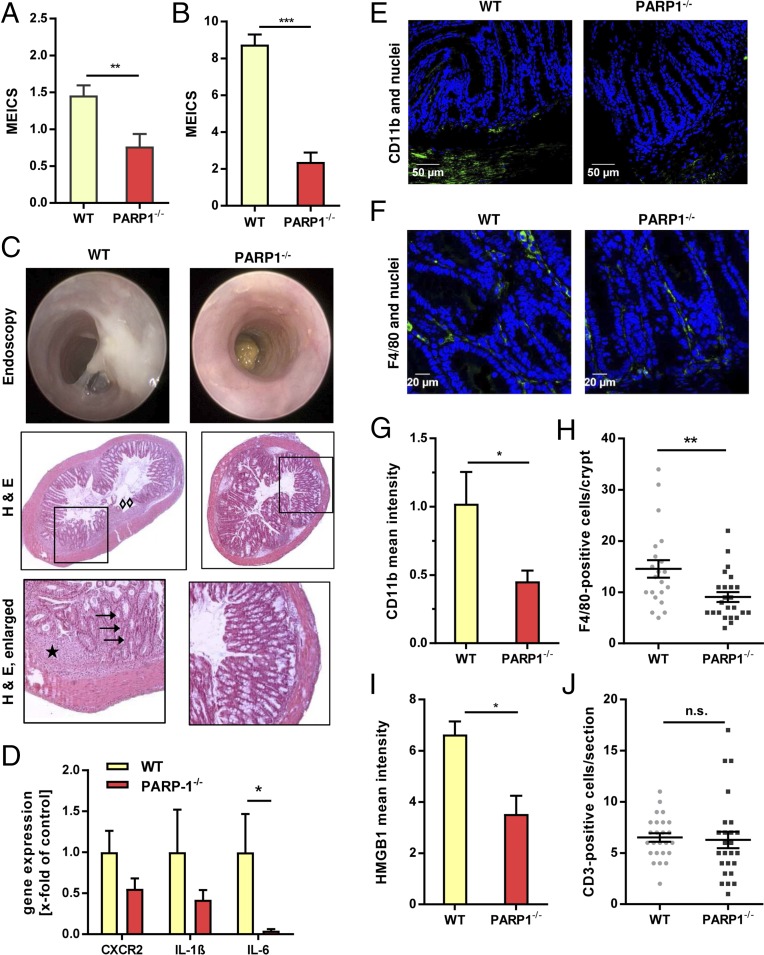
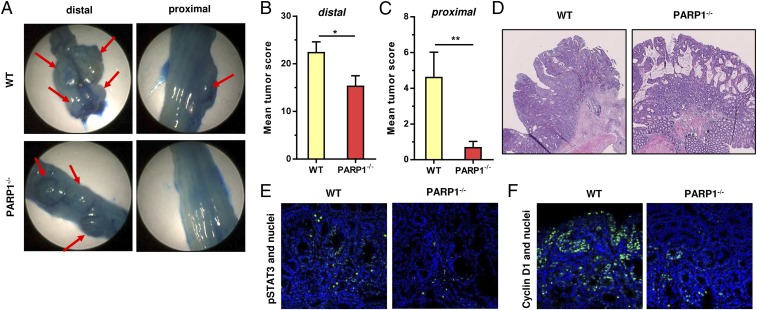
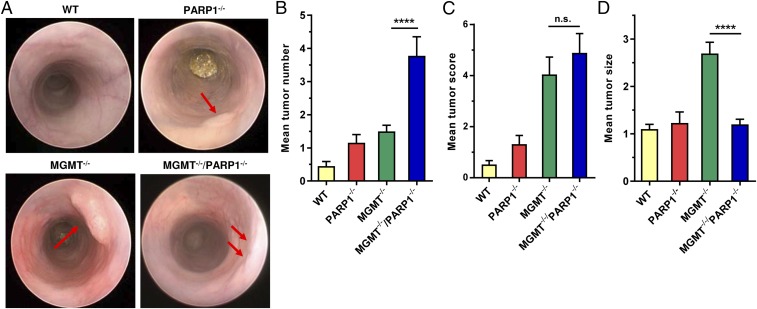
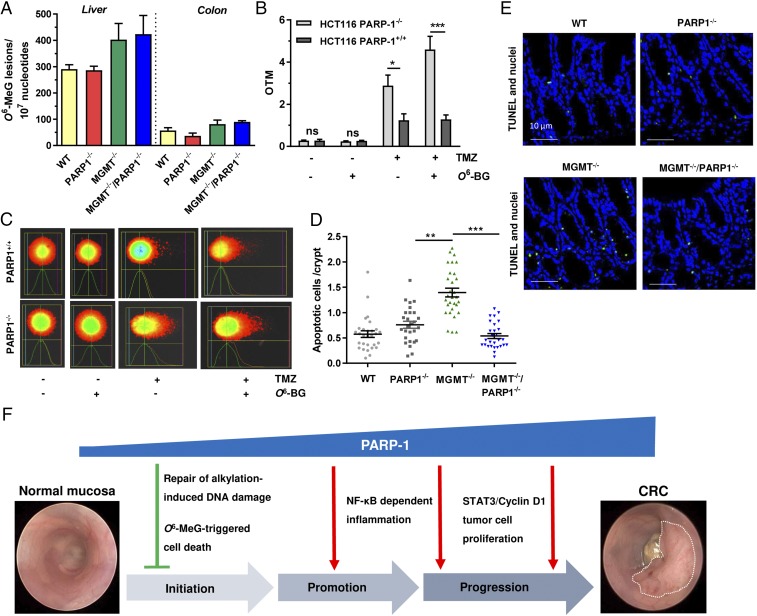
Colorectal cancer (CRC) is one of the most common tumor entities, which is causally linked to DNA repair defects and inflammatory bowel disease (IBD). Here, we studied the role of the DNA repair protein poly(ADP-ribose) polymerase-1 (PARP-1) in CRC. Tissue microarray analysis revealed PARP-1 overexpression in human CRC, correlating with disease progression. To elucidate its function in CRC, PARP-1 deficient (PARP-1-/-) and wild-type animals (WT) were subjected to azoxymethane (AOM)/ dextran sodium sulfate (DSS)-induced colorectal carcinogenesis. Miniendoscopy showed significantly more tumors in WT than in PARP-1-/- mice. Although the lack of PARP-1 moderately increased DNA damage, both genotypes exhibited comparable levels of AOM-induced autophagy and cell death. Interestingly, miniendoscopy revealed a higher AOM/DSS-triggered intestinal inflammation in WT animals, which was associated with increased levels of innate immune cells and proinflammatory cytokines. Tumors in WT animals were more aggressive, showing higher levels of STAT3 activation and cyclin D1 up-regulation. PARP-1-/- animals were then crossed with O6-methylguanine-DNA methyltransferase (MGMT)-deficient animals hypersensitive to AOM. Intriguingly, PARP-1-/-/MGMT-/- double knockout (DKO) mice developed more, but much smaller tumors than MGMT-/- animals. In contrast to MGMT-deficient mice, DKO animals showed strongly reduced AOM-dependent colonic cell death despite similar O6-methylguanine levels. Studies with PARP-1-/- cells provided evidence for increased alkylation-induced DNA strand break formation when MGMT was inhibited, suggesting a role of PARP-1 in the response to O6-methylguanine adducts. Our findings reveal PARP-1 as a double-edged sword in colorectal carcinogenesis, which suppresses tumor initiation following DNA alkylation in a MGMT-dependent manner, but promotes inflammation-driven tumor progression.

Keywords: DNA repair; PARP-1; colorectal carcinogenesis; intestinal inflammation; mouse models.


Conflict of interest statement

The authors declare no conflict of interest.

Figures

Fig. 1.
Fig. 1.
Expression of PARP-1 and its product PAR in CRC and correlation with disease progression. (A) PARP-1 staining in healthy colorectal mucosa, adenoma, and carcinoma with respect to the grade of differentiation. Representative cores of healthy tissue, adenoma tissue, and well-differentiated carcinoma (G1). (B and C) Quantitative evaluation of PARP-1 positive cells in healthy mucosa (n = 49), adenoma (n = 19), G1–G3 carcinoma (n = 19, 21, and 20, respectively). (D and E) Quantitative assessment of PAR staining, reflecting PARP-1 activity in situ, in the same set of tissue samples. Healthy mucosa (n = 39), adenoma (n = 19), G1–G3 carcinoma (n = 19, 20, and 19, respectively). Data represent median (B and D) or mean ± SD (C and E). ****P < 0.0001 as determined by Student’s t test.
Fig. 2.
Fig. 2.
PARP-1 promotes AOM/DSS-triggered colorectal carcinogenesis. (A) Scheme of the used AOM/DSS model. (BD) Tumor formation in PARP-1–proficient WT animals (n = 23) and PARP-1–deficient animals (PARP-1−/−) (n = 20) treated with 10 mg AOM per kilogram of body weight (kg/bw) followed by two cycles of 1% DSS in the drinking water. Representative images obtained during miniendoscopy (B) are shown. Tumor number (C) and tumor size were assessed after 16 wk by miniendoscopy, which was used to calculate the tumor score (D). (EG) Tumor formation in WT (n = 15) and PARP-1−/− (n = 20) animals treated with 15 mg AOM/kg bw followed by two cycles of 1% DSS in the drinking water. Representative images obtained during miniendoscopy (E) are shown. Tumor number (F) and tumor size were assessed after 16 wk by miniendoscopy, which was used to calculate the tumor score (G). Data are shown as mean + SEM. *P < 0.05, **P < 0.01, ***P < 0.005 as determined by Student’s t test.
Fig. 3.
Fig. 3.
Loss of PARP-1 moderately increases DNA strand break formation. (A) Time-dependent formation of PAR in WT and PARP-1−/− animals upon AOM treatment. Animals received 10 mg AOM/kg bw. PAR levels in the liver were determined as ribosyl-adenosine (R-Ado) using LC-MS/MS analysis. Data are depicted as mean + SEM (n = 3 per genotype and time point). ***P < 0.005 compared with 0 h (untreated control); n.a., not assessed. (B) Detection of hepatic and colonic O6-MeG DNA adducts in WT and PARP-1−/− animals 24 h after AOM injection using mass spectrometry. (n = 3 per genotype). (C) Assessment of AOM-induced DNA strand breaks in WT and PARP-1−/− mice. Following AOM treatment, liver tissue was isolated and subjected to alkaline Comet assay. Representative pictures are shown. (D) Quantitative evaluation of alkaline Comet assay. Data are presented as mean + SEM (n = 3 per time point and genotype). ***P < 0.005; n.s., not significant. (E) Basal proliferation (Top) and AOM-induced autophagy (Bottom) in colon crypts of WT and PARP-1−/− animals (Top). Proliferating cells were visualized by PCNA staining (green) and nuclei by TO-PRO-3 staining (blue) followed by confocal microscopy. Autophagy was assessed by LC3B staining and confocal microscopy. Representative pictures are shown. (F) Quantification of PCNA staining. Data are presented as mean + SEM (n = 3 per genotype; ≥4 sections per sample); n.s., not significant. (G) Quantification of LC3B-positive cells per section. Results are depicted as mean + SEM (n = 3 per genotype; ≥10 sections per sample); n.s. not significant. Statistical significance was determined by Student’s t test.
Fig. 4.
Fig. 4.
PARP-1 deficiency confers resistance to DSS-triggered gut inflammation. (A and B) Analysis of AOM/DSS-induced mucosal inflammation in WT (n = 18 and n = 17, respectively) and PARP-1−/− (n = 15 and n = 14, respectively) animals. Mice were challenged with 15 mg AOM + 1% DSS (A) or 10 mg AOM + 2.5% DSS (B) and the MEICS was assessed by miniendoscopy after the first DSS cycle. **P < 0.005, ***P < 0.0005. (C) Representative images of B and corresponding H&E staining of colon sections. Arrows show loss of crypt architecture and disappearance of goblet cells (arrows). Diamonds indicate regions of mucosal erosions and hyperplasia. The star highlights mucosal edema. (D) Determination of proinflammatory gene expression in WT and PARP-1−/− animals. Animals were treated as described above (B), killed after the first DSS cycle, and colorectal tissue was harvested. Gene expression was normalized to the WT and is presented as mean + SEM (n ≥ 3 per genotype). *P < 0.05. (E and F) Visualization of CD11b-positive cells (monocytes) and F4/80-positive cells (macrophages) in WT and PARP-1−/− animals after AOM/DSS treatment. Representative confocal images are shown. (G and H) Quantitative assessment of CD11b staining intensity and F4/80-positive cells. Data are given as mean + SEM (n = 3 per genotype; ≥7 sections per sample). *P < 0.05, **P < 0.005. (I) Detection of the proinflammatory cytokine HMGB1 in WT and PARP-1−/− mice challenged as described in B. Results are shown as mean + SEM (n = 3 per genotype; ≥7 sections per sample). *P < 0.05. (J) CD3-positive cells (T lymphocytes) depicted as mean + SEM (n = 3 per genotype, ≥7 sections per sample); n.s., not significant. Statistical significance was determined by Student’s t test.
Fig. 5.
Fig. 5.
PARP-1 supports tumor growth and fosters the IL6-STAT3-cyclin D1 axis. (A) Tumor formation in WT and PARP-1−/− animals. Mice were injected with 10 mg AOM/kg bw followed by two cycles with 2.5% DSS in the drinking water. After 12 wk, isolated colon was opened, stained with methylene blue, and tumors were recorded with the miniendoscopy system. Representative distal and proximal colon sections are shown. (B and C) Tumor score in the distal colon and in the proximal colon. Data are shown as mean + SEM (n = 14 per genotype). *P < 0.05; **P < 0.01. (D) H&E staining of colorectal tumors. (E and F) p-STAT3 and cyclin D1 staining in AOM/DSS-induced colorectal tumors of WT (n = 4) and PARP-1−/− (n = 3) animals. Representative confocal images are shown.
Fig. 6.
Fig. 6.
PARP-1 supports tumor growth, but protects against tumor induction depending on MGMT. (A) Tumor formation in WT, PARP-1−/−, MGMT−/−, and MGMT−/−/PARP-1−/− double knockout animals. Animals were challenged with 3 mg AOM/kg bw followed by two cycles with 1% DSS. Please note that PARP1−/− animals received 5 mg AOM. After 16 wk, tumor number and size was determined by miniendoscopy. Representative images are depicted. Red arrows indicate tumors. (B) Tumor number, (C) tumor score, and (D) tumor size. Data of WT and MGMT−/− animals have been reported previously (4). Values are expressed as mean + SEM (n ≥ 19 for WT, PARP-1−/−, and MGMT−/− animals; n = 9 for MGMT−/−/PARP-1−/−). ****P < 0.0001. Statistical significance was determined by Student’s t test.
Fig. 7.
Fig. 7.
Impact of PARP-1 on alkylation-induced DNA damage and cell death depending on the MGMT status. (A) Detection of hepatic and colonic O6-MeG DNA adducts in WT, PARP-1−/−, MGMT−/−, and MGMT−/−/PARP-1−/− animals 24 h after AOM injection using mass spectrometry (n = 3 per genotype). (B and C) DNA strand break induction in PARP-1–proficient and –deficient HCT116 cells depending on the MGMT activity. Cells were exposed to the SN1-alkylating agent TMZ and subjected to the alkaline Comet assay after 24 h in the absence or presence of the MGMT inhibitor O6-BG. Representative pictures are shown. OTM, olive tail moment. Data are presented as mean + SEM (n ≥ 4 per treatment group). ***P < 0.005; *P < 0.05; n.s., not significant. (D and E) AOM-dependent cell death induction in WT, PARP-1−/−, MGMT−/−, and MGMT−/−/PARP-1−/− mice. Apoptotic cells were labeled in situ by TUNEL staining (green). Representative pictures are shown. Data are given as mean + SEM (n = 3 per genotype; ≥9 sections per sample). ***P < 0.005; **P < 0.01. (F) Involvement of PARP-1 in colorectal carcinogenesis and underlying mechanisms, which are responsible for the opposing function of PARP-1 in tumor induction vs. tumor progression.

Similar articles

Cited by

References

    1. Kuipers EJ, et al. Colorectal cancer. Nat Rev Dis Primers. 2015;1:15065. - PMC - PubMed
    1. Markowitz SD, Bertagnolli MM. Molecular origins of cancer: Molecular basis of colorectal cancer. N Engl J Med. 2009;361:2449–2460. - PMC - PubMed
    1. Fahrer J, Kaina B. O6-methylguanine-DNA methyltransferase in the defense against N-nitroso compounds and colorectal cancer. Carcinogenesis. 2013;34:2435–2442. - PubMed
    1. Fahrer J, et al. DNA repair by MGMT, but not AAG, causes a threshold in alkylation-induced colorectal carcinogenesis. Carcinogenesis. 2015;36:1235–1244. - PubMed
    1. Bugni JM, Meira LB, Samson LD. Alkylation-induced colon tumorigenesis in mice deficient in the Mgmt and Msh6 proteins. Oncogene. 2009;28:734–741. - PMC - PubMed

Publication types

MeSH terms