. 2018 May 8;115(19):E4368-E4376.
doi: 10.1073/pnas.1717920115. Epub 2018 Apr 9.

Live-cell analysis of endogenous GFP-RPB1 uncovers rapid turnover of initiating and promoter-paused RNA Polymerase II

Affiliations

Live-cell analysis of endogenous GFP-RPB1 uncovers rapid turnover of initiating and promoter-paused RNA Polymerase II

Barbara Steurer et al. Proc Natl Acad Sci U S A. .

Abstract

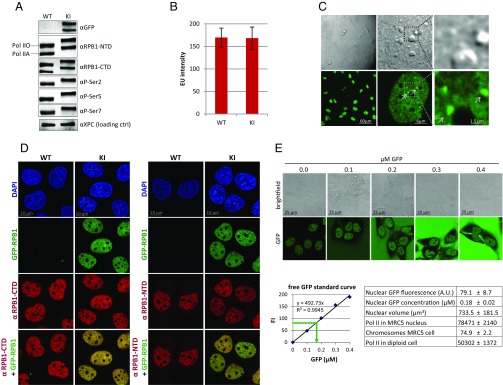
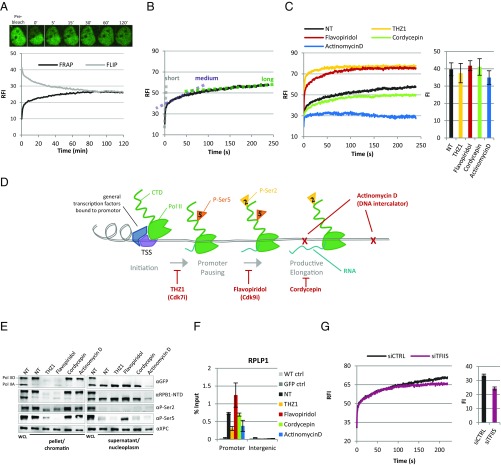
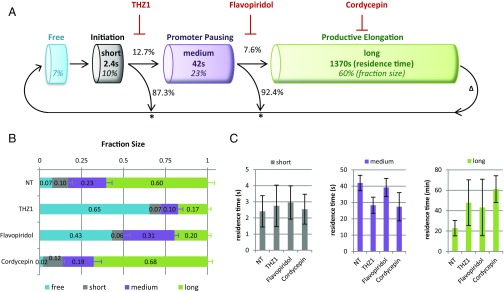
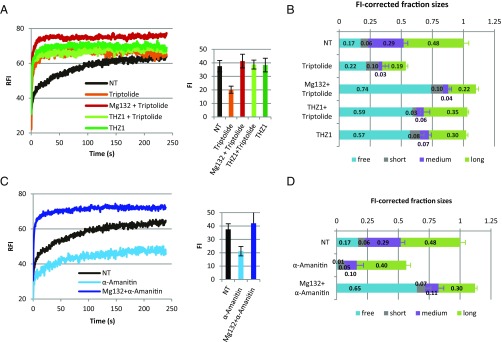
Initiation and promoter-proximal pausing are key regulatory steps of RNA Polymerase II (Pol II) transcription. To study the in vivo dynamics of endogenous Pol II during these steps, we generated fully functional GFP-RPB1 knockin cells. GFP-RPB1 photobleaching combined with computational modeling revealed four kinetically distinct Pol II fractions and showed that on average 7% of Pol II are freely diffusing, while 10% are chromatin-bound for 2.4 seconds during initiation, and 23% are promoter-paused for only 42 seconds. This unexpectedly high turnover of Pol II at promoters is most likely caused by premature termination of initiating and promoter-paused Pol II and is in sharp contrast to the 23 minutes that elongating Pol II resides on chromatin. Our live-cell-imaging approach provides insights into Pol II dynamics and suggests that the continuous release and reinitiation of promoter-bound Pol II is an important component of transcriptional regulation.

Keywords: RNA Polymerase II; live-cell imaging; promoter-proximal pausing; transcription; transcription dynamics.


Conflict of interest statement

The authors declare no conflict of interest.

Figures

Fig. 1.
Fig. 1.
Characterization of GFP-RPB1 KI cells. (A) Western blot of MRC-5 WT and GFP-RPB1 KI cells. Pol IIA, hypophosphorylated Pol II; Pol IIO, hyperphosphorylated Pol II; P-Ser, phosphoserine. (B) EU incorporation levels of WT and KI cells. Mean total nuclear fluorescence intensity (FI) ± SD, n = 60 cells, two independent experiments. (C) Live-cell images of KI cells. Arrows indicate foci of locally enriched Pol II. (D) Immunofluorescent stainings of RPB1-CTD (Left) and RPB1-NTD (Right) in WT and KI cells. DNA is stained with DAPI, GFP fluorescence from endogenously expressed GFP-RPB1. (E) Representative images of KI cells with increasing concentrations of free GFP in the culture medium. Extracellular GFP fluorescence was plotted against GFP concentration to make a standard curve (graph, Lower Left) and nuclear Pol II concentration was calculated based on the standard curve (indicated with the green arrow). Numbers used to calculate the amount of Pol II in a diploid nucleus are summarized in the table (Lower Right). Table shows mean ± SD, n = 40 cells of two independent experiments.
Fig. 2.
Fig. 2.
Real-time measurements of Pol II kinetics at different transcription cycle stages. (A) FRAP of the bleached and fluorescence loss in photobleaching (FLIP) of the nonbleached half of nuclei are plotted in time. Images are snapshots of a representative cell at indicated time points. RFI, Relative fluorescence intensity, Mean of n = 20 cells of two independent experiments. Image size is 15 × 18 μm. (B) Strip-FRAP analysis of GFP-RPB1 in NT cells. GFP-RPB1 was bleached in a narrow strip spanning the nucleus. Fluorescence recovery was measured every 0.4 s for 4 min, background-corrected, and normalized to prebleach fluorescence intensity. The dotted lines indicate kinetically distinct Pol II fractions, which mainly represent Pol II complexes that are short-term (gray), medium-term (purple), or long-term (green). Mean ± SD, n = 20 cells of two independent experiments. (C) Strip-FRAP of GFP-RPB1 in NT cells and after 1 h of treatment with the indicated transcription inhibitors. Column chart (Right) shows average GFP-RPB1 prebleach fluorescence intensities (FI) of cells analyzed by FRAP as a measure for Pol II protein levels. n > 16 cells per condition measured in two independent experiments. FI chart shows mean ± SD. (D) Schematic representation of Pol II transcription cycle and points of action of the used transcription inhibitors. THZ1 inhibits the phosphorylation of Ser5 by Cdk7. Flavopiridol inhibits the phosphorylation of Ser2 by Cdk9. Cordycepin is a 3′deoxy adenosine analog that stalls chain elongation when incorporated into the mRNA. Actinomycin D is a DNA intercalator. (E) Western blot of GFP-RPB1 KI whole-cell lysates (WCL) and chromatin and nucleoplasm fractions of NT cells and cells treated for 90 min with the indicated transcription inhibitors. NTD, N-terminal domain of RPB1. (F) Pol II binding to the RPLP1 promoter measured by chromatin-immunoprecipitation. WT and cells expressing free GFP (GFP) were analyzed as controls (ctrl). Mean ± SEM of n = 3 independent experiments. (G) FRAP of GFP-RPB1 after transfection with a nontargeting control siRNA (siCTRL) or siRNAs targeting the TFIIS paralogues TCEA1 and TCEA2 (siTFIIS). Mean of n = 20 cells of two independent experiments.
Fig. 3.
Fig. 3.
MC modeling of live cell Pol II kinetics. (A) Schematic representation of possible binding and release steps of Pol II to DNA. Modeled fraction sizes are depicted as percentages and written in italics. Modeled residence times of Pol II in different stages are written in bold. Chances for Pol II to pass through or exit a stage were calculated from kon and koff rate constants (see Materials and Methods) and are given as percentages. An asterisk (*) marks points of abortive Pol II release, ∆ marks Pol II release after transcription termination. (B) Fraction sizes and (C) residence times of short-, medium-, and long-bound Pol II fractions obtained from MC-based modeling of GFP-RPB1 FRAP data (Fig. 2B) of NT GFP-RPB1 KI cells or after 1 h of treatment with 1 µM THZ1, or 1 µM Flavopiridol, or 100 µM Cordycepin. Mean ± SD of the 10 best-fitting simulations.
Fig. 4.
Fig. 4.
Live-cell Pol II kinetics after Triptolide and α-Amanitin. FRAP of GFP-RPB1 in NT cells and cells treated with 0.5 µM Triptolide for 1 h (A) or 100 µg/mL α-Amanitin for 2 h (C). Mg132, proteasome inhibitor. Mean of n = 20 cells of two independent experiments, FI chart shows mean ± SD. Modeled, FI-corrected Pol II fraction sizes in NT KI cells or after treatment with Triptolide (B) or α-Amanitin (D). Mean ± SD of the 10 best-fitting simulations.

Comment in

  • Transient pausing by RNA polymerase II.
    Price DH. Price DH. Proc Natl Acad Sci U S A. 2018 May 8;115(19):4810-4812. doi: 10.1073/pnas.1805129115. Epub 2018 Apr 24. Proc Natl Acad Sci U S A. 2018. PMID: 29691322 Free PMC article. No abstract available.

References

    1. Sainsbury S, Bernecky C, Cramer P. Structural basis of transcription initiation by RNA polymerase II. Nat Rev Mol Cell Biol. 2015;16:129–143. - PubMed
    1. Jonkers I, Lis JT. Getting up to speed with transcription elongation by RNA polymerase II. Nat Rev Mol Cell Biol. 2015;16:167–177. - PMC - PubMed
    1. Heidemann M, Hintermair C, Voß K, Eick D. Dynamic phosphorylation patterns of RNA polymerase II CTD during transcription. Biochim Biophys Acta. 2013;1829:55–62. - PubMed
    1. Scheidegger A, Nechaev S. RNA polymerase II pausing as a context-dependent reader of the genome. Biochem Cell Biol. 2016;94:82–92. - PMC - PubMed
    1. Adelman K, Lis JT. Promoter-proximal pausing of RNA polymerase II: Emerging roles in metazoans. Nat Rev Genet. 2012;13:720–731. - PMC - PubMed

Publication types

MeSH terms

Substances

LinkOut - more resources