

Cross-talk between monocyte invasion and astrocyte proliferation regulates scarring in brain injury
- PMID: 29632244
- PMCID: PMC5934774
- DOI: 10.15252/embr.201745294
Cross-talk between monocyte invasion and astrocyte proliferation regulates scarring in brain injury
Abstract
Scar formation after brain injury is still poorly understood. To further elucidate such processes, here, we examine the interplay between astrocyte proliferation taking place predominantly at the vascular interface and monocyte invasion. Using genetic mouse models that decrease or increase reactive astrocyte proliferation, we demonstrate inverse effects on monocyte numbers in the injury site. Conversely, reducing monocyte invasion using CCR2-/- mice causes a strong increase in astrocyte proliferation, demonstrating an intriguing negative cross-regulation between these cell types at the vascular interface. CCR2-/- mice show reduced scar formation with less extracellular matrix deposition, smaller lesion site and increased neuronal coverage. Surprisingly, the GFAP+ scar area in these mice is also significantly decreased despite increased astrocyte proliferation. Proteomic analysis at the peak of increased astrocyte proliferation reveals a decrease in extracellular matrix synthesizing enzymes in the injury sites of CCR2-/- mice, highlighting how early key aspects of scar formation are initiated. Taken together, we provide novel insights into the cross-regulation of juxtavascular proliferating astrocytes and invading monocytes as a crucial mechanism of scar formation upon brain injury.
Keywords: aryl hydrocarbon receptor; astrogliosis; monocytes; scar formation; sonic hedgehog pathway; traumatic brain injury.
© 2018 The Authors. Published under the terms of the CC BY NC ND 4.0 license.
Figures
- A
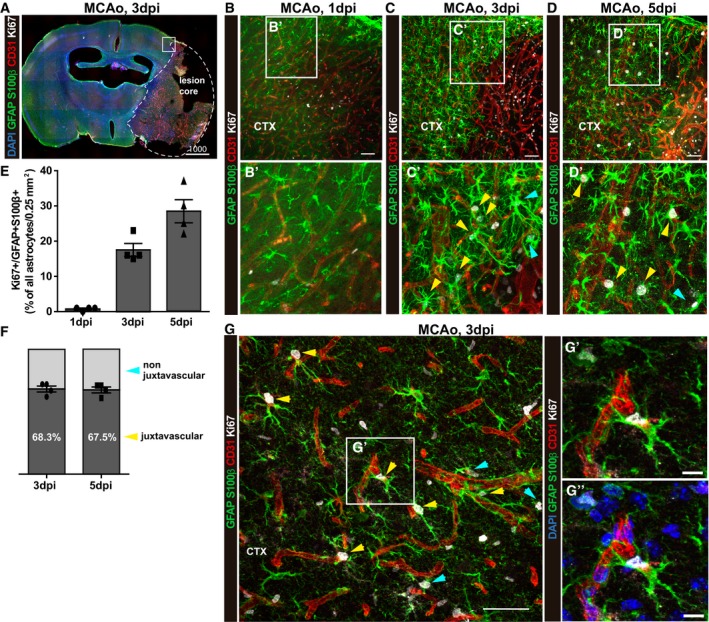
Stitched tiles epifluorescence micrographs of a representative brain slice at 3 dpi post‐MCAo. The lesion core is demarcated with a dashed line. A square shows the region of interest for quantifications.
- B–D
Confocal images from immunostaining for GFAP and S100β, Ki67, and blood vessels (CD31) from the penumbra of the ischemic lesion at 1, 3, and 5 dpi. Arrows point to proliferating astrocytes at juxtavascular positions (yellow) and not juxtavascular positions (cyan). The cell nuclei were counterstained with DAPI.
- E, F
Histograms depict the proportion of proliferating astrocytes among all (GFAP+S100β+) astrocytes in the lesioned GM (E) and the proportion of astrocytes proliferating at juxtavascular positions at 3 and 5 dpi (F). All data (individual data points, i.e., animals, are indicated as dots, triangles or squares) are represented as mean ± SEM per independent experiments (n = 4). Significance of differences between means was analyzed using one‐way ANOVA followed by Tukey's multiple comparison test.
- G
High‐power confocal micrographs of proliferating juxtavascular astrocytes (yellow arrows) with higher magnification in (G′ and G′′) showing the maximum projection of 10 single optical planes of the Z‐stack from the image shown in (G). Arrows point to proliferating astrocytes at juxtavascular positions (yellow) and not juxtavascular positions (cyan).
- A
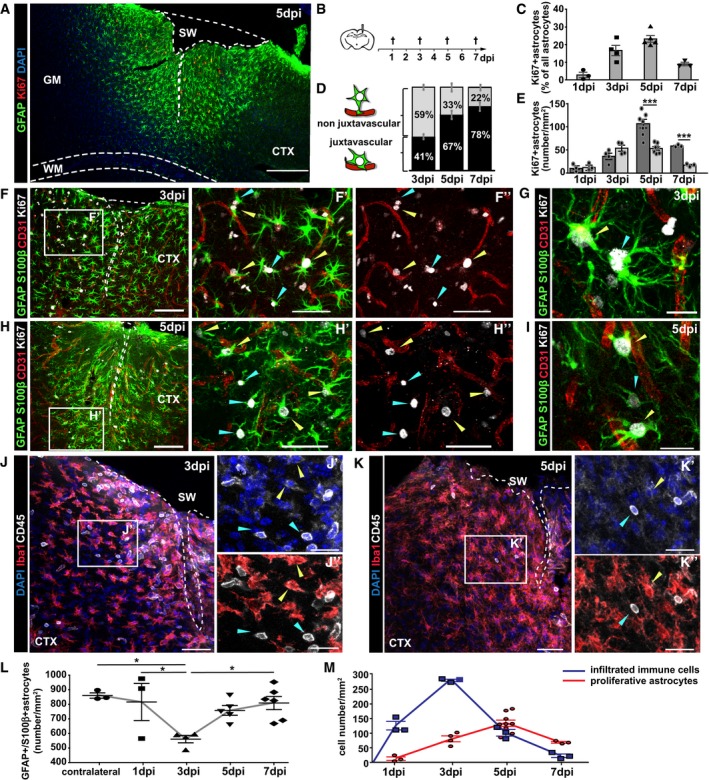
Representative photomicrograph of frontal brain section immunostained with GFAP (astrocytes), Ki67 (proliferating cells) displaying the reactive border in the injured cerebral cortex (CTX) grey matter (GM) at 5 dpi. Note that the site of stab wound injury (SW) demarcated with white dashed line is restricted to the GM and does not involve the white matter (WM, demarcated by cyan dashed line).
- B
Schematic outline of the experiment.
- C
The histogram depicts changes in the percentage of proliferating astrocytes among all astrocytes (GFAP+S100β+) per 0.25 mm2 of lesioned cortex.
- D, E
Proportion of juxtavascular proliferating astrocytes (D) and their numbers (black bars) relative to the non‐juxtavascular proliferating astrocytes (gray bars) (E) at different time points after injury.
- F–I
Examples of immunostaining with GFAP, S100β, Ki67, and CD31 at 3 dpi (F, G) and 5 dpi (H, I). Reactive proliferating astrocytes at juxtavascular (yellow arrowheads) and non‐juxtavascular positions (cyan arrowheads).
- J–L
Immunolabeling of microglia (Iba1+CD45+, yellow arrowheads) and leukocytes (Iba1−CD45+, cyan arrowheads) in the penumbra at 3 dpi (J) and 5 dpi (K). The dashed lines indicate the site of injury. The cell nuclei were counterstained with DAPI. Changes in the total numbers of GFAP+S100β+ astrocytes at the injury site during the first week after lesion are summarized in (L).
- M
The numbers of immune cells (CD45+Iba1−) peak at 3 dpi and decrease when the astrocyte proliferation reaches its peak at 5 dpi.
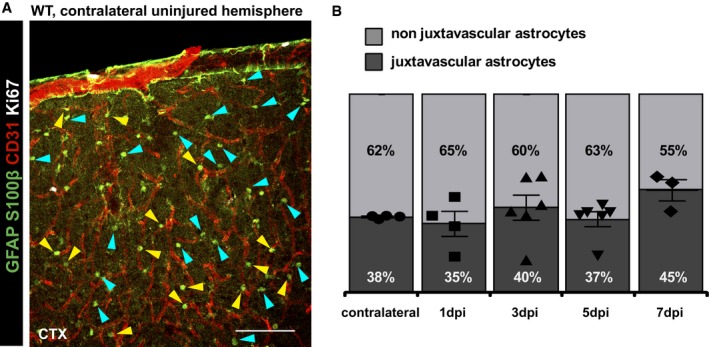
Confocal images of S100β and GFAP immunostaining labeling all astrocytes in the GM of the uninjured contralateral hemisphere co‐stained for CD31 (vasculature) and Ki67 (proliferating cells). Arrowheads point to juxtavascular (yellow) and non juxtavascular (cyan) astrocytes in the uninjured GM parenchyma. Note that virtually no astrocytes proliferate in the uninjured site. Scale bar: 100 μm.
Percentages of juxtavascular astrocytes among all GFAP/S100β immunolabeled astrocytes at different time points. All data (individual data points, i.e., animals, are indicated as separate symbols) are represented as mean ± SEM per independent experiments (n = 4 for the contralateral side and 1 dpi, n = 5 for 3 and 5 dpi, and n = 3 for 7 dpi). Significance of differences between means was analyzed using Kruskal–Wallis test, P = 0.0935.
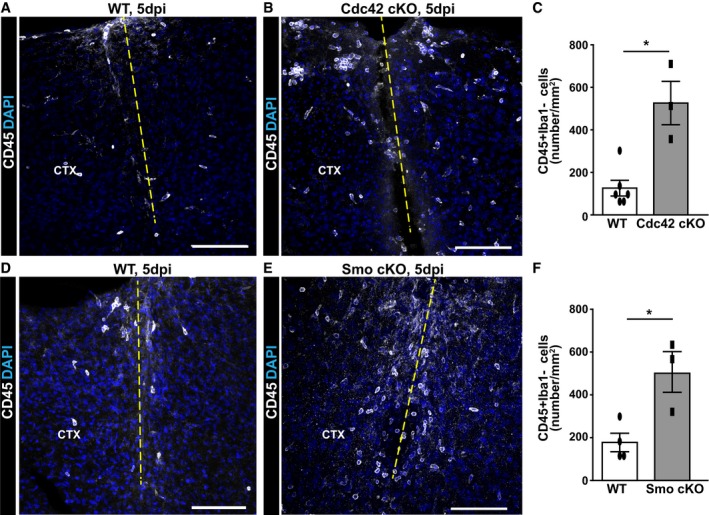
- A–F
Micrographs depict representative examples of immunostaining with CD45 in the injured GM of WT mice (A, D), conditional astrocyte‐specific Cdc42 knockout mice (B) and conditional astrocyte‐specific Smo knockout mice (E) at 5 dpi. The dashed lines indicate the site of injury. The cell nuclei were counterstained with DAPI. Quantitative analysis of these experiments is shown in (C) and (F). All data (dots and squares depict individual data points, i.e. animals) are represented as mean ± SEM from independent experiments, that is, tamoxifen‐treated animals. Significance of differences between means was analyzed using Mann–Whitney test and is indicated based on the P‐value (*P = 0.0275, n = 6 for WT and n = 3 for Cdc42 cKO in C; *P = 0.0498, n = 4 for WT and n = 3 for Smo cKO in F). Scale bars: 100 μm (A, B, D, E).
- A, B
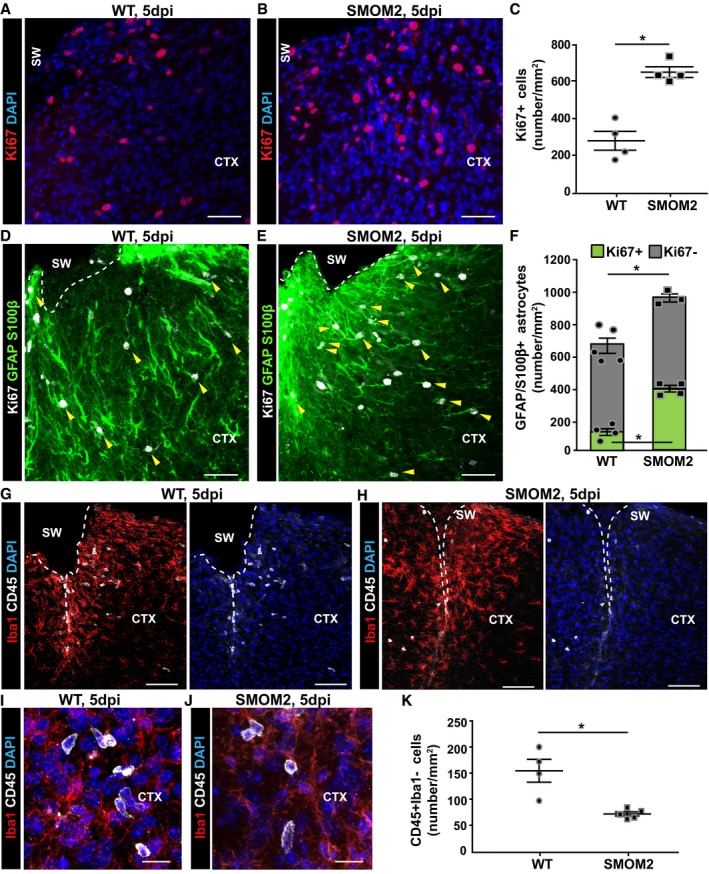
Distribution of Ki67+ cells in the injured GM from WT (A) and conditional SMOM2 mice (B) at 5 dpi.
- C
Quantification of Ki67+ cells in the GM parenchyma at this time point after injury (*P = 0.029, n = 4).
- D–F
Representative micrographs of cortical sections obtained from WT (D) or SMOM2 (E) mice and immunostained for GFAP, S100β, and Ki67 at 5 dpi. Arrowheads point to proliferating reactive astrocytes (GFAP/ S100β+Ki67+). The numbers of proliferating (green bars, *P = 0.029, n = 4) and non‐proliferating astrocytes (gray bars) per area of the injured cortical GM are shown in (F). Note that the total numbers of astrocytes within the penumbra are significantly increased in the injury site in SMOM2 mice (*P = 0.036, n = 5 for WT and n = 3 for SMOM2).
- G–J
Micrographs depict examples of double‐immunostaining for Iba1 and CD45 in the cortical GM of WT (G, I) and SMOM2 (H, J) mice at 5 dpi.
- K
Quantitative analysis showing the numbers of CD45+ Iba1− cells within the injured GM from WT and SMOM2 mice at 5 dpi (*P = 0.016, n = 4 for WT and n = 5 for SMOM2).
- A
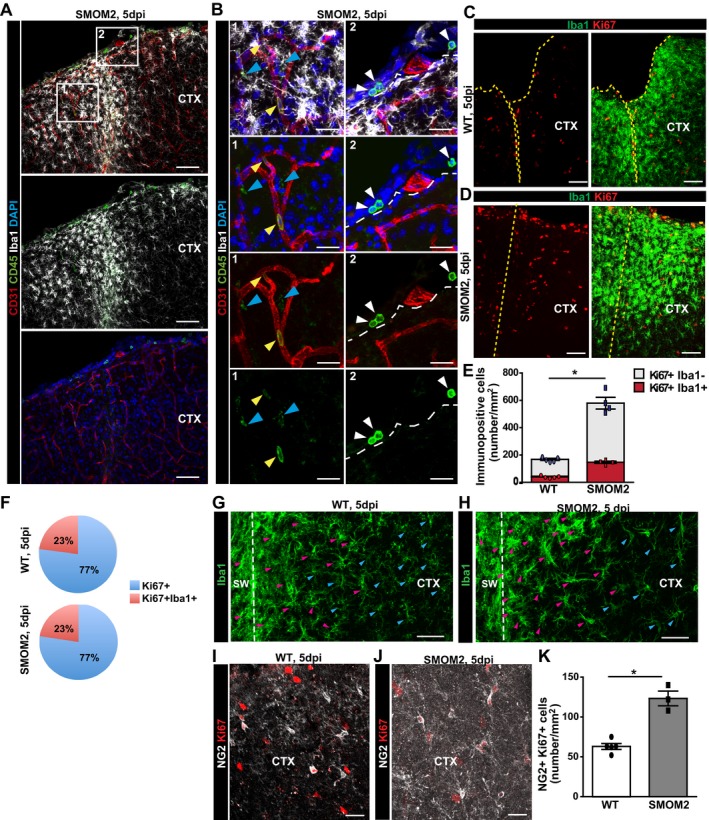
Micrographs depict representative examples of immunostaining with Iba1, CD45, and CD31 in the injured GM of GLASTCreERT2/SmoM2‐YFP mice at 5 dpi.
- B
Higher magnification of the boxed areas (1 and 2 in A) showing CD45+Iba1+ cells (cyan arrowheads) at the injury site and CD45+Iba1− cells accumulating in the vessels within the penumbra (yellow arrowheads in B1) or in the epimeningeal spaces (white arrowheads in B2). The dashed lines indicate the border between the epimeningeal space and cortical parenchyma. The cell nuclei were counterstained with DAPI.
- C, D
Representative confocal micrographs of Iba1 and Ki67 immunostaining in the lesioned cortex of WT controls (C) and GLASTCreERT2/SmoM2‐YFP mice (D). The dashed lines indicate the site of injury.
- E
The histogram displays total numbers of proliferating Ki67+ and Ki67+Iba1+ microglia in both mouse lines at 5 dpi. Significance was tested with Mann–Whitney test (*P = 0.016, n = 5 for WT and n = 4 for SMOM2).
- F
Pie chart depicts the proportion of proliferating microglia among all proliferating cells at 5 dpi.
- G, H
Confocal pictures show more pronounced microgliosis toward the center of the lesion (dashed line) in a similar manner in both mice lines. Hypertrophic microglial cell bodies with thick processes are indicated by magenta arrowheads, and cyan arrowheads point to less reactive and more ramified microglial cells.
- I, J
Representative confocal images of NG2 and Ki67 immunostaining in the lesioned cortex GM of both lines.
- K
The histogram depicts the number of proliferating NG2+ cells with a significant increase in GLASTCreERT2/SmoM2‐YFP mice (Mann–Whitney test, *P = 0.035, n = 5 for WT and n = 3 for SMOM2).
- A, B
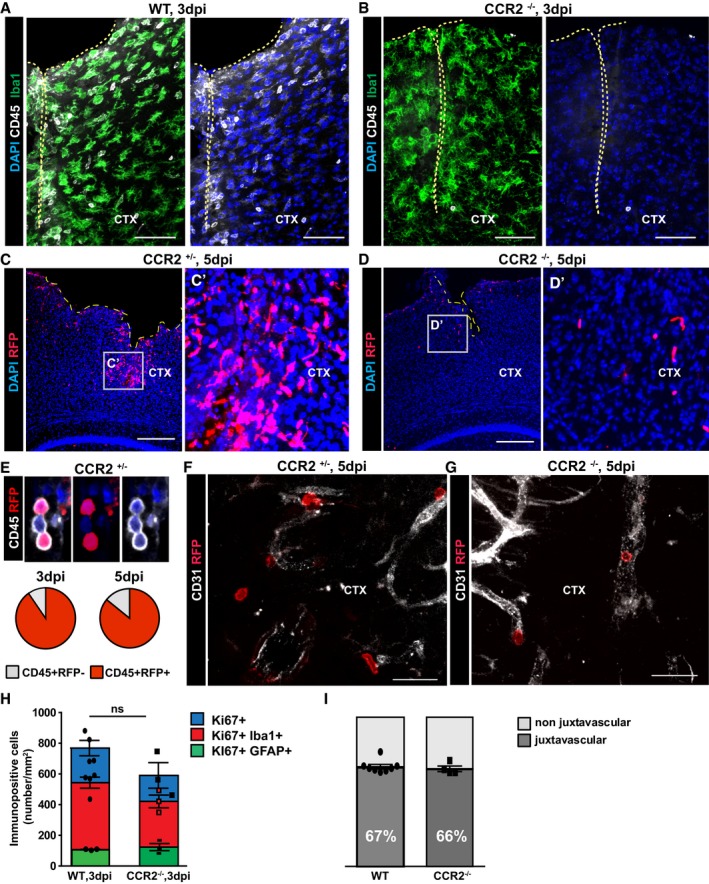
Confocal images of Iba1 and CD45 double‐immunostaining in WT (A) and CCR2−/− (B) mice at 3 dpi. The cell nuclei were counterstained with DAPI.
- C, D
Overview of the lesioned cortex in heterozygous CCR2RFP/+ (C) and homozygous CCR2RFP/RFP (D) mice.
- E
Confocal images of immune cell infiltrates at 5 dpi show co‐localization of RFP expression and CD45. Pie graphs display the proportion of CD45 cells that were also RFP+ at 3 and 5 dpi.
- F, G
RFP expressing cells were detected in the parenchyma in heterozygous (F), but not in homozygous CCR2RFP/RFP mice where they remained inside blood vessels (G).
- H, I
Histograms depicting the number of proliferating glial cells at 3 dpi (H) (ns, P = 0.2286 for all Ki67+ cells, n = 4 for WT and n = 3 for CCR2−/−; P = 0.1143 for Iba1+Ki67+, n = 4 WT, n = 3 CCR2−/−; P = 0.600 for GFAP+Ki67+, n = 3) and the proportion of juxtavascular proliferating astrocytes among all proliferating astrocytes at the injury site of WT and CCR2−/− mice at 5 dpi (I). All data (individual data points, i.e., animals, are indicated as dots or squares) are represented as mean ± SEM per independent experiments (n ≥ 3). Significance of differences between means was analyzed using Mann–Whitney test.
- A–J
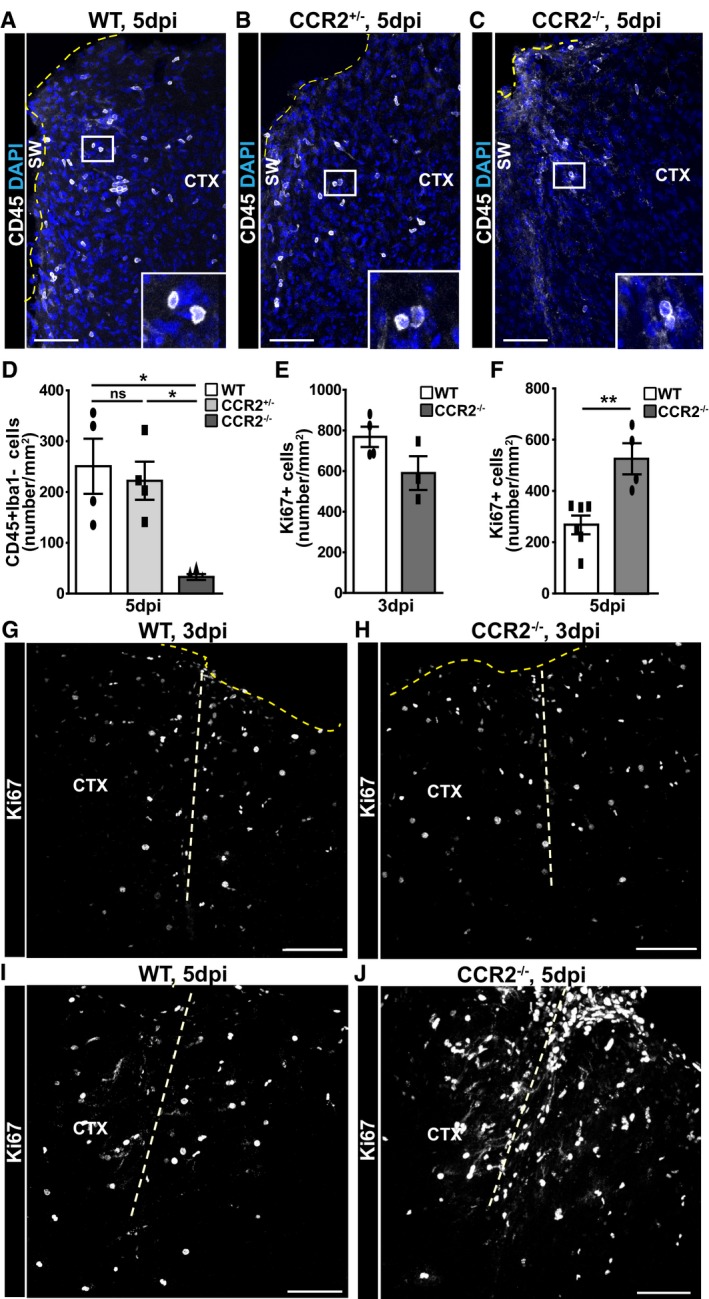
Confocal images of CD45+ cells around the lesion site of WT (A), heterozygous CCR2+/− (B), and homozygous CCR2−/− (C) mice at 5 dpi and Ki67+ cells at 3 dpi (G, H) and 5 dpi (I, J) in WT (G, I) and homozygous CCR2−/− (H, J) mice. The dashed thick lines indicate the site of injury, the thin dark yellow dashed lines represent the pial surface. The cell nuclei were counterstained with DAPI. (D–F) Histograms depicting the numbers of CD45+ Iba1− cells (D) and Ki67+ cells in the injured cortical GM from mice of the indicated genotypes at 3 dpi (E) and 5 dpi (F) (one‐way ANOVA, Tukey's multiple comparison test, *P < 0.05, **P < 0.01, D: *P = 0.059, n = 4; E: P = 0.229, n = 4 for WT and n = 3 for CCR2−/−; and F: **P = 0.0087, n = 6 for WT and n = 4 for CCR2−/−), respectively. All data (dots and squares depict individual data points, i.e., animals) are represented as mean ± SEM. Significance of differences between means is indicated based on the P‐value (*P < 0.05, **P < 0.01). Scale bars: 100 μm.
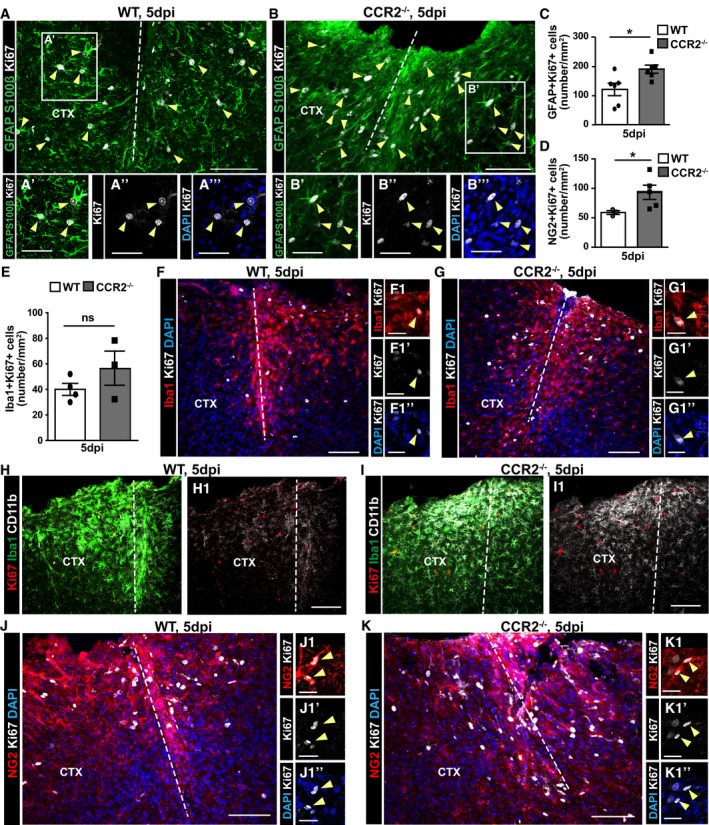
- A–K
Micrographs depicting immunostaining as indicated on the left side of the panels to identify proliferating Ki67+ glial cells in the injured GM of WT and CCR2−/− mice at 5 dpi (A, B, F–K). Examples of proliferating astrocytes (A, B: GFAP+S100β+Ki67+), microglia (F, G: Iba1+Ki67+), and NG2 glia (J, K: NG2+Ki67+) are indicated by yellow arrowheads and higher magnifications in the insets shown in (A′–A‴, B′–B‴, F1–F1″, G1–G1″, J1–J1″, K1–K1″). Panels (F1, G1, J1, and K1) do not show the same section as (F, G, J, and K), respectively, but were derived from the same experiment (same animal and same staining). The dashed lines indicate the site of injury. The cell nuclei were counterstained with DAPI. (C–E) Histograms depicting the number of proliferating astrocytes (C), NG2 glia (D), and microglia (E) in the penumbra at 5 dpi [Mann–Whitney test, C: *P = 0.016, n = 6; D: *P = 0.036, WT (n = 3) and CCR2−/− (n = 6); E: P = 0.400, WT (n = 4) and CCR2−/− (n = 3)]. All data (data points, i.e., individual animals, are depicted by dots and squares) are represented as mean ± SEM. Significance of differences between means is indicated based on the P‐value (*P < 0.05, **P < 0.01). Note the increase in CD11b+ microglia around the injury site in CCR2−/− mice (H, I). Scale bars: 100 μm (A, B, F–K), 25 μm (A′, B′, F1, G1, J1, K1).
- A, B
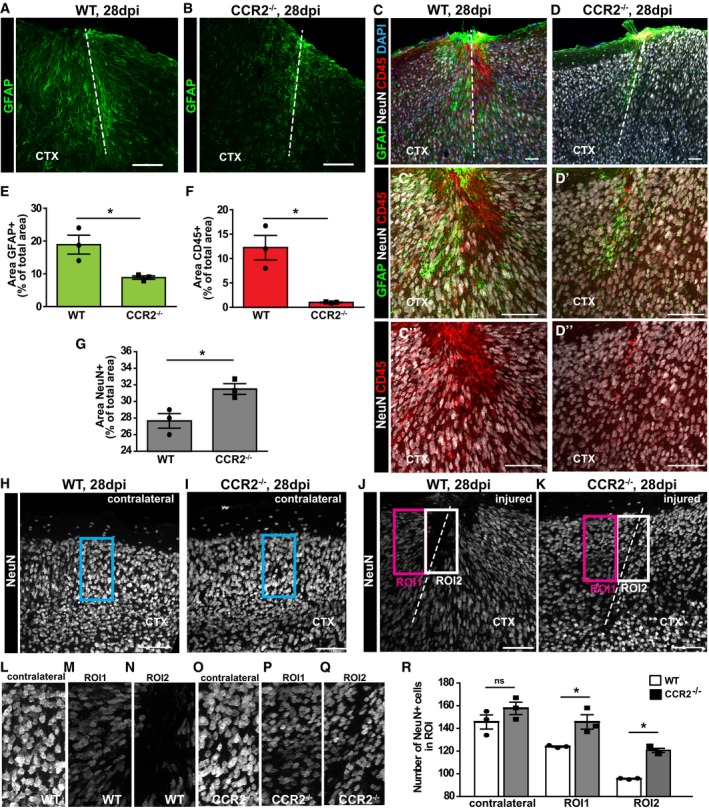
Representative images depict the GFAP immunoreactive area at 28 dpi in WT (A) and CCR2−/− mice (B).
- C, D
Triple immunolabeling with NeuN, CD45, and GFAP in WT (C) and CCR2−/− mice (D) with higher magnifications to depict the NeuN‐free areas in the injured GM at 28 dpi (C′, D′) that are colonized by CD45+ macrophages (C′–D″).
- E–G
Histograms in (E–G) depict percentages of the area covered by immunoreactivity to GFAP (Unpaired t‐test, *P = 0.027, n = 3) (E), NeuN (Unpaired t‐test, *P = 0.038, n = 3) CD45 (Unpaired t‐test, *P = 0.011, n = 3) (F) and CD45 (Unpaired t‐test, *P = 0.011, n = 3) NeuN (Unpaired t‐test, *P = 0.038, n = 3) (G) normalized to the acquired area for each slice.
- H–K
Representative images of NeuN staining of the uninjured contralateral hemisphere (H, I) and ipsilateral lesion site (J, K), displaying the regions of interest (ROIs) selected for quantification of the number of NeuN+ cells.
- L–Q
Higher magnifications of the ROIs.
- R
Histogram depicting the number of NeuN+ cells in ROI of the uninjured contralateral hemisphere, as well as ROI1 and ROI2 at the injury site. Statistical significance was examined with one‐way ANOVA (P < 0.0001) with Tukey's post hoc test, *P < 0.05, ns P > 0.05, n = 3.

- A–F
The injured GM parenchyma (ipsilateral) at 28 dpi is characterized by upregulation of CSPG, as detected by immunoreactivity for CS‐56 (A′–D′) and GFAP (A–D), when compared with the uninjured GM parenchyma (contralateral). Of note, WT mice (A–B′) display increased levels of CS‐56 immunostaining compared to CCR2−/− mice (C–D′). Collagen IV staining of cortical sections reveals an increased deposition predominantly in the basement membrane surrounding the vasculature in regions of GFAP upregulation (E–E″) that was much reduced in CCR2−/− mice (F–F″) at 28 dpi. The site of injury is indicated by a dashed line. The cell nuclei were counterstained with DAPI. Scale bars: 100 μm.
- A–C
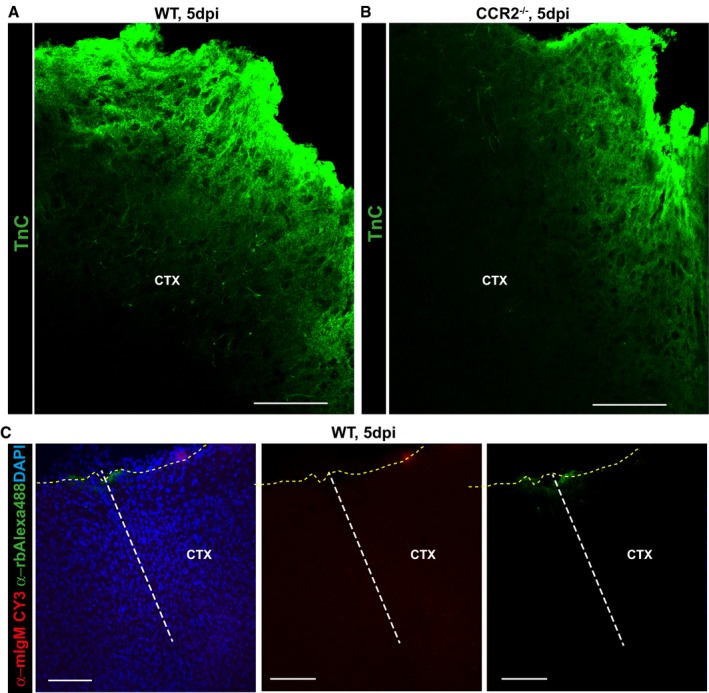
Confocal images displaying tenascin‐C (Tn‐C) immunostaining in the injured GM from WT (A) and CCR2−/− (B) mice at 5 dpi. Confocal images of control staining with only the secondary antibodies as indicated in the panel used for immunolabeling of ECM components showing absence of non‐specific binding of these antibodies at injury site (C). The dashed lines indicate the site of injury (white) and the pial surface (yellow). The cell nuclei were counterstained with DAPI. Scale bars: 75 μm (A, B), 150 μm (C).
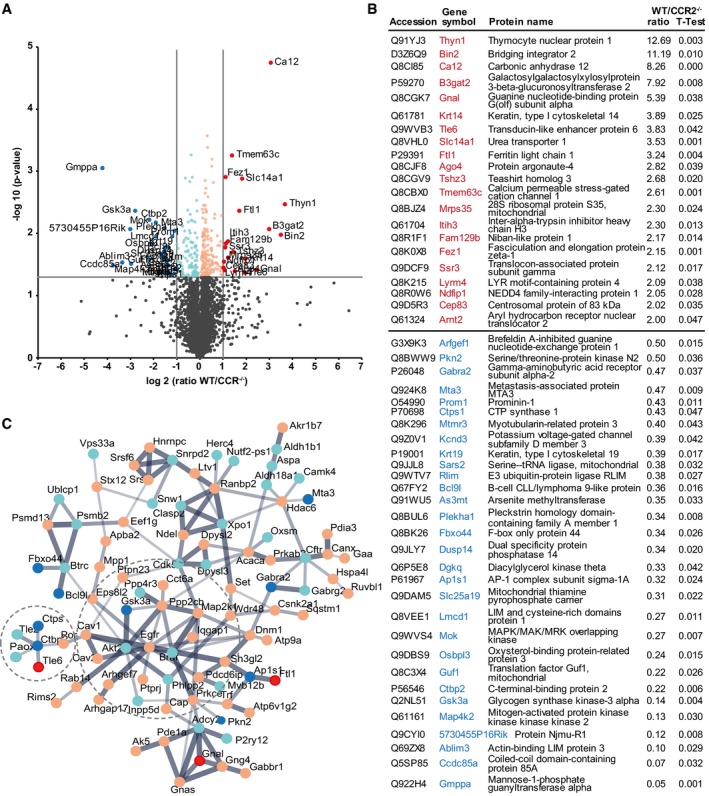
Volcano plot showing data from proteomics of the injured GM parenchyma from WT and CCR2−/− mice at 5 dpi. Proteins that were found significantly more abundant in WT mice (−log10 of P‐value, y‐axis) and showed a fold change of more than twofold are displayed as red dots, with light red dots indicating significant proteins with fold changes below twofold. Accordingly, proteins that were found significantly more abundant in CCR2−/− mice (−log10 of P‐value, y‐axis) and showed a fold change of more than twofold are displayed as blue dots, with light blue dots indicating significant proteins with fold changes below twofold. Non‐significantly altered proteins below the horizontal gray line at P = 0.05 are indicated in gray.
List of proteins with significant (P ≤ 0.05) and twofold different levels of abundance at the injury site of the different genotypes.
String protein network of the significantly different proteins of the lesion site at 5 dpi in WT and CCR2−/− mice. Proteins are displayed as dots with coloring as described in (A) and are connected based on confidence, with line thickness indicating strength of data support. Two prominent subnetworks are indicated by circles.
- A–D
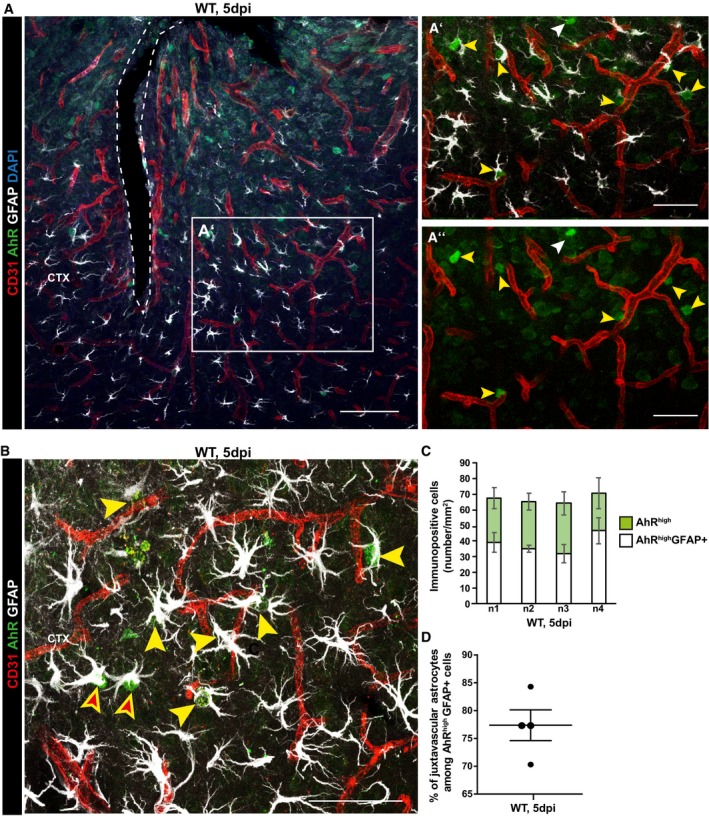
Confocal micrographs depicting AhR immunostaining together with GFAP for reactive astrocytes and CD31 for blood vessels (A, B) showing many examples of juxtavascular proliferating astrocytes containing nuclear AhR indicated by yellow arrowheads (A′, A″, B) surrounding the stab wound injury site at 5 dpi. White arrowheads point GFAP negative cell containing nuclear AhR in A′‐A′′, and non juxtavascular reactive AhR+ astrocytes are indicated by red filled arrowheads in (B). Histogram depicts the number of AhR+ astrocytes separately for each animal (n1–4) (C) and their proportion (individual data points, i.e. animals, are indicated as dots) located at juxtavascular positions (D). All data are represented as mean ± SEM per independent experiments (n = 4). The injury site is indicated by a dashed line, and nuclei were stained with DAPI. Scale bars: (A): 100 μm; (A′, A″): 50 μm, (B): 25 μm.
References
-
- Tanaka EM, Ferretti P (2009) Considering the evolution of regeneration in the central nervous system. Nat Rev Neurosci 10: 713–723 - PubMed
-
- Barbosa JS, Sanchez‐Gonzalez R, Di Giaimo R, Baumgart EV, Theis FJ, Götz M, Ninkovic J (2015) Neurodevelopment. Live imaging of adult neural stem cell behavior in the intact and injured zebrafish brain. Science 348: 789–793 - PubMed
-
- Kroehne V, Freudenreich D, Hans S, Kaslin J, Brand M (2011) Regeneration of the adult zebrafish brain from neurogenic radial glia‐type progenitors. Development 138: 4831–4841 - PubMed
-
- Carlen M, Meletis K, Goritz C, Darsalia V, Evergren E, Tanigaki K, Amendola M, Barnabe‐Heider F, Yeung MS, Naldini L et al (2009) Forebrain ependymal cells are Notch‐dependent and generate neuroblasts and astrocytes after stroke. Nat Neurosci 12: 259–267 - PubMed
Publication types
MeSH terms
Substances
LinkOut - more resources
Full Text Sources
Other Literature Sources
Medical
Molecular Biology Databases
Miscellaneous
