. 2018 Apr 9;9(1):1344.
doi: 10.1038/s41467-018-03753-4.

Endocycle-related tubular cell hypertrophy and progenitor proliferation recover renal function after acute kidney injury

Affiliations

Endocycle-related tubular cell hypertrophy and progenitor proliferation recover renal function after acute kidney injury

Elena Lazzeri et al. Nat Commun. .

Abstract

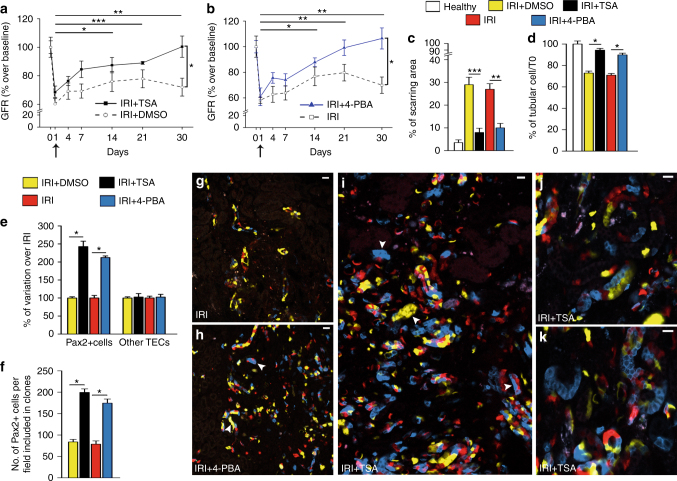
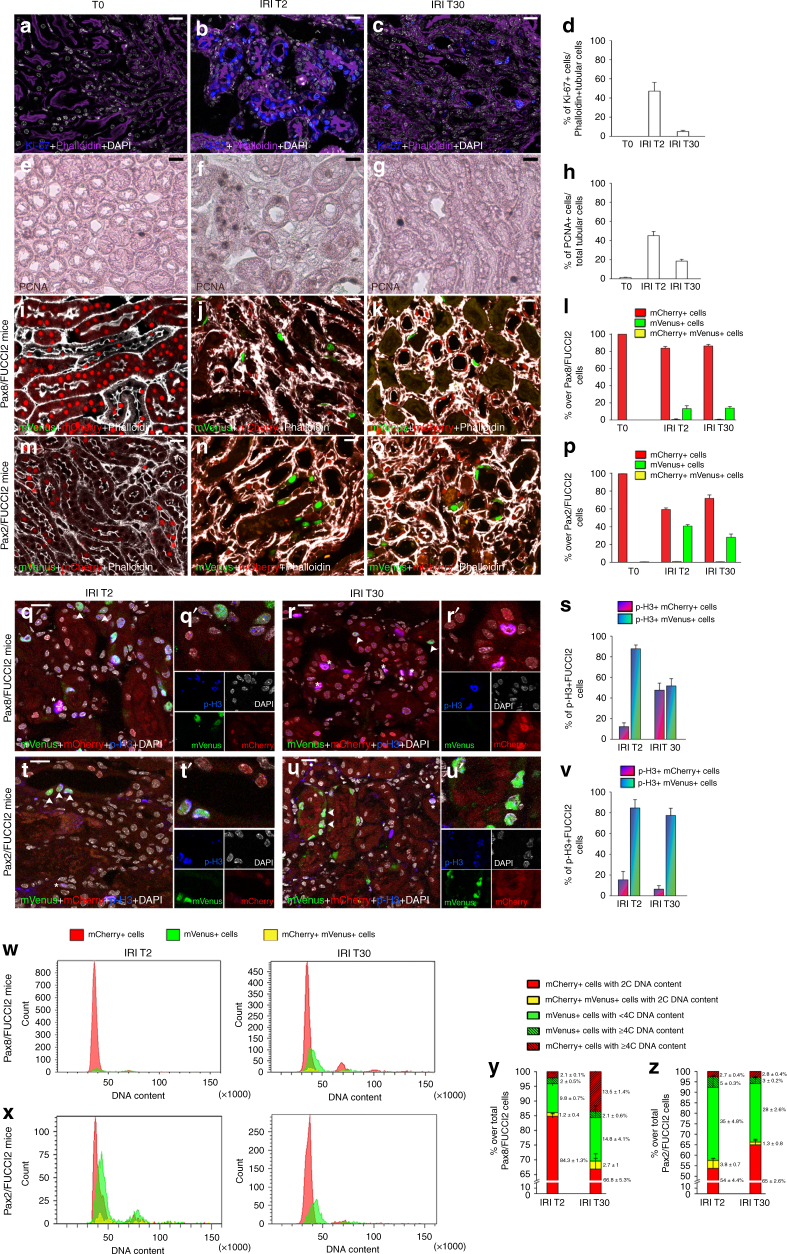
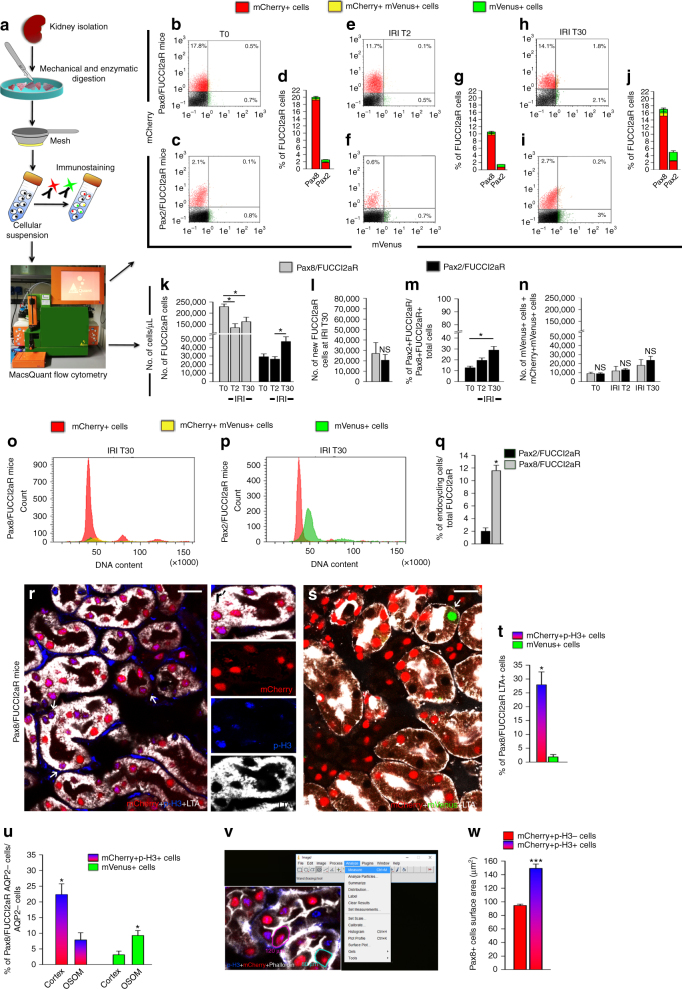
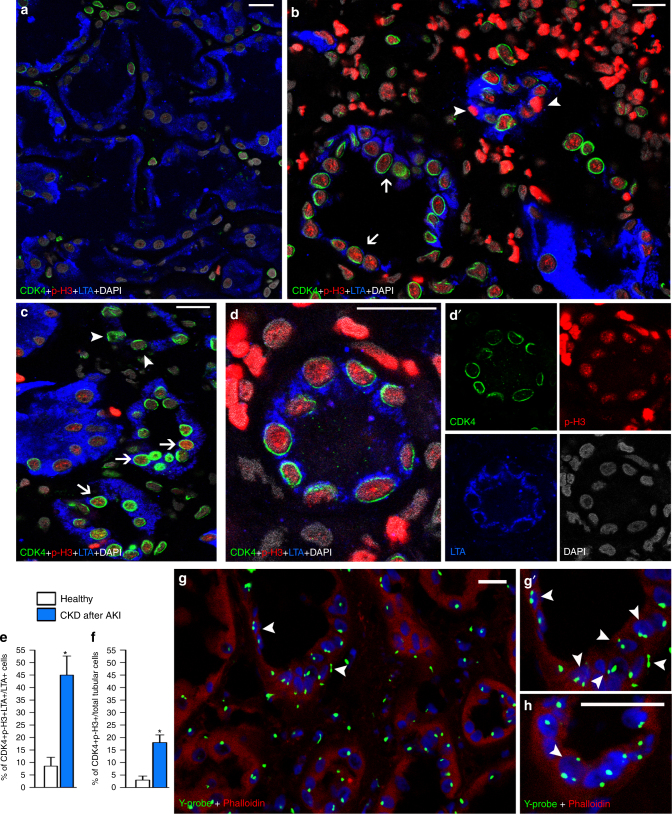
Acute kidney injury (AKI) is considered largely reversible based on the capacity of surviving tubular cells to dedifferentiate and replace lost cells via cell division. Here we show by tracking individual tubular cells in conditional Pax8/Confetti mice that kidney function is recovered after AKI despite substantial tubular cell loss. Cell cycle and ploidy analysis upon AKI in conditional Pax8/FUCCI2aR mice and human biopsies identify endocycle-mediated hypertrophy of tubular cells. By contrast, a small subset of Pax2+ tubular progenitors enriches via higher stress resistance and clonal expansion and regenerates necrotic tubule segments, a process that can be enhanced by suitable drugs. Thus, renal functional recovery upon AKI involves remnant tubular cell hypertrophy via endocycle and limited progenitor-driven regeneration that can be pharmacologically enhanced.


Conflict of interest statement

The authors declare no competing interests.

Figures

Fig. 1
Fig. 1
Only a small TEC subset proliferates after AKI and partially replaces lost TECs. a GFR in ischemic mice (n = 13) normalized on the GFR at baseline and on sham-operated control group (n = 5). One-way ANOVA post hoc Tukey. b, c Juxtaposed images of a Pax8/Confetti mouse kidney at day 0 (T0, n = 5) (b) and 30 after IRI (IRI T30, n = 4) (c). Arrows indicate single-colored clones. OSOM outer stripe of outer medulla; ISOM inner stripe of outer medulla. d Number of Pax8+, Pax8+AQP2−, and Pax8+AQP1+ cells in Pax8/Confetti mice at day 0 (T0, white column, n = 5) and at day 30 after IRI (IRI T30, gray column, n = 4). Mann–Whitney test. *p < 0.05, **p < 0.01 IRI T30 vs. T0. e BUN in healthy Pax8/Confetti mice (n = 5) and in Pax8/Confetti mice after nephrotoxic AKI (n = 6). One-way ANOVA post hoc Tukey *p < 0.05 glycerol-treated mice vs. healthy. f GFR in Pax8/Confetti mice after nephrotoxic AKI (n = 7) normalized on the GFR at baseline and on healthy mice (n = 5). One-way ANOVA post hoc Tukey. g Number of Pax8+ cells in Pax8/Confetti mice at day 0 (T0, white column, n = 5) and day 30 after nephrotoxic AKI (Gly T30, gray with sparse pattern column, n = 4). Mann–Whitney test *p < 0.05 Gly T30 vs. T0. h Number of Pax8+AQP2− cells in Pax8/Confetti mice at day 0 (T0, white column, n = 5) and day 30 after nephrotoxic AKI (Gly T30, gray with sparse pattern column, n = 4). Mann–Whitney test *p < 0.05 Gly T30 vs. T0. i Single-colored clones in AQP2− tubules in Pax8/Confetti mice at day 30 after IRI (n = 4). AQP2 staining is white. j Clone frequency analysis of Pax8+AQP2− cells in Pax8/Confetti mice at day 0 (T0, n = 5), in age-matched controls (T30, n = 4), in sham-operated mice (n = 4), at day 30 after IRI (IRI T30, n = 4) and at day 30 after nephrotoxic AKI (Gly T30, n = 4). Mann–Whitney test *p < 0.05 IRI T30 vs. T0, T30, sham and Gly T30 vs. T0 and T30. k Percentage of Pax8+AQP2− cells in Pax8/Confetti mice at day 0 (T0, n = 5), at day 30 after IRI (IRI T30, n = 4) and at day 30 after nephrotoxic AKI (Gly T30, n = 4). Mann–Whitney test *p < 0.05 IRI T30 and Gly T30 vs. T0. l Percentage of Pax8+AQP2− clonogenic cells (gray column) in Pax8/Confetti mice at day 30 after IRI (IRI T30, n = 4) and at day 30 after nephrotoxic AKI (Gly T30, n = 4) vs. day 0 (n = n = 5). The white column is the percentage of Pax8+AQP2− that did not generate clones. Data are mean ± SEM. Scale bars 40 µm. Pax8+ = Pax8 lineage-positive cells
Fig. 2
Fig. 2
Kidney tubules contain a distinct, predefined Pax2 lineage-positive tubular cell subset. ac Juxtaposed confocal images of a kidney section from cortex to inner stripe of outer medulla in adult Pax2/Confetti mice (n = 4). Confetti reporter shows Pax2 lineage-positive single cells scattered within the proximal tubules, distal tubules and collecting ducts as demonstrated by immunolabelling for AQP1 (a), THP (b) and AQP2 (c), respectively (white). OSOM outer stripe of outer medulla; ISOM inner stripe of outer medulla. Scale bars 40 µm. d Schematic localization of Pax2− lineage-positive cells (red dots) in the proximal tubule, stained by AQP1 (light gray), in the thick ascending limb and in the distal tubule, stained by THP (dark gray), of the nephron. eh Representative images of a kidney section in healthy Pax2/Confetti mice showing (n = 4) the distribution of Pax2 lineage-positive cells in S3 segment of proximal tubules (AQP1+, white) (e), in thick ascending limbs and distal tubules (THP+, white) (f), in collecting ducts (AQP2+, white) (g) and in S1–S2 segment of proximal tubules (Megalin+, white) (h). Scale bars 20 µm. i Experimental schemes. j, k Representative images of a kidney section in the OSOM of Pax2/Confetti mice showing Pax2+AQP2− cells after 30 days of washout (T30, n = 5) (j) and after 30 days with doxycycline (doxycycline T30, n = 4) (k). AQP2 staining is white. l Number of Pax2+AQP2− cells in OSOM of Pax2/Confetti mice at T30 (n = 5) and after 30 days with doxycycline (doxy T30, n = 4). Mann–Whitney test NS. Data are mean ± SEM. Scale bars 20 µm. Pax2+ = Pax2 lineage-positive cells
Fig. 3
Fig. 3
Pax2 lineage-positive cells show increased survival and proliferative capacity in comparison to other TECs after AKI. a GFR in Pax2/Confetti mice after ischemic AKI (n = 9) normalized on the GFR at baseline and on sham-operated control group (n = 5). One-way ANOVA post hoc Tukey. b Juxtaposed confocal images of a kidney section in Pax2/Confetti mice at day 30 after IRI (n = 5). Arrows indicate single colored clones. Scale bars 40 µm. c, d Single colored clones in AQP2− tubules in Pax2/Confetti mice at day 30 after IRI (n = 5). AQP2 staining is white. Scale bars 20 µm. e Number of Pax2+AQP2− TECs in Pax2/Confetti mice at day 0 (T0, n = 4), in age-matched controls (T30; n = 5), in sham-operated mice (sham; n = 5) and at day 30 after IRI (IRI T30, n = 5). Mann–Whitney test *p < 0.05 IRI T30 vs. T0, T30 and sham. f Clone frequency analysis of Pax2+AQP2− cells in Pax2/Confetti mice at day 0 (T0, n = 4), in age-matched controls (T30, n = 5), in sham-operated mice (sham; n = 5) and at day 30 after IRI (IRI T30, n = 5). Mann–Whitney test *p < 0.05 IRI T30 vs. T0, T30, and sham. g Percentage of Pax2+AQP2− cells in Pax2/Confetti mice at day 0 (T0, n = 4) and 30 after IRI (IRI T30, n = 5). h Percentage of Pax2+AQP2− TECs vs. AQP2− TECs in Pax2/Confetti mice at day 0 (T0, n = 4), in age-matched controls (T30, n = 5), and at day 30 after IRI (IRI T30, n = 5). Mann–Whitney test *p < 0.05 IRI T30 vs. T0 and T30. i Percentage of lost Pax2+AQP2− TECs (n = 5) and Pax8+AQP2− TECs (n = 5) at IRI T30 vs. T0. Mann–Whitney test *p < 0.05. j Percentage of Pax2+AQP2− (n = 5) and Pax8+AQP2− TECs (n = 5) that generated clones at IRI T30 vs. T0. Mann–Whitney test *p < 0.05. k Percentage of Pax2+AQP2− (n = 5) and Pax8+AQP2− TECs (n = 5) at IRI T30 vs. T0. l GFR in Pax2/Confetti mice after nephrotoxic AKI (n = 8) normalized on the GFR at baseline and on healthy mice (n = 5). One-way ANOVA post-hoc Tukey. m Percentage of lost Pax2+AQP2− TECs (n = 6) in Pax2/Confetti and of lost Pax8+AQP2− (n = 4) in Pax8/Confetti mice at day 30 after nephrotoxic AKI vs. T0. Mann–Whitney test *p < 0.05. n Percentage of Pax2+AQP2− (n = 6) and Pax8+AQP2− TECs (n = 4) that generated clones at day 30 after nephrotoxic AKI vs. T0. Mann–Whitney test *p < 0.05. o Percentage of Pax2+AQP2− (n = 6) and Pax8+AQP2− TECs (n = 4) at day 30 after nephrotoxic AKI vs. T0. Data are mean ± SEM. Pax2+ = Pax2 lineage-positive cells, Pax8+ = Pax8 lineage-positive cells. For calculation of figures ik, mo see Methods section and representative calculations in Pax2/Confetti mice in Supplementary Methods
Fig. 4
Fig. 4
Pax2 lineage-positive cells regenerate long tubule segments. a Representative image of a kidney section showing single-colored clones in S1–S2 segments of proximal tubule as demonstrated by staining with anti-megalin antibody (white) in Pax2/Confetti mice at day 30 after IRI (n = 5). Scale bar 20 µm. b, c Representative images of a kidney section showing single-colored clones in S3 segment of proximal tubule as demonstrated by staining with anti-AQP1 antibody (white) in OSOM of Pax2/Confetti mice at day 30 after IRI (n = 5). Scale bars 20 µm. d Representative image of a kidney section showing single-colored clones in thick ascending limb as demonstrated by staining with anti-THP antibody (white) in Pax2/Confetti mice at day 30 after IRI (n = 5). Scale bar 20 µm. e Frequency of Pax2+ clones in S1–S2 segment of proximal tubules (Pax2+ Megalin+ clones, n = 5), in S3 segment of proximal tubules (Pax2+AQP1+ clones, n = 7), in thick ascending limbs (TAL, Pax2+THP+ clones, n = 7) and in the collecting ducts (Pax2+AQP2+ clones, n = 7) at day 30 after IRI. Mann–Whitney test. **p < 0.01 S3 vs. S1–S2 and collecting ducts, *p < 0.05 S3 vs. TAL and TAL vs. collecting ducts. f Percentage of clonogenic cells per field in 2D vs. 3D analysis in Pax2/Confetti and in Pax8/Confetti mice at day 30 after IRI vs. T0. (n = 5 Pax2/Confetti mice and n = 5 Pax8/Confetti mice). Mann–Whitney test NS. gi 3D reconstruction of single-colored clones in Pax2/Confetti mice at day 30 after IRI (n = 5). DAPI counterstains nuclei (white). Scale bars 50 µm. Data are mean ± SEM. Pax2+ = Pax2 lineage-positive cells, Pax8+ = Pax8 lineage-positive cells
Fig. 5
Fig. 5
Drugs that promote tubular regeneration after AKI selectively enhance Pax2 lineage-positive cell mitosis. a, b GFR after IRI (n = 6), IRI + DMSO (n = 7), TSA (n = 7) or 4-PBA treatment (n = 6). One-way ANOVA post hoc Tukey. Arrows indicate starting of treatment. c Percentage of kidney area with tubular injury in kidney sections of Pax2/Confetti mice at day 0 (healthy, n = 4), at day 30 after IRI + DMSO (n = 4) or IRI (n = 6) and at day 30 after IRI + TSA (n = 4) or 4-PBA (n = 6) treatment (n = 4 images per mouse). Mann–Whitney test. ***p < 0.001 IRI + TSA vs. IRI + DMSO, **p < 0.01 IRI vs. IRI + 4-PBA. d Percentage of TECs in Pax2/Confetti mice in healthy (n = 4), at day 30 after IRI + DMSO (n = 4) or IRI (n = 5) and at day 30 after IRI + TSA or 4-PBA treatment (n = 4 per each group) vs. T0. Mann–Whitney test. *p < 0.05 IRI + TSA vs. IRI + DMSO and IRI vs. IRI + 4-PBA. e Percentage of variation of Pax2+ and Pax2− TECs in Pax2/Confetti mice at day 30 after IRI + TSA or 4-PBA treatment (n = 4 per each group) vs. IRI + DMSO (n = 4) or IRI (n = 5). Mann–Whitney test. *p < 0.05 IRI + TSA vs. IRI + DMSO and IRI vs. IRI + 4-PBA. f Number of cells included in clones in Pax2/Confetti mice at day 30 after IRI + DMSO (n = 4) or IRI (n = 5) and at day 30 after IRI + TSA or 4-PBA treatment (n = 4). Mann–Whitney test. *p < 0.05 IRI + TSA vs. IRI + DMSO and IRI vs. IRI + 4-PBA. gk Clones in Pax2/Confetti mice at day 30 after IRI (n = 4) (g), and after IRI+ 4-PBA treatment (n = 4) (h) or +TSA treatment (n = 4) (ik). Arrows indicate clones. Data are mean ± SEM. Scale bars 20 µm. Pax2+ = Pax2 lineage-positive cells
Fig. 6
Fig. 6
Cell cycle markers misrepresent proliferation after AKI because numerous TEC endocycle. ac Ki-67+ (blue) Phalloidin+ (purple) tubules at day 0 (a), 2 (b) and 30 after IRI (c) (n = 3 per group). d Percentage of Ki-67+ cells over Phalloidin+ TECs at T0, IRI T2, and IRI T30 (n = 3 per group). eg PCNA+ cells at T0 (e), IRI T2 (f), and IRI T30 (g) (n = 5 per group). h Percentage of PCNA+ cells over TECs at T0, IRI T2, and IRI T30 (n = 5 per group). ik mCherry+ cells (red) and mVenus+ cells (green) in Pax8/FUCCI2 mice at T0 (i), IRI T2 (j), and IRI T30 (k) (n = 4 per group). Phalloidin staining is white. l Percentage of mCherry+ cells, mVenus+ cells and mCherry+mVenus+ cells in Pax8/FUCCI2 mice at T0, IRI T2, and IRI T30. (n = 4 per group). mo mCherry+ cells (red) and mVenus+ cells (green) in Pax2/FUCCI2 mice at T0 (m), IRI T2 (n) and IRI T30 (o) (n = 4 per group). Phalloidin staining is white. p Percentage of mCherry+ cells, mVenus+ cells and mCherry+mVenus+ cells in Pax2/FUCCI2 mice at T0, IRI T2, and IRI T30. (n = 4 per group). q, r mCherry+ cells (red), mVenus+ cells (green) and p-H3+ cells (blue) in Pax8/FUCCI2 mice at IRI T2 (q) and IRI T30 (r) (n = 4 per group). q′, r′ Details indicated by arrowheads and asterisks in q and r. s Percentage of p-H3+mCherry+ cells and p-H3+mVenus+ cells in Pax8/FUCCI2 mice at IRI T2 and IRI T30. (n = 4 per group). t, u mCherry+ cells (red), mVenus+ cells (green) and p-H3+ cells (blue) in Pax2/FUCCI2 mice at IRI T2 (t) and IRI T30 (u) (n = 4 per group). t′, u′ Details indicated by arrowheads in t and u. v Percentage of p-H3+mCherry+ cells and p-H3+mVenus+ cells in Pax2/FUCCI2 mice at IRI T2 and IRI T30. (n = 4 per group). w, x Cell cycle distribution of mCherry+, mVenus+, and mCherry+mVenus+ cells in Pax8/FUCCI2 mice (w) and Pax2/FUCCI2 mice (x) at IRI T2 (n = 4, left) and at IRI T30 (n = 5, right). Representative experiments are shown. y, z Percentage of cells over total Pax8/FUCCI2 cells (y) and over total Pax2/FUCCI2 cells (z) at IRI T2 (n = 4) and IRI T30 (n = 5). Data are mean ± SEM. Scale bars 20 µm. DAPI (white) counterstains nuclei. T0 = day 0, IRI T2 = day 2 after IRI, IRI T30 = day 30 after IRI
Fig. 7
Fig. 7
Pax2 lineage-positive cells proliferate, while other TEC endocycle and are persistently lost after AKI. a Schematic procedure. bj FACS analysis shows mCherry+ and mVenus+ cells in total renal cells of Pax8/FUCCI2aR (b, d) and Pax2/FUCCI2aR mice (c, d) at T0, of Pax8/FUCCI2aR (e, g) and Pax2/FUCCI2aR mice (f, g) at IRI T2 and of Pax8/FUCCI2aR (h, j) and Pax2/FUCCI2aR mice (i, j) at IRI T30. A representative experiment out of 4 is shown. k Number of total FUCCI2aR cells in Pax8/FUCCI2aR and Pax2/FUCCI2aR mice at T0, IRI T2, IRI T30 (n = 4 in each group). Mann–Whitney test *p < 0.05. l Number of new FUCCI2aR cells in Pax8/FUCCI2aR and Pax2/FUCCI2aR mice at IRI T30 in comparison to IRI T2 (n = 4 in each group). Mann–Whitney test NS. m Percentage of Pax2/FUCCI2aR over Pax8/FUCCI2aR total cells at T0, IRI T2, IRI T30 (n = 4 in each group). Mann–Whitney test *p < 0.05. n Number of total mVenus+ cells mCherry+mVenus+ cells in Pax8/FUCCI2aR and Pax2/FUCCI2aR mice at T0, IRI T2, IRI T30 (n = 4 in each group). Mann–Whitney test NS. o, p Cell cycle distribution of mCherry+, mVenus+, and mCherry+mVenus+ cells in Pax8/FUCCI2aR (o) and Pax2/FUCCI2aR mice (p) at IRI T30. A representative experiment out of 4 is shown. q Percentage of endocycling cells in Pax2/FUCCI2aR (black column) and Pax8/FUCCI2aR mice (light gray column) at IRI T30 (n = 4 in each group). Mann–Whitney test *p < 0.05. r mCherry+ cells (red) and p-H3+ cells (blue) in LTA+ tubules in the cortex (white) of Pax8/FUCCI2aR mice at IRI T30 (n = 5). Arrows show mCherry+p-H3+ cells. r′ Detail of rs mCherry+ cells (red) and mVenus+ cells (green) in LTA+ tubules in the cortex (white) of Pax8/FUCCI2aR mice at IRI T30 (n = 5). Arrow shows mVenus+ cell. t Percentage of endocycling cells (mCherry+p-H3+ cells) and cycling cells (mVenus+ cells) in the cortex of Pax8/FUCCI2aR mice at IRI T30 (n = 5). Mann–Whitney test *p < 0.05. u Percentage of endocycling (mCherry+p-H3+ cells) and cycling (mVenus+ cells) AQP2− cells in the cortex and in OSOM of Pax8/FUCCI2aR mice at IRI T30 (n = 5). Mann–Whitney test *p < 0.05. v Measurement of the cell surface area of mCherry+p-H3+ cells and of mCherry+p-H3− cells after staining with Phalloidin (white) with Image J software in Pax8/FUCCI2aR mice at IRI T30 (n = 4). w Cell surface area of mCherry+p-H3+ cells and of mCherry+p-H3− cells in Pax8/FUCCI2aR mice at IRI T30. n = at least 20 cells for each mouse (n = 4), Mann–Whitney test ***p < 0.001. Data are mean ± SEM. Scale bars 20 µm. T0 = day 0, IRI T2 = day 2 after IRI, IRI T30 = day 30 after IRI
Fig. 8
Fig. 8
High percentage of endocycling TECs in the kidney of patients that developed CKD after AKI. a A healthy kidney section showing the expression of CDK4 (green) and p-H3 (red) in LTA+ proximal tubular cells (blue) (n = 4). bd A renal biopsy section from a patient that developed CKD after AKI (n = 7) showing CDK4+p-H3+ (green and red cells, arrows) and CDK4−p-H3+ (red cells, arrowheads) or CDK4+p-H3− (green cells, arrowheads) in proximal tubular LTA+ cells (blue). d′ Split images of the tubule shown in d. e Percentage of CDK4+p-H3+LTA+ cells over total proximal TECs (LTA+) in healthy kidneys (n = 4) and in renal biopsies from patients that developed CKD after AKI (n = 7). Mann–Whitney test *p < 0.05. f Percentage of CDK4+p-H3+ cells over total TECs in healthy kidneys (n = 4) and in renal biopsies from patients that developed CKD after AKI (n = 7). Mann–Whitney test *p < 0.05. g, g′ A renal biopsy section from a patient that developed CKD after AKI (n = 8) showing the presence of two or three Y chromosome-probe (green) in TECs labeled with Phalloidin (red), at different magnifications. Arrowheads indicate doubled dots for Y chromosome in a nucleus. h High magnification of another biopsy field. Arrowhead indicates triple dots for Y chromosome in a nucleus. DAPI counterstains nuclei. Data are mean ± SEM. Scale bars 20 µm

References

    1. Mehta RL, et al. International Society of Nephrology’s 0by25 initiative for acute kidney injury (zero preventable deaths by 2025): a human rights case for nephrology. Lancet. 2015;385:1–28. doi: 10.1016/S0140-6736(14)62462-4. - DOI - PubMed
    1. Bellomo R, Kellum JA, Ronco C. Acute kidney injury. Lancet. 2012;380:756–766. doi: 10.1016/S0140-6736(11)61454-2. - DOI - PubMed
    1. Lameire NH, et al. Acute kidney injury: an increasing global concern. Lancet. 2013;382:170–179. doi: 10.1016/S0140-6736(13)60647-9. - DOI - PubMed
    1. Chawla LS, Eggers PW, Star RA, Kimmel PL. Acute kidney injury and chronic kidney disease as interconnected syndromes. N. Engl. J. Med. 2014;371:58–66. doi: 10.1056/NEJMra1214243. - DOI - PMC - PubMed
    1. Sharfuddin AA, Molitoris BA. Pathophysiology of ischemic acute kidney injury. Nat. Rev. Nephrol. 2011;7:189–200. doi: 10.1038/nrneph.2011.16. - DOI - PubMed

Publication types

MeSH terms