. 2018 Apr 9;9(1):1347.
doi: 10.1038/s41467-018-03837-1.

Stimulus dependent diversity and stereotypy in the output of an olfactory functional unit

Affiliations

Stimulus dependent diversity and stereotypy in the output of an olfactory functional unit

Ezequiel M Arneodo et al. Nat Commun. .

Abstract

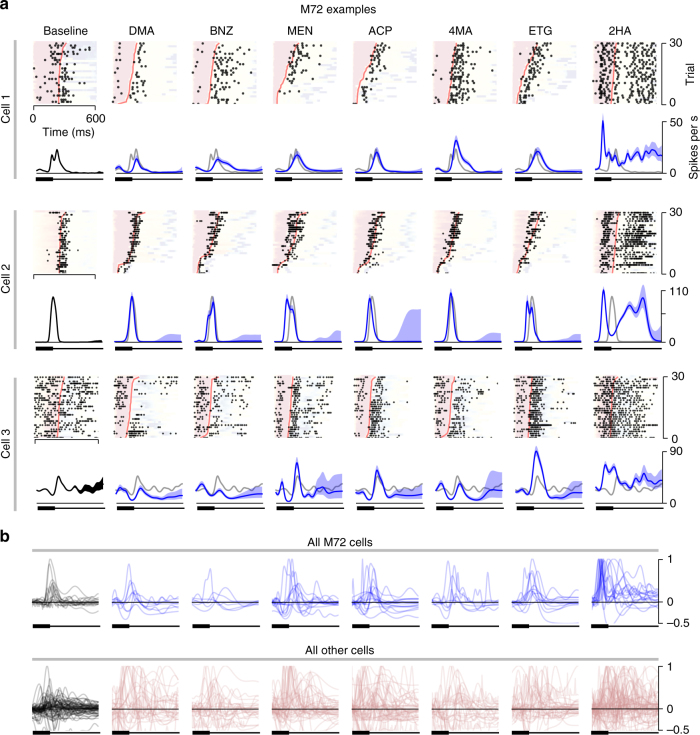
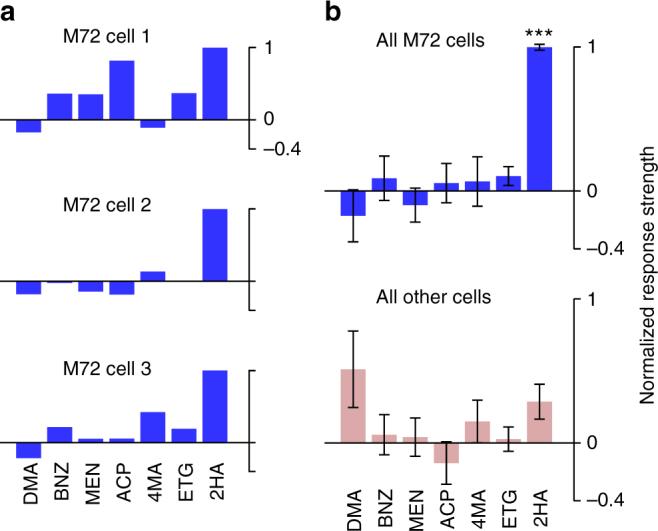
Olfactory inputs are organized in an array of functional units (glomeruli), each relaying information from sensory neurons expressing a given odorant receptor to a small population of output neurons, mitral/tufted (MT) cells. MT cells respond heterogeneously to odorants, and how the responses encode stimulus features is unknown. We recorded in awake mice responses from "sister" MT cells that receive input from a functionally characterized, genetically identified glomerulus, corresponding to a specific receptor (M72). Despite receiving similar inputs, sister MT cells exhibit temporally diverse, concentration-dependent, excitatory and inhibitory responses to most M72 ligands. In contrast, the strongest known ligand for M72 elicits temporally stereotyped, early excitatory responses in sister MT cells, consistent across a range of concentrations. Our data suggest that information about ligand affinity is encoded in the collective stereotypy or diversity of activity among sister MT cells within a glomerular functional unit in a concentration-tolerant manner.


Conflict of interest statement

The authors declare no competing interests.

Figures

Fig. 1
Fig. 1
Characterizing information in a single channel of the mouse olfactory bulb. Central insert: schematic of the olfactory bulb network. Axons from OSNs expressing the same receptor gene converge to form glomeruli, each providing the sole excitatory input to a few MT cells. Odor signals are subject to significant modification by a network of inhibitory neurons (small gray dots). a Experimental setup for characterizing OSN responses to odor. Patch clamp recordings are made from dendrites of fluorescently labeled OSNs expressing the M72 receptor. b Example traces of OSN odor responses. c Normalized dose–response curves for seven M72 ligands fitted by the Hill equation (n = 5–7 OSNs per odorant; mean ± SEM); EC50 values indicated in linear plot above. Odors used: 2-hydroxyacetophenone (2HA); ethyl tiglate (ETG); 4-methyl acetophenone (4MA); acetophenone (ACP); menthone (MEN); benzaldehyde (BNZ); and 2,4-dimethyl acetophenone (DMA). EC50 values are given in Supplementary Table 1. d Experimental setup for imaging. An awake, head-fixed mouse (OMP-GCaMP + M72-RFP) with implanted window above the OB is positioned under the microscope. e Left: image of a RFP M72 glomerulus. Right: Ca2+ image of glomerular response to an odor (2HA). M72 glomerulus here and further is marked by magenta arrow. f Experimental setup for in vivo recording of odor responses from MT cells connected to the M72 glomerulus. A head-fixed mouse is positioned in front of the odor port. The sniff signal is recorded by a pressure sensor via a cannula implanted in the nasal cavity. Brief pulses of blue light are delivered to the ChR2-expressing M72 glomerulus through an optical fiber positioned above the glomerulus. MT cell responses are recorded with a Si-probe inserted nearby. g Example of MT cell excitation following laser stimulation of the M72 glomerulus. Raster plot (upper panel) and PSTH (lower panel) around the onset of a 1 ms pulse showing the stimulus response (black line) and the baseline activity (gray line). h Distribution of response latencies to a 1 ms, 5–10 mW light pulse. Light-responsive cells with latencies longer than 20 ms (colored gray in the histogram) were excluded from the analysis
Fig. 2
Fig. 2
MT cell activity depends on sniff dynamics. a A pressure signal showing one complete sniff cycle, recorded from the mouse nasal cavity. b Scatter plot of all inhalation and sniff durations, collated across mice. Top: marginal histogram of sniff durations, across all sessions and mice (black), and from one example session (green). Right: marginal histogram of inhalation durations. c Spiking of MT cells depends on inhalation duration. Black dots: raster of spike times of an example M72-MT cell across 2100 inhalations, during baseline (no odor) condition. Responses are aligned to the onset of inhalation, and are sorted (rows) by inhalation duration. Colored background shows sniff phase: red = inhalation; blue = exhalation. The color map is positioned in a, aligned with the pressure axis. Horizontal dashed line demarcates the rarer fast inhalations (below) from the more common slower inhalations (above). d Snifflet model of MT cell responses. Top: pressure traces of three successive sniffs of short, medium, and longer inhalation duration. Inhalation periods illustrated with thickened lines. Middle: a model fit of the sniff-induced firing rate of the MT cell following a particular temporal pattern, denoted as a “snifflet”. Bottom: the observed spikes. The time courses of the snifflets are the free parameters of the model; these are fitted to each cell, for each stimulus condition, given the observed spikes. e Snifflet fit to an example M72-MT cell response to a single odor. Left: estimated snifflet for this cell/odor. Shaded region: ±1 SEM. Here and further: the time axis for a snifflet is shown as a thick bar corresponding to the normalized duration of inhalation, followed by a thin bar for the rest of the normalized sniff. Right: gray bars show the trial-averaged PSTH; thick black line shows average firing rate across trials; thin green lines show the model-fitted firing rates on each trial, given the dilations induced by different inhalations
Fig. 3
Fig. 3
MT cell responses to odor presentation. a Raster plots and snifflet estimates for three example M72-MT cells, for each odor (sorted by affinity) and baseline conditions. Rasters are shown in real time, as in Fig. 2, for the first sniff of each trial. Trials are sorted by inhalation duration, background color corresponds to sniff phase (as in Fig. 2), and inhalation offset is marked in red. The corresponding snifflet for each odor and cell (below, blue) was estimated based on the first sniff after odor onset. Baseline snifflets (first column, black) were estimated from activity in the three seconds prior to each odor onset. Baseline snifflets are overlaid in gray in each odor panel for comparison. Time axis for snifflets as in Fig. 2. b Top row: estimated snifflets from all recorded M72-MT cells. The snifflet of each cell is normalized such that a cell’s mean snifflet value across odors at inhalation onset is zero, and its maximum peak across odors is unitary. Snifflets are omitted if the cell’s responses were best described as constant over the duration of the sniff. Note the substantial variability in snifflet shapes for all odors except 2HA. Bottom row: all snifflets from the population of non-M72-MT cells
Fig. 4
Fig. 4
Response variability/stereotypy across the M72-MT population. a Map of Ca2+ activity of OSN terminals in the vicinity of M72 glomerulus (magenta arrow) for all odors. Vertical bars indicate the average level of M72 glomerulus activation for each odor. b Mean snifflet responses. Left (for all following): schematic of measurement. Right: mean normalized snifflets for each odor (as in Fig. 3b), averaged across cells. M72-MT cells in blue; generic MT cells in pink; mean baseline snifflets in gray. Shaded region denotes ±1 SEM. c Polarity of the first significant response. Right: histograms of first response polarity (yellow: excitatory; green: inhibitory; gray: no significant rate change) for M72-MT cells (left bar; bold) and generic MT cells (right bar; desaturated). Statistical tests: Pearson’s chi-squared, comparing number of excitatory/inhibitory responses for M72 and generic cells (here and further: *p < 0.05; **p < 0.01; and ***p < 0.001). d Latency to first significant response. Significance is measured as a 3σ difference between the odor-evoked snifflet and the baseline snifflet. Right: cumulative distribution functions (CDFs) of response latencies among the M72-MT (blue) and generic MT (pink) populations. Cells for which odor-evoked activity did not significantly deviate from baseline are omitted. For all odors except 2HA (last column), there is no significant difference between the latency distributions of the M72-MT population and of the generic MT population (Kolmogorov–Smirnoff two-sample tests)
Fig. 5
Fig. 5
Robustness of population diversity/stereotypy across odor concentrations. Panels as in Fig. 4. a Map of Ca2+ activity for each odor, and vertical bars indicating the average level of M72 glomerulus activation. Left three columns show increasing concentrations of MEN, a weak ligand for M72-OSNs. Right three columns show increasing concentrations of 2HA, a strong ligand for M72-OSNs. C0 denotes concentrations equivalent to stimuli presented in Fig. 4; C−2, C−1, and C1 denote concentrations of 0.01C0, 0.1C0, and 10C0, respectively. (Note: due to differences in the experimental setups, in imaging experiments the concentrations for MEN were 1.8× lower than the corresponding concentrations in electrophysiological experiments, and 2× higher for 2HA.) b Mean snifflet responses for M72-MT (blue) and other (pink) populations. c Distribution of the polarities of the first significant responses for M72 (left bar; bold) and other (right bar; desaturated) MT cells. d CDFs of the latency to first significant response
Fig. 6
Fig. 6
Individual M72-MT cells’ responses are consistent across concentrations for 2HA but not for MEN. a Odor responses of two example M72-MT cells to three concentrations of MEN (weak ligand) and 2HA (strong ligand). Shaded areas denote ±1 SEM; light gray trace shows baseline response. b Distributions of cells by category of concentration dependency for MEN (left) and 2HA (right). We define three categories: "consistent" (cyan)—the response polarity is the same for all three concentrations; "dropped" (red)—there is at least one concentration at which the response did not significantly differ from baseline; and "flipped" (orange)—the response polarity is different at different concentrations. Cells for which the response was not significantly different from baseline in all three concentrations were omitted. Pairwise comparisons: chi-squared tests
Fig. 7
Fig. 7
Odor-evoked rate responses display stereotypy also only for the strongest ligand. a Odor response profiles of three M72-MT cells, calculated as the mean change in spike count over the duration of the entire first sniff. Each cell’s responses are normalized such that 0 (horizontal line) is the spike count during baseline (air) and 1 is the maximum spike count across odors. b Odor response profiles averaged across the population; for M72-MT cells (top) and generic MT cells (bottom). M72-MT response is significantly higher than the generic MT response only for 2HA (Wilcoxon signed-rank test). Error bars = SEM
Fig. 8
Fig. 8
A proposed mechanism responsible for stereotypy/diversity among sister MT cell odor responses. a In the presence of a given odor, OSN receptors’ relative sensitivities to the odorant determine the relative response latencies of their corresponding glomeruli. As inhalation carries the odor into the nose (top), odor concentration rises gradually (middle, left). More sensitive olfactory receptors reach their activation threshold earlier (middle, right), and thus respond earlier (bottom). The labels 1 to N denote the temporal order of OSN channel activation. b The ensuing flow of activity in the bulb. The schematized olfactory bulb network is shown as in Fig. 1: glomeruli (large colored circles); MT cells (colored triangles); and inhibitory neurons (small gray circles; top = periglomerular layer, bottom = granule layer). Thin gray lines represent inhibitory connections. The glomeruli are depicted horizontally in the order of the temporal sequence of activation (1 to N), as shown in a. MT cells connected to glomerulus 1 (red) receive early feedforward (FF) excitation, which propagates through the inhibitory network. MT cells connected to glomerulus N (green) receive both FF excitation and lateral inhibition. c Responses of MT cells connected to early-activated (red) and late-activated (green) glomeruli. Driven by a common excitatory input, MT cells connected to early-activated glomeruli share an initial short-latency excitatory response. MT cells connected to later-activated glomeruli are subject to both excitatory drive and heterogeneous inhibitory influences, and thus show diverse responses

References

    1. Mombaerts P, et al. Visualizing an olfactory sensory map. Cell. 1996;87:675–686. doi: 10.1016/S0092-8674(00)81387-2. - DOI - PubMed
    1. Bozza T, Feinstein P, Zheng C, Mombaerts P. Odorant receptor expression defines functional units in the mouse olfactory system. J. Neurosci. 2002;22:3033–3043. - PMC - PubMed
    1. Shepherd, G. M. The Synaptic Organization of the Brain (Oxford Univ. Press, USA, 2004).
    1. Spors H, Grinvald A. Spatio-temporal dynamics of odor representations in the mammalian olfactory bulb. Neuron. 2002;34:301–315. doi: 10.1016/S0896-6273(02)00644-X. - DOI - PubMed
    1. Carey RM, Verhagen JV, Wesson DW, Pírez N, Wachowiak M. Temporal structure of receptor neuron input to the olfactory bulb imaged in behaving rats. J. Neurophysiol. 2009;101:1073–1088. doi: 10.1152/jn.90902.2008. - DOI - PMC - PubMed

Publication types

LinkOut - more resources