. 2018 Apr 9;8(1):5705.
doi: 10.1038/s41598-018-23943-w.

Compromised functionality of monocyte-derived dendritic cells in multiple myeloma patients may limit their use in cancer immunotherapy

Affiliations

Compromised functionality of monocyte-derived dendritic cells in multiple myeloma patients may limit their use in cancer immunotherapy

Prajakta Shinde et al. Sci Rep. .

Abstract

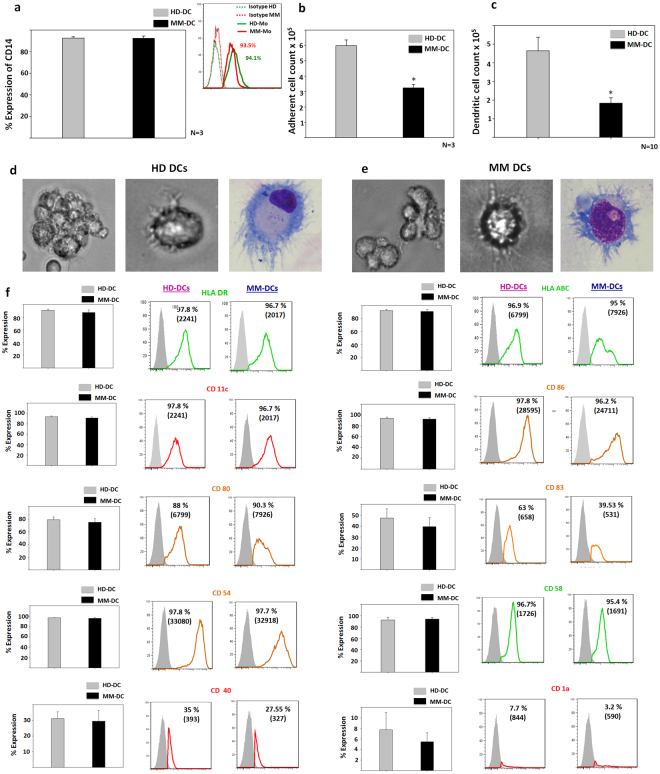
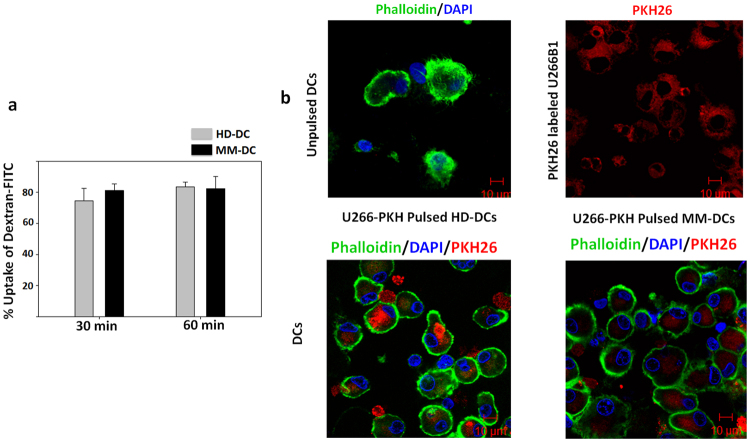
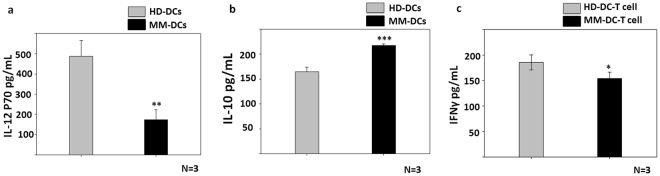
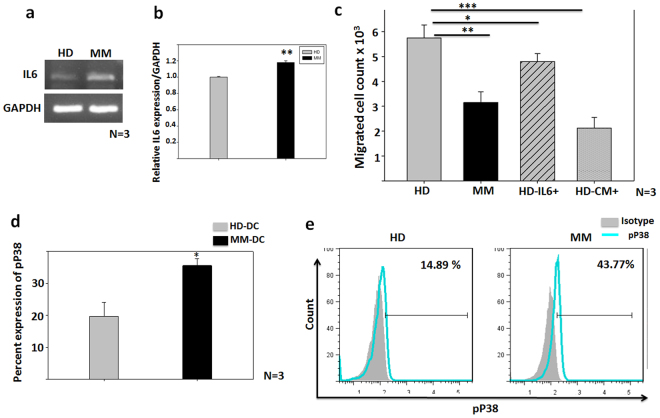
Dendritic cells (DCs) have the potential to elicit long-lasting anti-tumour immune responses. Most of the clinical trials of anti-cancer DC vaccines are based on monocyte-derived DCs (Mo-DCs). However, their outcomes have shown limited promise especially in multiple myeloma (MM) patients. Here, we investigated whether in vitro generated Mo-DCs from MM patients (MM-DCs) possess impaired functionality, thus contributing to the limited success of DC vaccines. We generated MM-DCs and compared them with DCs from healthy donors (HD-DCs). The yield of DCs in MM was 3.5 fold lower than in HD sets. However morphology, phenotype, antigen uptake and allo-T cell stimulation were comparable. Migration and secretion of IL12p70 and IFN-γ (in DC-T cell co-cultures) were significantly reduced in MM-DCs. Thus, MM-DCs were compromised in functionality. This impairment could be attributed to autocrine secretion of IL6 by MM-monocytes and activation of their P38 MAPK pathway. This indicates a need to look for alternative sources of DCs.


Conflict of interest statement

The authors declare no competing interests.

Figures

Figure 1
Figure 1
Cell yield, Morphology and phenotype of HD-DCs and MM-DCs: Quantitative data showing (a) Percent expression of CD14 on gated MNCs (N = 3) (b) No. of adherent cells obtained from 107 MNCs of HD and MM samples (N = 3, p ≤ 0.05*). The experiments were performed on three HD and three MM samples (N = 3) with triplicates (n = 3) of each sample (c) Absolute number of DCs (N = 10, p ≤ 0.05*). Phase contrast images of DCs generated from (d) HD-DCs and (e) MM-DCs at 10X (left) and 20X (Middle) of magnification. Wrights-Giemsa stained images of DCs from HD-DCs and MM-DCs respectively at 20X (right) magnification. (f) Flow cytometric assessment for the expression of surface markers confirms that DCs have mature phenotype. The experiment was performed on 10 different HD and 10 different MM samples (N = 10). The data shown are mean ± SEM.
Figure 2
Figure 2
Antigen uptake HD-DCs and MM-DCs was similar: Immature HD-DCs and MM-DCs were compared for the extracellular antigen uptake capacity. (a) Uptake of Dextran-fluorescein isothiocyanate (FITC) at 30 min and 60 min of incubation at 37 °C is shown. The experiments were performed on three HD and three MM samples (N = 3, mean ± SEM). (b) Confocal microscopy showing uptake of fluorescently labelled U266B1 cell lysate, by HD-DCs and MM-DCs. DCs were labelled with Phalloidin-FITC (green) and their nuclei with DAPI (blue). Upper left panel show control set of DCs without any addition of fluorescently labelled U266B1 lysate. Upper right panel show Multiple myeloma cell line U266B1, fluorescently labelled with PKH26 (Red). Lower left panel shows test HD-DCs and right panel show test MM-DCs that had internalised fluorescently labelled U266B1 cell lysate.
Figure 3
Figure 3
Allogeneic T cell proliferation in co-culture with HD-DCs and MM-DCs was equivalent: HD-DCs and MM-DCs were assessed for their ability to induce proliferation of allogeneic T cell from healthy volunteers (a) Dilution of CFSE in HD-DCs and MM-DCs in 5 days co-cultures, overlays of one representative experiment is depicted. (b) Percent of CFSE dilution in both cultures from three independent experiments is depicted. (c) Quantitative data showing increase in live T cell count, on day 5 over input cells is shown. (N = 3) (d) Flow cytometry dot-plot for CD8+, CD4+ and CD25+ T cells in the 5 days culture of T cells only; HD-DCs-T cells and MM-DCs-T cells of one representative experiment. (e) Cumulative percent of CD8, CD4 and CD25 in both co-cultures (N = 3). The data shown are from three HD and three MM samples (N = 3). The experiments were performed with each sample in triplicates (n = 3). Mean ± SEM values are given.
Figure 4
Figure 4
HD-DCs or MM-DCs showed different IL-10 and IL-12p70 secretion profile, IFNγ in MM-DCs and T cell co-culture was reduced: (a) Detection of IL-12p70 (N = 3) (b) IL-10 in the culture supernatants of HD-DCs and MM-DCs (N = 3) (c) Supernatants from allogeneic HD-DCs-T cells and MM-DCs-T cells co-cultures were analysed for amount of IFNγ by ELISA (N = 3). The data shown are mean ± SEM. p ≤ 0.05*, p ≤ 0.01**, p ≤ 0.001***. The experiments were performed on three HD and three different MM samples (N = 3) with triplicates (n = 3) of each sample.
Figure 5
Figure 5
MM-DCs show impaired migration as compared to HD-DCs: (a) In vitro migration of DCs to CCL19. The experiments were performed on three HD and three MM samples (N = 3) with triplicates (n = 3) of each sample. Data from one representative sample is shown (n = 3). Individual values for each sample are given in Supplementary Table S2. (b) Relative CCR7 mRNA expression normalized to GAPDH (N = 3). (c) Immunofluorescence (IF) for detection of CCR7 expression on HD-DCs and MM-DCs. (d) Fluorescence intensity plots shows significantly lower fluorescence intensity of CCR7 on MM-DCs as compared to HD-DCs (N = 3). (e) FACS overlays for CCR7 expression of a representative sample of HD-DCs and MM-DCs respectively. (f) CFSE-labelled HD-DCs from one sample and MM-DCs from other sample was injected into the groins of NOD-SCID mice (six mice for HD-DCs and six different mice for MM-DCs). In vivo migration of DCs towards draining lymph nodes was measured by flow cytometry. Percentages of CFSE population are shown. Typical scatter plots and DCs migration to regional lymph nodes in NOD-SCID mice (left-HD-DCs, right-MM-DCs). The data shown are mean ± SEM, p ≤ 0.05*, p ≤ 0.01**, p ≤ 0.001***.
Figure 6
Figure 6
MM monocytes have high autocrine IL6 secretion and activated pP38 pathway: (a) mRNA expression of IL-6 and GAPDH on HD and MM samples on day3 of DC culture (N = 3) (b) Relative IL6 mRNA expression normalized to GAPDH. (c) In vitro migration of DCs toward CCL19 is shown of HD-DCs and MM-DCs as controls, test groups are HD-DCs differentiated in presence of external IL-6 or MM cell line CM (N = 3). (d) Percent expression of phosphorylated P38 (at pT180/pY182) at day3 of MM and HD monocytes differentiation toward DCs was significantly high (N = 3). (e) Representative histogram profile of pP38 on HD (left) and MM (right) day 3 cultures. The experiments were performed on three HD and three MM samples (N = 3) with triplicates (n = 3) of each sample. The data shown are mean ± SEM. p ≤ 0.05*, p ≤ 0.01**, p ≤ 0.001***.

References

    1. Lee SC, et al. Natural killer (NK): dendritic cell (DC) cross talk induced by therapeutic monoclonal antibody triggers tumor antigen-specific T cell immunity. Immunologic research. 2011;50:248–254. doi: 10.1007/s12026-011-8231-0. - DOI - PMC - PubMed
    1. Ueno H, Schmitt N, Palucka AK, Banchereau J. Dendritic cells and humoral immunity in humans. Immunology & Cell Biology. 2010;88:376–380. doi: 10.1038/icb.2010.28. - DOI - PMC - PubMed
    1. Craxton A, Magaletti D, Ryan EJ, Clark EA. Macrophage-and dendritic cell—dependent regulation of human B-cell proliferation requires the TNF family ligand BAFF. Blood. 2003;101:4464–4471. doi: 10.1182/blood-2002-10-3123. - DOI - PubMed
    1. Palucka K, Banchereau J. Dendritic-cell-based therapeutic cancer vaccines. Immunity. 2013;39(1):38–48. doi: 10.1016/j.immuni.2013.07.004. - DOI - PMC - PubMed
    1. Palucka AK, Ueno H, Fay JW, Banchereau J. Taming cancer by inducing immunity via dendritic cells. Immunological reviews. 2007;220(1):129–150. doi: 10.1111/j.1600-065X.2007.00575.x. - DOI - PubMed

Publication types