. 2018 May;24(5):647-657.
doi: 10.1038/s41591-018-0004-z. Epub 2018 Apr 9.

Gain of toxic apolipoprotein E4 effects in human iPSC-derived neurons is ameliorated by a small-molecule structure corrector

Affiliations

Gain of toxic apolipoprotein E4 effects in human iPSC-derived neurons is ameliorated by a small-molecule structure corrector

Chengzhong Wang et al. Nat Med. 2018 May.

Abstract

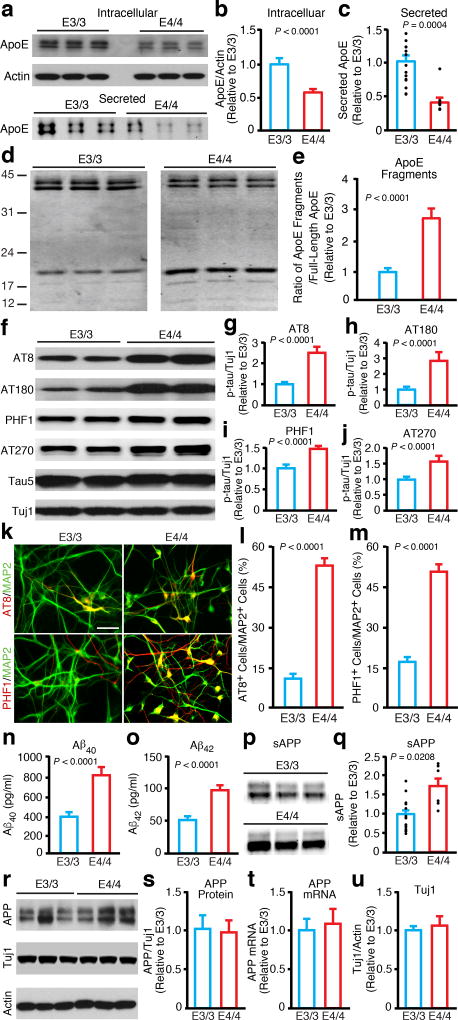
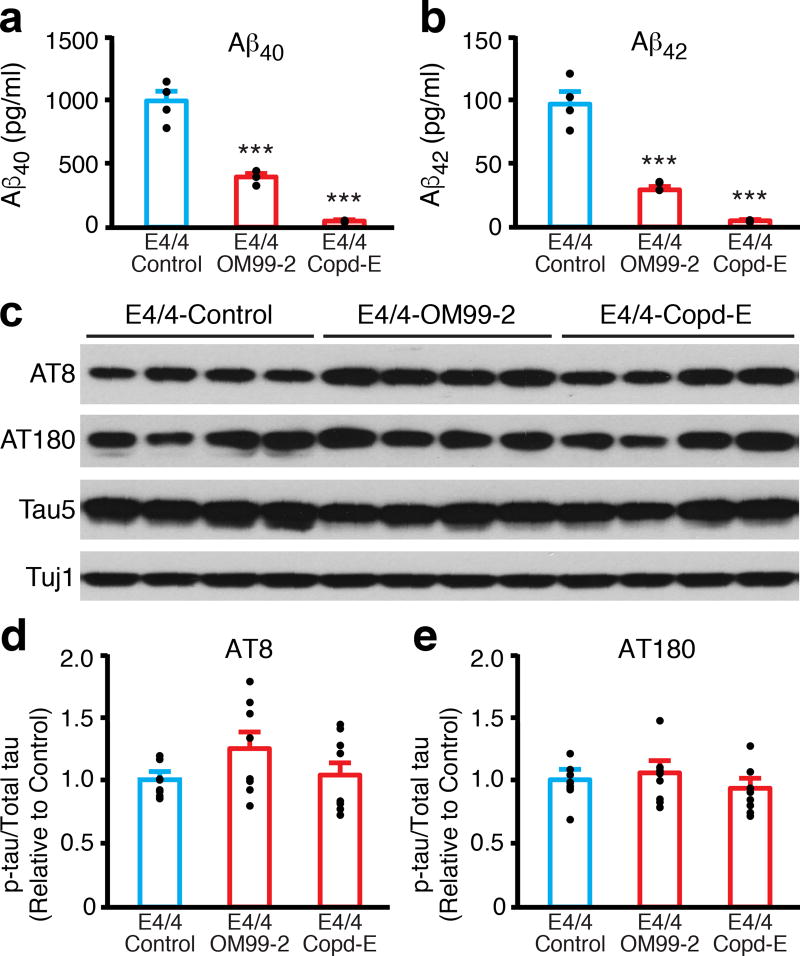
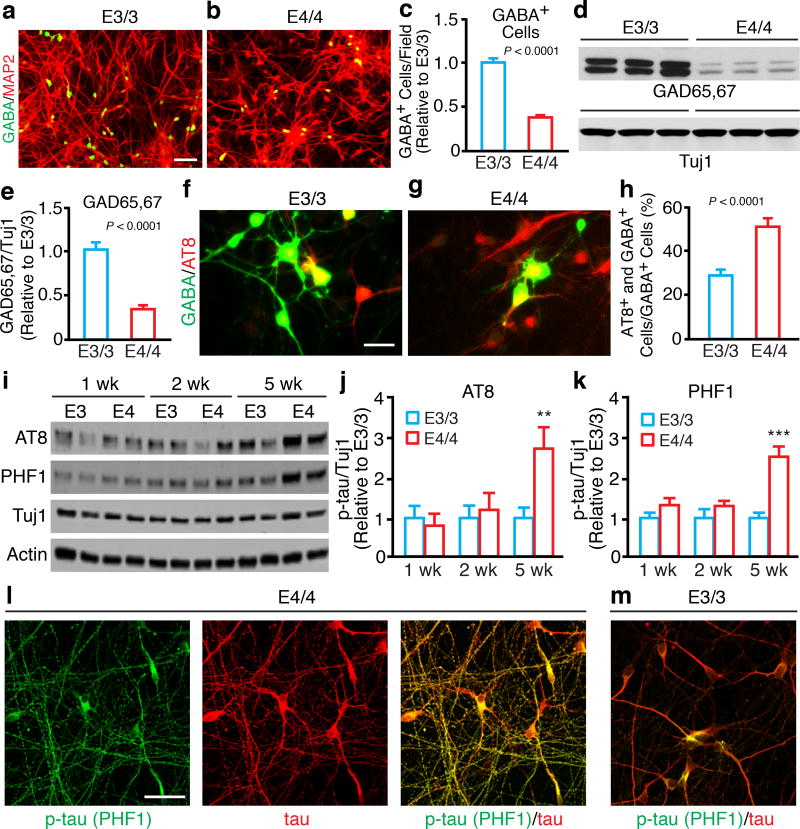
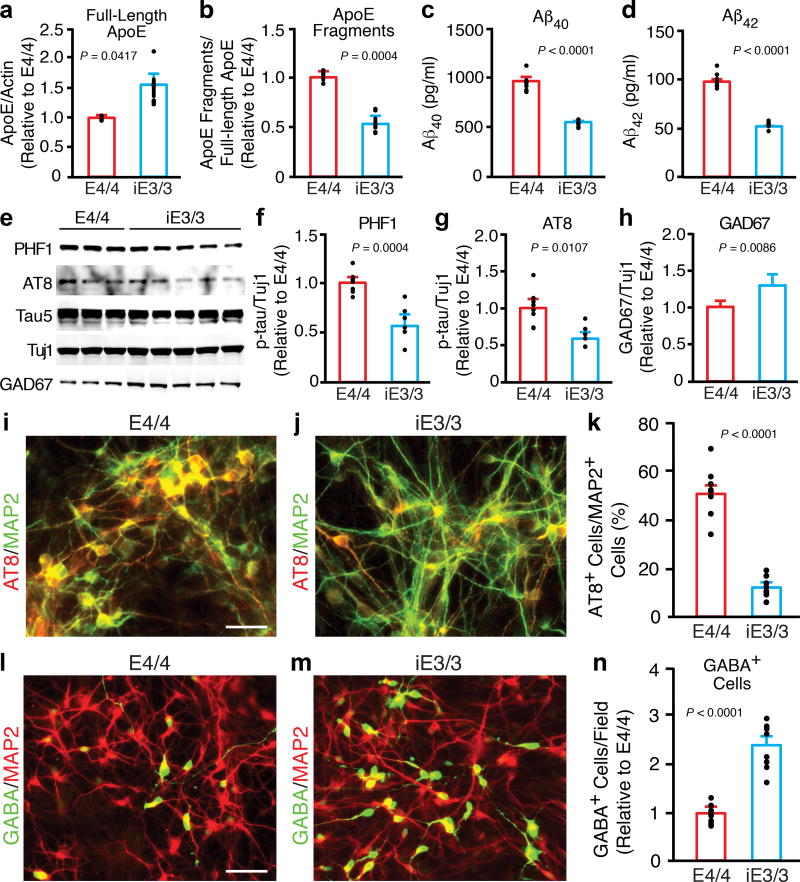
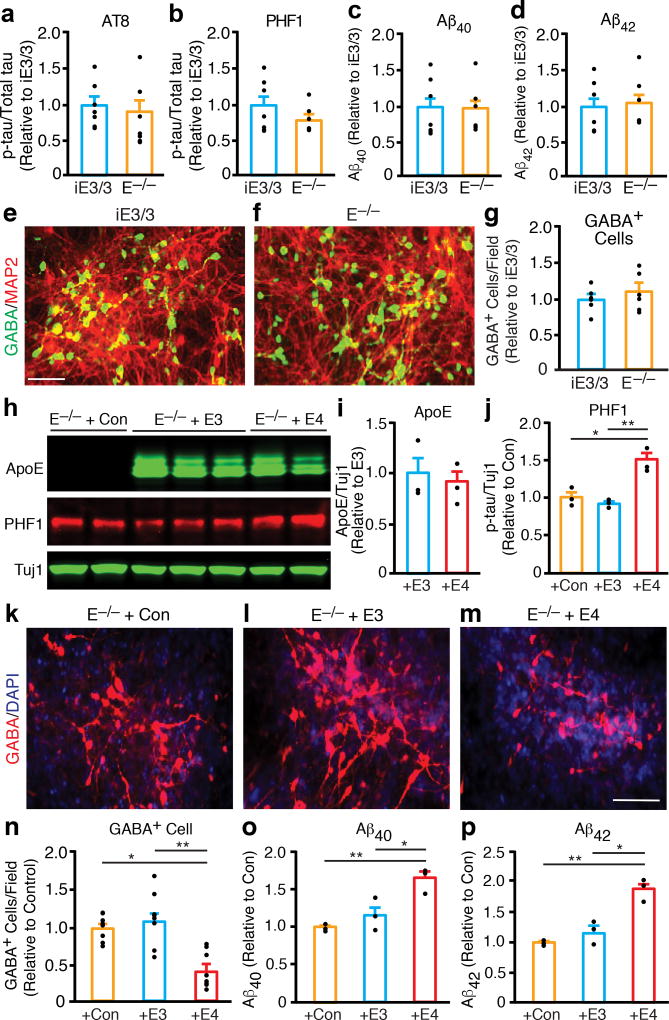
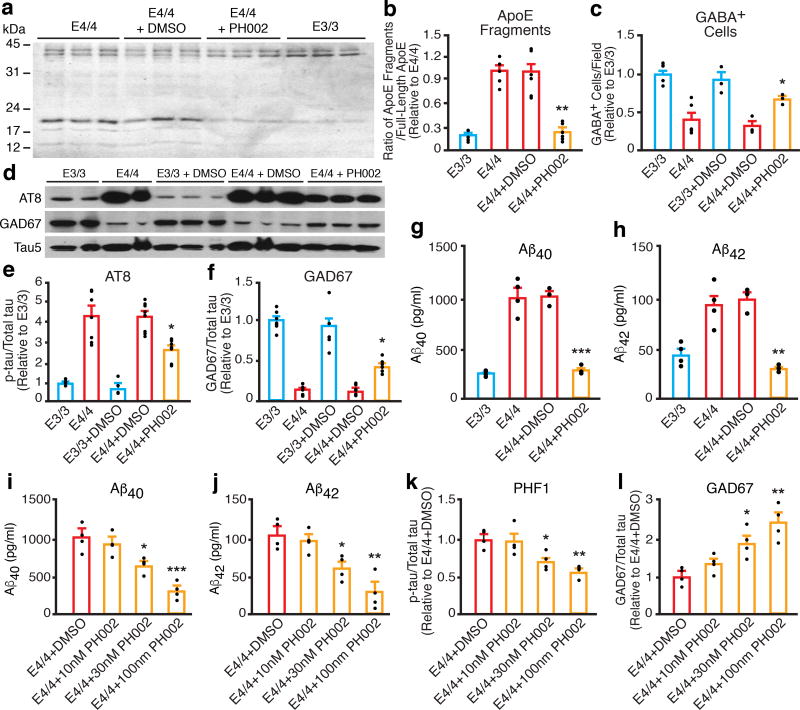
Efforts to develop drugs for Alzheimer's disease (AD) have shown promise in animal studies, only to fail in human trials, suggesting a pressing need to study AD in human model systems. Using human neurons derived from induced pluripotent stem cells that expressed apolipoprotein E4 (ApoE4), a variant of the APOE gene product and the major genetic risk factor for AD, we demonstrated that ApoE4-expressing neurons had higher levels of tau phosphorylation, unrelated to their increased production of amyloid-β (Aβ) peptides, and that they displayed GABAergic neuron degeneration. ApoE4 increased Aβ production in human, but not in mouse, neurons. Converting ApoE4 to ApoE3 by gene editing rescued these phenotypes, indicating the specific effects of ApoE4. Neurons that lacked APOE behaved similarly to those expressing ApoE3, and the introduction of ApoE4 expression recapitulated the pathological phenotypes, suggesting a gain of toxic effects from ApoE4. Treatment of ApoE4-expressing neurons with a small-molecule structure corrector ameliorated the detrimental effects, thus showing that correcting the pathogenic conformation of ApoE4 is a viable therapeutic approach for ApoE4-related AD.


Figures

Figure 1
Figure 1. Human apoE4/4 neurons generate more apoE fragments, have higher p-tau levels, and produce more Aβ than human apoE3/3 neurons
(a) Western blot analysis of full-length apoE in lysates (intracellular) or medium (secreted) of neurons derived from apoE3/3-hiPSCs and apoE4/4-hiPSCs. (b) Quantification of full-length apoE in lysates of neurons derived from apoE3/3-hiPSCs and apoE4/4-hiPSCs. Values are normalized to E3/3. n = 23 biologically independent samples from E3/3 (n=9 from apoE3/3-A; n=8 from apoE3/3-B; n=6 from apoE3/3-C), n = 20 biologically independent samples from E4/4 (n=6 from apoE4/4-A; n=6 from apoE4/4-B; n=8 from apoE4/4-C). (c) Quantification of full-length apoE in culture medium of neurons derived from apoE3/3-hiPSCs and apoE4/4-hiPSCs. Values are normalized to E3/3. n = 15 biologically independent samples from E3/3 (n=6 from apoE3/3-A; n=6 from apoE3/3-B; n=3 from apoE3/3-C), n = 9 biologically independent samples from E4/4 (n=3 from apoE4/4-A; n=3 from apoE4/4-B; n=3 from apoE4/4-C). (d) Western blot analysis of full-length apoE and apoE fragments in lysates of neurons derived from apoE3/3-hiPSCs and apoE4/4-hiPSCs. (e) Quantification of apoE fragments in lysates of neurons derived from apoE3/3-hiPSCs and apoE4/4-hiPSCs. Values are normalized to E3/3. n = 13 biologically independent samples from E3/3 (n=3 from apoE3/3-A; n=5 from apoE3/3-B; n=5 from apoE3/3-C), n = 14 biologically independent samples from E4/4 (n=3 from apoE4/4-A; n=5 from apoE4/4-B; n=6 from apoE4/4-C). (f) Western blot analysis of p-tau with AT8, AT180, PHF1, and AT270 monoclonal antibodies in lysates of neurons derived from apoE3/3-hiPSCs and apoE4/4-hiPSCs. (g) Quantification of p-tau (AT8) in neuronal lysates. Values are normalized to E3/3. n = 31 biologically independent samples from E3/3 and n = 25 biologically independent samples from E4/4. (h) Quantification of p-tau (AT180) in neuronal lysates. Values are normalized to E3/3. n = 22 biologically independent samples from E3/3 (n=7 from apoE3/3-A; n=7 from apoE3/3-B; n=8 from apoE3/3-C), n = 18 biologically independent samples from E4/4 (n=6 from apoE4/4-A; n=4 from apoE4/4-B; n=8 from apoE4/4-C). (i) Quantification of p-tau (PHF1) in neuronal lysates. Values are normalized to E3/3. n = 17 biologically independent samples from E3/3 (n=4 from apoE3/3-A; n=6 from apoE3/3-B; n=7 from apoE3/3-C), n = 25 biologically independent samples from E4/4 (n=8 from apoE4/4-A; n=8 from apoE4/4-B; n=9 from apoE4/4-C). (j) Quantification of p-tau (AT270) in neuronal lysates. Values are normalized to E3/3. n = 23 biologically independent samples from E3/3 (n=10 from apoE3/3-A; n=10 from apoE3/3-B; n=3 from apoE3/3-C), n = 17 biologically independent samples from E4/4 (n=10 from apoE4/4-A; n=4 from apoE4/4-B; n=3 from apoE4/4-C). (k) Immunostaining for MAP2 and p-tau (AT8 and PHF1) in neuronal cultures derived from apoE3/3-hiPSCs and apoE4/4-hiPSCs. Scale bar, 50 µm. (l, m) Quantification of the percentage of MAP2-positive neurons that are also positive for p-tau (AT8 and PHF1) in neuronal cultures derived from apoE3/3-hiPSCs and apoE4/4-hiPSCs. n = 12 (E3/3: n=12 fields with total of 594 MAP2+ neurons counted for AT8; n=12 fields with total of 945 MAP2+ neurons counted for PHF1), n = 12 (E4/4: n=12 fields with total of 526 MAP2+ neurons counted for AT8; n=12 fields with total of 1030 MAP2+ neurons counted for PHF1). (n) Aβ40 levels in culture medium of neurons derived from apoE3/3-hiPSCs and apoE4/4-hiPSCs. n = 23 biologically independent samples from E3/3 (n=4 from apoE3/3-A; n=7 from apoE3/3-B; n=12 from apoE3/3-C), n = 21 biologically independent samples from E4/4 (n=5 from apoE4/4-A; n=4 from apoE4/4-B; n=12 from apoE4/4-C). (o) Aβ42 levels in culture medium of neurons derived from apoE3/3-hiPSCs and apoE4/4-hiPSCs. n = 23 biologically independent samples from E3/3 (n=4 from apoE3/3-A; n=7 from apoE3/3-B; n=12 from apoE3/3-C), n = 21 biologically independent samples from E4/4 (n=5 from apoE4/4-A; n=4 from apoE4/4-B; n=12 from apoE4/4-C). (p) Western blot analysis of sAPP in culture medium of neurons derived from apoE3/3-hiPSCs and apoE4/4-hiPSCs. (q) Quantification of sAPP in culture medium of neurons derived from apoE3/3-hiPSCs and apoE4/4-hiPSCs. Values are normalized to E3/3. n = 15 biologically independent samples from E3/3 (n=6 from apoE3/3-A; n=6 from apoE3/3-B; n=3 from apoE3/3-C), n = 6 biologically independent samples from E4/4 (n=2 from apoE4/4-A; n=2 from apoE4/4-B; n=2 from apoE4/4-C). (r) Western blot analysis of APP with 22C11 monoclonal antibody in lysates of neurons derived from apoE3/3-hiPSCs and apoE4/4-hiPSCs. (s) Quantification of APP, as determined by 22C11 monoclonal antibody, in lysates of neurons derived from apoE3/3-hiPSCs and apoE4/4-hiPSCs. Values are normalized to E3/3. n = 11 biologically independent samples from E3/3 (n=4 from apoE3/3-A; n=4 from apoE3/3-B; n=3 from apoE3/3-C), n = 19 biologically independent samples from E4/4 (n=3 from apoE4/4-A; n=8 from apoE4/4-B; n=8 from apoE4/4-C). (t) Quantification of APP mRNA levels by qRT-PCR in neurons derived from apoE3/3-hiPSCs and apoE4/4-hiPSCs. Values are normalized to E3/3. n = 12 biologically independent samples from E3/3 (n=4 from apoE3/3-A; n=4 from apoE3/3-B; n=4 from apoE3/3-C), n = 12 biologically independent samples from E4/4 (n=4 from apoE4/4-A; n=4 from apoE4/4-B; n=4 from apoE4/4-C). (u) Tuj1/actin ratios in lysates of neurons derived from apoE3/3-hiPSCs and apoE4/4-hiPSCs. Values are normalized to E3/3. n = 11 biologically independent samples from E3/3 (n=4 from apoE3/3-A; n=4 from apoE3/3-B; n=3 from apoE3/3-C), n = 19 biologically independent samples from E4/4 (n=3 from apoE4/4-A; n=8 from apoE4/4-B; n=8 from apoE4/4-C). All values are expressed as mean ± SEM. Differences between groups were determined with the unpaired two-sided t test.
Figure 2
Figure 2. Increased p-tau levels in apoE4/4 neurons are independent of higher Aβ production
(a) Aβ40 levels in culture medium of apoE4/4 neurons treated with vehicle (control), a β-secretase inhibitor (OM99-2, 750 nM), or a γ-secretase inhibitor (compound E, Copd-E, 200 nM) for 1 week. n = 4 (control), n = 3 (OM99-2), and n = 3 (Copd-E) biologically independent samples. (b) Aβ42 levels in culture medium of apoE4/4 neurons treated with vehicle (control), a β-secretase inhibitor (OM99-2), or a γ-secretase inhibitor (Copd-E) for 1 week. n = 4 (control), n = 3 (OM99-2), and n = 3 (Copd-E) biologically independent samples. (c) Western blot analysis of p-tau with AT8 and AT180 monoclonal antibodies in lysates of apoE4/4 neurons treated with vehicle (control), a β-secretase inhibitor (OM99-2), or a γ-secretase inhibitor (Copd-E) for 1 week. (d) Quantification of p-tau (AT8) in lysates of apoE4/4 neurons treated with vehicle (control), a β-secretase inhibitor (OM99-2), or a γ-secretase inhibitor (Copd-E) for 1 week. Values are normalized to control. n = 8 (control), n = 8 (OM99-2), and n = 8 (Copd-E) biologically independent samples. (e) Quantification of p-tau (AT180) in lysates of apoE4/4 neurons treated with vehicle (control), β-secretase inhibitor (OM99-2), or γ-secretase inhibitor (Copd-E) for 1 week. Values are normalized to control. n = 8 (control), n = 8 (OM99-2), and n = 8 (Copd-E) biologically independent samples. All values are expressed as mean ± SEM. Differences among groups were determined with one-way ANOVA followed with Tukey’s multiple comparison test. ***p < 0.001 versus E4/4-Control.
Figure 3
Figure 3. ApoE4 causes GABAergic neuron degeneration/loss in hiPSC-derived neuronal culture
(a, b) Double immunostaining for GABA and MAP2 in neuronal cultures derived from apoE3/3-hiPSCs (a) and apoE4/4-hiPSCs (b). Scale bar, 100 µm. (c) Quantification of GABA-positive cells per field in neuronal cultures derived from apoE3/3-hiPSCs and apoE4/4-hiPSCs. Values are normalized to E3/3. n = 36 fields from E3/3 (n=16 from apoE3/3-A; n=12 from apoE3/3-B; n=8 from apoE3/3-C, with total of 9325 GABA+ neurons counted), n = 32 fields from E4/4 (n=12 from apoE4/4-A; n=12 from apoE4/4-B; n=8 from apoE4/4-C, with total of 3433 GABA+ neurons counted). (d) Western blot analysis of GAD65/67 in lysates of neurons derived from individual lines of apoE3/3-hiPSCs and apoE4/4-hiPSCs. (e) Quantification of the ratios of GAD65/67 to Tuj1 in lysates of neurons derived from apoE3/3-hiPSCs and apoE4/4-hiPSCs. Values are normalized to E3/3. n = 54 biologically independent samples from E3/3 (n=20 from apoE3/3-A; n=25 from apoE3/3-B; n=9 from apoE3/3-C), n =35 biologically independent samples from E4/4 (n=14 from apoE4/4-A; n=12 from apoE4/4-B; n=9 from apoE4/4-C). (f, g) Double immunostaining for GABA and AT8 (p-tau) in neuronal cultures derived from apoE3/3-hiPSCs (f) and apoE4/4-hiPSCs (g). Scale bar, 25 µm. (h) Quantification of the percentage of GABA-positive cells that are also positive for AT8 (p-tau) in neuronal cultures derived from apoE3/3-hiPSCs and apoE4/4-hiPSCs. n = 12 fields from E3/3 (n=4 from apoE3/3-A; n=4 from apoE3/3-B; n=4 from apoE3/3-C, with total of 352 GABA+ neurons counted), n = 12 fields from E4/4 (n=4 from apoE4/4-A; n=4 from apoE4/4-B; n=4 from apoE4/4-C, with total of 144 GABA+ neurons counted). (i) Western blot analysis of p-tau (AT8 and PHF1) in lysates of pure GABAergic neurons generated from apoE3/3-hiPSCs and apoE4/4-hiPSCs. (j) Quantification of p-tau (AT8) in GABAergic neuron lysates. Values are normalized to E3/3. n = 10 biologically independent samples from E3/3 (n=5 from E3/3-A; n=5 from E3/3-B), n = 10 biologically independent samples from E4/4 (n=5 from E4/4-A; n=5 from E4/4-B). (k) Quantification of p-tau (PHF1) in GABAergic neuron lysates. Values are normalized to E3/3. n = 10 biologically independent samples from E3/3 (n=5 from E3/3-A; n=5 from E3/3-B), n = 10 biologically independent samples from E4/4 (n=5 from E4/4-A; n=5 from E4/4-B). (l, m) Double immunostaining for p-tau (PHF1) and total tau in GABAergic neurons generated from apoE4/4-hiPSCs (l) and apoE3/3-hiPSCs (m). The experiments were repeated independently for over three times with similar results. Scale bar, 25µm. All values are expressed as mean ± SEM. Differences between groups were determined with the unpaired two-sided t test in c, e, and h. Differences among groups were determined by two-way ANOVA followed with Sidak’s multiple comparisons test in j and k. **p < 0.01; ***p < 0.001.
Figure 4
Figure 4. AD-related pathologies in human apoE4/4 neurons are specifically induced by apoE4
(a) Quantification of the full-length apoE in lysates of neurons derived from apoE4/4-hiPSCs and isogenic apoE3/3-hiPSCs (iE3/3). Values are normalized to E4/4. n = 3 (E4/4) and n = 6 (iE3/3) biologically independent samples. (b) Quantification of apoE fragments in lysates of neurons derived from apoE4/4-hiPSCs and the isogenic apoE3/3-hiPSCs (iE3/3). Values are normalized to E4/4. n = 3 (E4/4) and n = 6 (iE3/3) biologically independent samples. (c) Aβ40 levels in culture medium of neurons derived from apoE4/4-hiPSCs and the isogenic apoE3/3-hiPSCs (iE3/3). n = 8 (E4/4) and n = 6 (iE3/3) biologically independent samples. (d) Aβ42 levels in culture medium of neurons derived from apoE4/4-hiPSCs and isogenic apoE3/3-hiPSCs (iE3/3). n = 8 (E4/4) and n = 6 (iE3/3) biologically independent samples. (e) Western blot analysis for p-tau (PHF1 and AT8) and GAD67 in lysates of neurons derived from apoE4/4-hiPSCs and isogenic apoE3/3-hiPSCs (iE3/3). (f, g) Quantification of p-tau levels determined with monoclonal antibodies PHF1 (f) and AT8 (g) in lysates of neurons derived from apoE4/4-hiPSCs and isogenic apoE3/3-hiPSCs (iE3/3). Values are normalized to E4/4. n = 8 (E4/4) and n = 6 (iE3/3) biologically independent samples. (h) Quantification of GAD67 levels in lysates of neurons derived from apoE4/4-hiPSCs and isogenic apoE3/3-hiPSCs (iE3/3). Values are normalized to E4/4. n = 14 (E4/4) and n = 20 (iE3/3) biologically independent samples. (i, j) Double immunostaining for AT8 and MAP2 in neurons derived from apoE4/4-hiPSCs and isogenic apoE3/3-hiPSCs (iE3/3). Scale bar, 50 µm. (k) Quantification of the percentage of MAP2-positive cells that are also positive for AT8 (p-tau) in neuronal cultures derived from apoE4/4-hiPSCs and isogenic apoE3/3-hiPSCs (iE3/3). n = 8 fields from E4/4 with total of 1533 MAP2+ neurons counted, n = 8 fields from iE3/3 with total of 1691 MAP2+ neurons counted. (l, m) Double immunostaining for GABA and MAP2 in neurons derived from apoE4/4-hiPSCs and isogenic apoE3/3-hiPSCs (iE3/3). Scale bar, 50 µm. (n) Quantification of GABA-positive cells per field in neuronal cultures derived from apoE4/4-hiPSCs and the isogenic apoE3/3-hiPSCs (iE3/3). Values are normalized to E4/4 group. n = 8 fields from E4/4 with total of 149 GABA+ neurons counted), n = 8 fields from iE3/3 with total of 359 GABA+ neurons counted). All values are expressed as mean ± SEM. Differences between groups were determined with the unpaired two-sided t test.
Figure 5
Figure 5. ApoE4 confers a gain of toxic effects in hiPSC-derived neurons
(a, b) Quantification of p-tau levels determined with monoclonal antibodies AT8 (a) and PHF1 (b) in lysates of neurons derived from isogenic apoE3/3-hiPSCs (iE3/3) and apoE−/− hiPSCs (E−/−). Values are normalized to iE3/3. n = 7 (iE3/3) and n = 7 (E−/−) biologically independent samples. (c) Aβ40 levels in culture medium of neurons derived from isogenic apoE3/3-hiPSCs (iE3/3) and apoE−/− hiPSCs (E−/−). Values are normalized to iE3/3. n = 7 (iE3/3) and n = 7 (E−/−) biologically independent samples. (d) Aβ42 levels in culture medium of neurons derived from isogenic apoE3/3-hiPSCs (iE3/3) and apoE−/− hiPSCs (E−/−). Values are normalized to iE3/3. n = 7 (iE3/3) and n = 7 (E−/−) biologically independent samples. (e, f) Immunostaining for MAP2 and GABA in neuronal cultures derived from isogenic apoE3/3-hiPSCs (iE3/3) (e) and apoE−/− hiPSCs (E−/−) (f). Scale bar is 50 µm. (g) Quantification of GABA-positive cells per field in neuronal cultures derived from isogenic apoE3/3-hiPSCs (iE3/3) and apoE−/− hiPSCs (E−/−). Values are normalized to iE3/3. n = 6 fields from iE3/3 with total of 3520 GABA+ neurons counted, n = 6 fields from E−/− with total of 3897 GABA+ neurons counted. (h) Western blot analyses of apoE expression and p-tau (PHF1) levels in lysates of apoE-null neurons transfected with a control lentiviral vector (+Con), a lentiviral apoE3 construct (+E3), or a lentiviral apoE4 construct (+E4). (i) Quantification of the full-length apoE in lysates of apoE-null neurons transfected with a lentiviral apoE3 construct (+E3), or a lentiviral apoE4 construct (+E4). Values are normalized to +E3. n = 3 (+E3) and n = 3 (+E4) biologically independent samples. (j) Quantification of p-tau (PHF1) levels in lysates of apoE-null neurons transfected with a control lentiviral vector (+Con), a lentiviral apoE3 construct (+E3), or a lentiviral apoE4 construct (+E4). Values are normalized to +Con. n = 3 (+Con), n = 3 (+E3), and n = 3 (+E4) biologically independent samples. (k–m) Anti-GABA immunostaining of apoE-null neurons transfected with a control lentiviral vector (+Con), a lentiviral apoE3 construct (+E3), or a lentiviral apoE4 construct (+E4). Scale bar, 50 µm. (n) Quantification of GABA-positive cells per field in apoE-null neuronal cultures transfected with a control lentiviral vector (+Con), a lentiviral apoE3 construct (+E3), or a lentiviral apoE4 construct (+E4). Values are normalized to +Con. n = 8 fields from +Con with total of 1104 GABA+ neurons counted, n = 8 fields from +E3 with total 1234 of GABA+ neurons counted, n = 8 fields from +E4 with total of 637 GABA+ neurons counted. (o) Aβ40 levels in culture medium of apoE-null neurons transfected with a control lentiviral vector (+Con), a lentiviral apoE3 construct (+E3), or a lentiviral apoE4 construct (+E4). Values are normalized to +Con. n = 3 (+Con), n = 3 (+E3), and n = 3 (+E4) biologically independent samples. (p) Aβ42 levels in culture medium of apoE-null neurons transfected with a control lentiviral vector (+Con), a lentiviral apoE3 construct (+E3), or a lentiviral apoE4 construct (+E4). Values are normalized to +Con. n = 3 (+Con), n = 3 (+E3), and n = 3 (+E4) biologically independent samples. All values are expressed as mean ± SEM. Differences between groups were determined with the unpaired two-sided t test in a–d, g, and i. Differences among groups were determined with one-way ANOVA followed with Tukey’s multiple comparison test in j and n–p. *p < 0.05; **p < 0.01.
Figure 6
Figure 6. The gain of toxic effects of apoE4 in hiPSC-derived neurons can be ameliorated by a small-molecule structure corrector
(a) Western blot analysis of apoE fragment levels in lysates of apoE3/3 neurons, apoE4/4 neurons, and apoE4/4 neurons treated with dimethyl sulfoxide (DMSO) or the small-molecule structure corrector PH002. (b) Quantification of apoE fragment levels in lysates of apoE3/3 neurons, apoE4/4 neurons, and apoE4/4 neurons treated with DMSO or PH002. Values are normalized to E4/4. n = 5 (E3/3), n = 5 (E4/4), n = 6 (E4/4+DMSO), and n = 6 (E4/4+PH002) biologically independent samples. (c) Quantification of GABA-positive cells per field in cultures of apoE3/3 neurons, apoE4/4 neurons, and apoE4/4 neurons treated with DMSO or PH002. Values are normalized to E3/3. n = 6 fields from E3/3 with total of 3071 GABA+ neurons counted) n = 6 fields from E4/4 with total of 1223 GABA+ neurons counted), n = 3 fields from E3/3+DMSO with total of 1358 GABA+ neurons counted), n = 3fields from E4/4+DMSO with total of 511 GABA+ neurons counted, n = 3 fields from E4/4+PH002 with total of 1077 GABA+ neurons counted. (d) Western blot analyses of p-tau (AT8) and GAD67 in lysates of apoE3/3 neurons, apoE4/4 neurons, and apoE4/4 neurons treated with DMSO or PH002. (e) Quantification of p-tau (AT8) levels in lysates of apoE3/3 neurons, apoE4/4 neurons, and apoE4/4 neurons treated with DMSO or PH002. Values are normalized to E3/3. n = 6 (E3/3), n = 7 (E4/4), n = 5 (E3/3+DMSO), n = 8 (E4/4+DMSO), and n = 8 (E4/4+PH002) biologically independent samples. (f) Quantification of GAD67 levels in lysates of apoE3/3 neurons, apoE4/4 neurons, and apoE4/4 neurons treated with DMSO or PH002. Values are normalized to E3/3. n = 7 (E3/3), n = 7 (E4/4), n = 5 (E3/3+DMSO), n = 8 (E4/4+DMSO), and n = 6 (E4/4+PH002) biologically independent samples. (g) Aβ40 levels in culture medium of apoE3/3 neurons, apoE4/4 neurons, and apoE4/4 neurons treated with DMSO or PH002. n = 4 (E3/3), n = 4 (E4/4), n = 3 (E4/4+DMSO), and n = 3 (E4/4+PH002) biologically independent samples. (h) Aβ42 levels in culture medium of apoE3/3 neurons, apoE4/4 neurons, and apoE4/4 neurons treated with DMSO or PH002. n = 4 (E3/3), n = 4 (E4/4), n = 3 (E4/4+DMSO), and n = 3 (E4/4+PH002) biologically independent samples. (i–l) Dose effects of PH002 treatment on Aβ40 (i), Aβ42 (j), p-tau (PHF1) (k), and GAD67 (l) levels in culture medium or cell lysates of apoE4/4 neurons. DMSO treatment was used as a control. n = 4 biologically independent samples for each treatment group. All values are expressed as mean ± SEM. Differences among groups were determined with one-way ANOVA followed with Tukey’s multiple comparison test. *p < 0.05; **p < 0.01; ***p < 0.001 versus E4/4 or E4/4+DMSO in b, c, and e–h. *p < 0.05; **p < 0.01; ***p < 0.001 versus E4/4+DMSO in i–l.

References

    1. Huang Y, Mucke L. Alzheimer mechanisms and therapeutic strategies. Cell. 2012;148:1204–1222. - PMC - PubMed
    1. Golde TE, Schneider LS, Koo EH. Anti-Aβ therapeutics in Alzheimer's disease: the need for a paradigm shift. Neuron. 2011;69:203–213. - PMC - PubMed
    1. Corder E, et al. Gene dose of apolipoprotein E type 4 allele and the risk of Alzheimer’s disease in late onset families. Science. 1993;261:921–923. - PubMed
    1. Saunders AM, et al. Association of apolipoprotein E allele e4 with late-onset familial and sporadic Alzheimer’s disease. Neurology. 1993;43:1467–1472. - PubMed
    1. Farrer LA, et al. Effects of age, sex, and ethnicity on the association between apolipoprotein E genotype and Alzheimer disease. A meta-analysis. J. Am. Med. Assoc. 1997;278:1349–1356. - PubMed

Publication types

MeSH terms