. 2018 Apr;50(4):538-548.
doi: 10.1038/s41588-018-0092-1. Epub 2018 Apr 9.

Transcriptome-wide association study of schizophrenia and chromatin activity yields mechanistic disease insights

Affiliations

Transcriptome-wide association study of schizophrenia and chromatin activity yields mechanistic disease insights

Alexander Gusev et al. Nat Genet. 2018 Apr.

Abstract

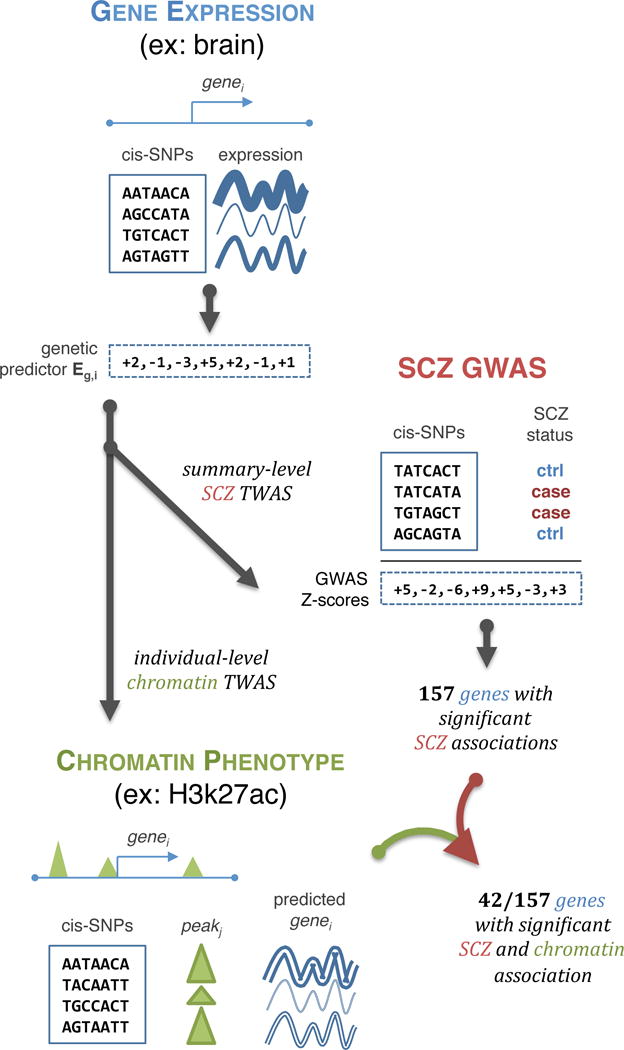
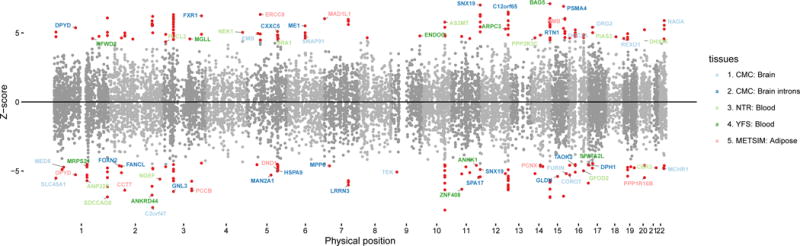
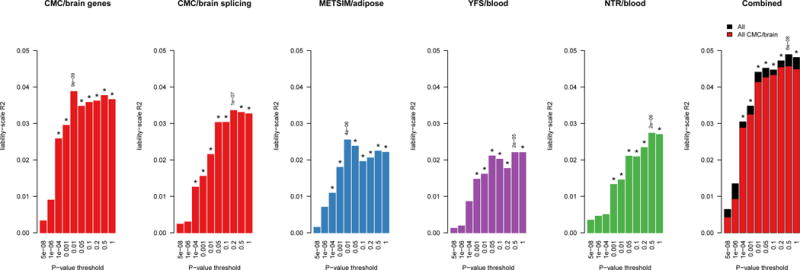
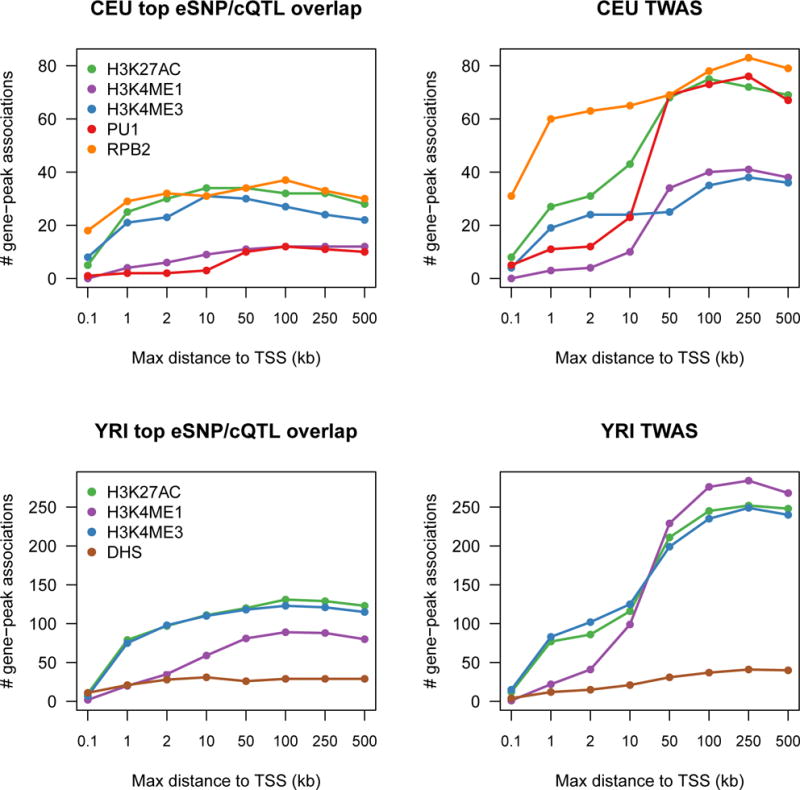
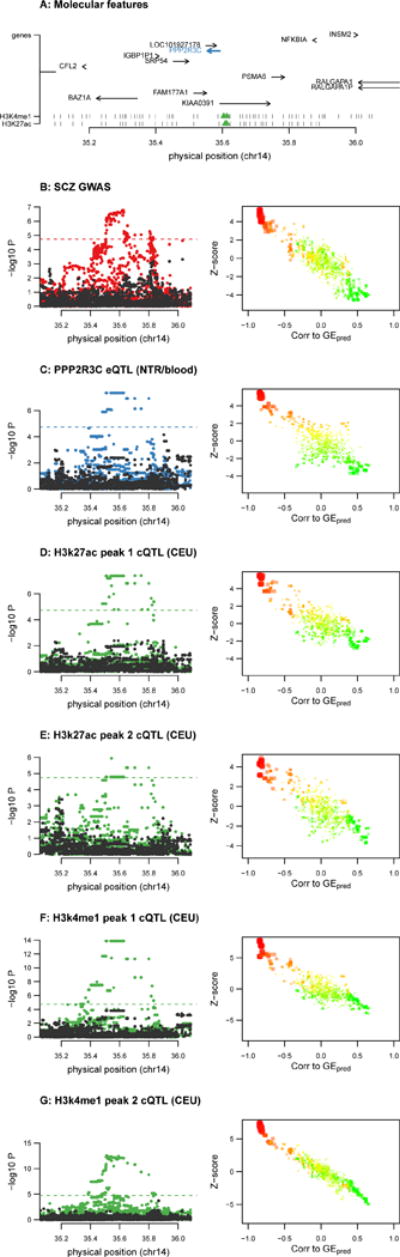
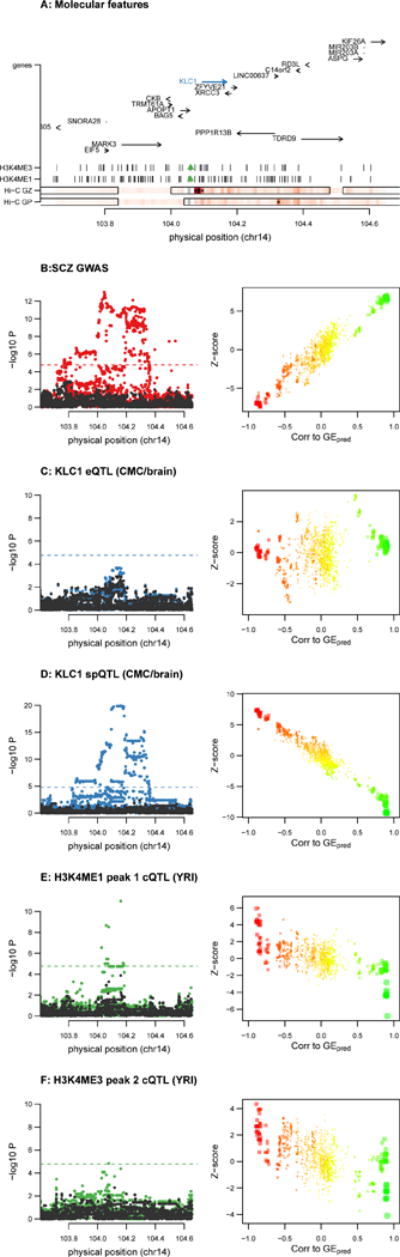
Genome-wide association studies (GWAS) have identified over 100 risk loci for schizophrenia, but the causal mechanisms remain largely unknown. We performed a transcriptome-wide association study (TWAS) integrating a schizophrenia GWAS of 79,845 individuals from the Psychiatric Genomics Consortium with expression data from brain, blood, and adipose tissues across 3,693 primarily control individuals. We identified 157 TWAS-significant genes, of which 35 did not overlap a known GWAS locus. Of these 157 genes, 42 were associated with specific chromatin features measured in independent samples, thus highlighting potential regulatory targets for follow-up. Suppression of one identified susceptibility gene, mapk3, in zebrafish showed a significant effect on neurodevelopmental phenotypes. Expression and splicing from the brain captured most of the TWAS effect across all genes. This large-scale connection of associations to target genes, tissues, and regulatory features is an essential step in moving toward a mechanistic understanding of GWAS.


Conflict of interest statement

The authors declare no competing financial interests.

Figures

Figure 1
Figure 1. Schematic of TWAS approach
Illustration of the TWAS approach: genetic predictor of gene expression (Eg) is learned in a reference panel (top); integrated with SCZ GWAS association statistics to infer SCZ-Eg association (middle); further integrated with individual-level chromatin phenotypes to infer genes with SCZ and chromatin-Eg associations (bottom). See Supplementary Fig. 1 for detailed analysis flowchart.
Figure 2
Figure 2. SCZ TWAS associations and polygenic effects
(top) Manhattan plot of all TWAS associations. Each point represents a single gene tested, with physical position plotted on x-axis and Z-score of association between gene and SCZ plotted on y-axis. Transcriptome-wide significant associations are highlighted as red points, with jointly significant independent associations (see Methods) labeled with gene names and color-coded by expression reference (red CMC; blue METSIM, purple YFS, green NTR, black ALL). (bottom) Polygenic TWAS effects across reference tissues. Out of sample SCZ prediction R2 for gene-based polygenic risk scores (GE-PRS) as a function of significance cutoff. Significant correlations (after Bonferroni correction for number of thresholds tested) are indicated with a (*) and the most significant P-value reported. Right-most panel shows prediction from all tissues jointly (black) and from CMC/brain genes + splicing events jointly (red). R2 computed after subtracting ancestry principal components and converting to liability scale with population prevalence of 1%.
Figure 3
Figure 3. Chromatin TWAS associations compared to top eSNP/cQTL associations
Number of unique genes significantly associated with a chromatin peak after Bonferroni correction for a given distance from the gene (x-axis): (left) using top eSNP in chromatin cohort; (right) using chromatin TWAS from all reference panels. Results from CEU (YRI) populations shown in top (bottom) panels.
Figure 4
Figure 4. Chromatin and SCZ TWAS association at PPP2R3C
Example association of PPP2R3C gene expression and SCZ and four nearby chromatin peaks. (A) locus schematic with all nearby genes and chromatin peaks; TWAS associated features highlighted in blue and green. (B–G left) Manhattan plots of marginal association statistics before and after conditioning on the TWAS predicted expression (colored/dark dots, respectively). Dashed line shows local significance threshold after Bonferroni correction for number of SNPs. (B–G right) Relationship between marginal GWAS/QTL association (y axis) and the correlation (x-axis) between TWAS predicted expression (GEpred estimated in the 1000 Genomes reference) and marginal GWAS/QTL association. The color of each point reflects the eQTL effect size of the expression used for GEpred and size of each point reflects absolute significance of the eQTL. (B) SCZ GWAS association; (C) PPP2R3C expression phenotype used for TWAS prediction and associated with SCZ/chromatin; (D) 1st TWAS associated H3k27ac peak in CEU; (E) 2nd TWAS associated H3k27ac peak in CEU; (F) 1st TWAS associated H3k4me1 peak in CEU; (G) 2nd TWAS associated H3k4me1 peak in CEU. See Supplementary Note, Supplementary Fig. 32, 33, 34 for additional examples and simulations.
Figure 5
Figure 5. Chromatin and SCZ TWAS association at KLC1
Example association of KLC1 splice event to SCZ with evidence of chromatin interaction in Hi-C from developing brain. (A) locus schematic with all nearby genes and chromatin peaks; TWAS associated features highlighted in blue and green. Hi-C GZ/CP rows show significance of Hi-C chromatin interaction between the 10kb block containing the associated chromatin peaks (gray, with neighboring white blocks not tested) and every other 10kb block in the region; 10kb being the highest resolution for this Hi-C data. Dark red shading indicates more significant and interactions significant at 0.01 FDR are labeled with stars. The most significant interaction in the locus overlaps the KLC1 promoter. The interactions are shown for fetal brain data from CP (cortical and subcortical plate) and GZ (germinal zone) and corresponding topological domains (TADs) are outlined with solid black lines. (B–F left) Manhattan plots of marginal association statistics before and after conditioning on the TWAS predicted expression (colored/dark dots, respectively). Dashed line shows local significance threshold after Bonferroni correction for number of SNPs. (B–F right) Relationship between marginal GWAS/QTL association (y axis) and the correlation (x-axis) between TWAS predicted expression (GEpred estimated in the 1000 Genomes reference) and marginal GWAS/QTL association. The color of each point reflects the eQTL effect size of the expression used for GEpred and size of each point reflects absolute significance of the eQTL.(B) SCZ GWAS association; (C) KLC1 total expression, both panels show independence from the TWAS predicted expression; (D) KLC1 splicing event phenotype used for TWAS prediction and associated with SCZ/chromatin; (E) TWAS associated H3k4me1 chromatin peak in YRI; (F) TWAS associated H3k4me3 chromatin peak in YRI. See Supplementary Note, Supplementary Fig. 32, 33, 34 for additional examples and simulations.
Figure 6
Figure 6. Suppression of endogenous mapk3 rescues the microcephaly and neuronal proliferation phenotypes induced by overexpression of wild-type KCTD13
Dorsal view of 4 days post fertilization (dpf) control larvae (A) and embryos injected with either morpholino (MO) against endogenous mapk3 (B), human capped wild-type (WT) KCTD13 mRNA (C) or combinatorial administration of mapk3 MO and WT human KCTD13 mRNA (D). Quantification of the headsize phenotype across the four conditions (E). Dorsal view of 3dpf embryos stained with an antibody against phospho-histone 3 (PH3), a marker of neuronal proliferation of control larvae (F) or embryos injected with either MO against mapk3 (G), human capped wild-type (WT) KCTD13 mRNA (H) or combinatorial administration (I). Graph showing quantification of the proliferating neuronal count across the four conditions (J). Student’s t-test was used to determine statistical significance.

References

    1. Schizophrenia Working Group of the Psychiatric Genomics Consortium. Biological insights from 108 schizophrenia-associated genetic loci. Nature. 2014;511:421–427. - PMC - PubMed
    1. Price AL, Spencer CC, Donnelly P. Proc R Soc B. Vol. 282. The Royal Society; 2015. Progress and promise in understanding the genetic basis of common diseases; p. 20151684. - PMC - PubMed
    1. Soldner F, Stelzer Y, Shivalila CS, Abraham BJ, Latourelle JC, Barrasa MI, Goldmann J, Myers RH, Young RA, Jaenisch R. Parkinson-associated risk variant in distal enhancer of α-synuclein modulates target gene expression. Nature. 2016;533:95–99. - PMC - PubMed
    1. Sekar A, Bialas AR, de Rivera H, Davis A, Hammond TR, Kamitaki N, Tooley K, Presumey J, Baum M, Van Doren V, et al. Schizophrenia risk from complex variation of complement component 4. Nature. 2016;530:177–183. - PMC - PubMed
    1. Claussnitzer M, Dankel SN, Kim K-H, Quon G, Meuleman W, Haugen C, Glunk V, Sousa IS, Beaudry JL, Puviindran V, et al. Fto obesity variant circuitry and adipocyte browning in humans. New England Journal of Medicine. 2015;373:895–907. - PMC - PubMed

Publication types

MeSH terms

Grants and funding