. 2018 Apr 6:11:99.
doi: 10.1186/s13068-018-1096-x. eCollection 2018.

Flow cytometry analysis of Clostridium beijerinckii NRRL B-598 populations exhibiting different phenotypes induced by changes in cultivation conditions

Affiliations

Flow cytometry analysis of Clostridium beijerinckii NRRL B-598 populations exhibiting different phenotypes induced by changes in cultivation conditions

Barbora Branska et al. Biotechnol Biofuels. .

Abstract

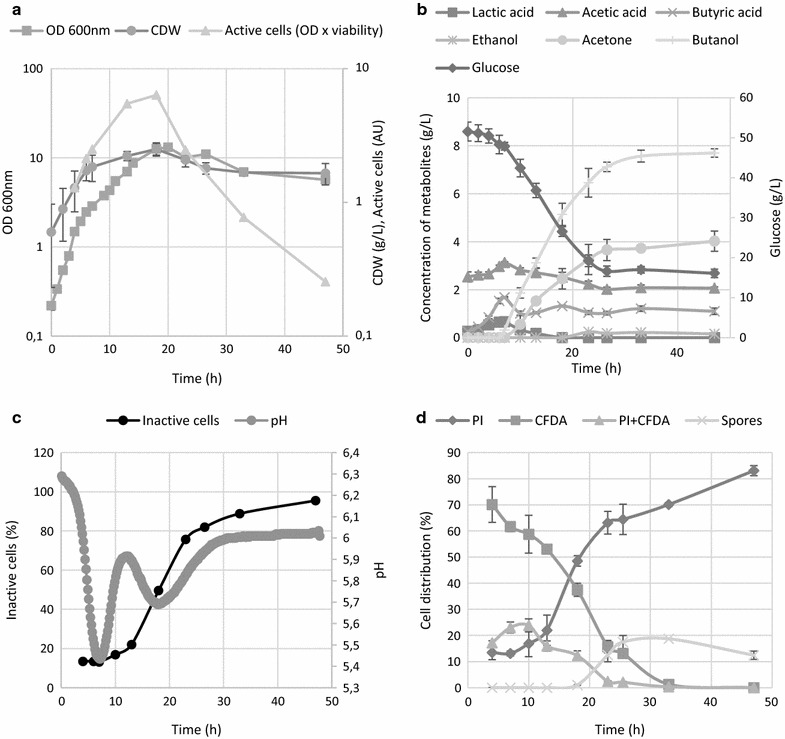
Background: Biobutanol production by clostridia via the acetone-butanol-ethanol (ABE) pathway is a promising future technology in bioenergetics , but identifying key regulatory mechanisms for this pathway is essential in order to construct industrially relevant strains with high tolerance and productivity. We have applied flow cytometric analysis to C. beijerinckii NRRL B-598 and carried out comparative screening of physiological changes in terms of viability under different cultivation conditions to determine its dependence on particular stages of the life cycle and the concentration of butanol.

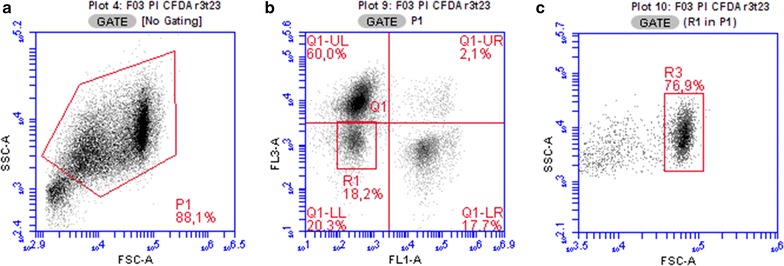
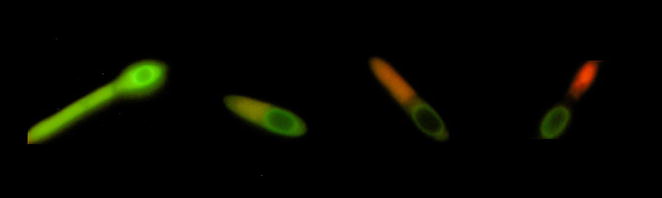
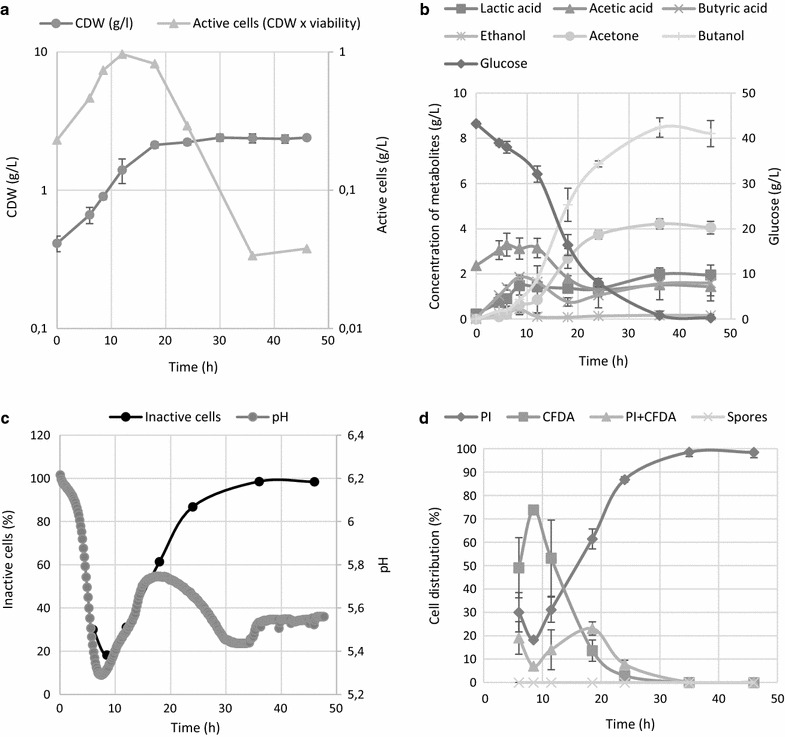
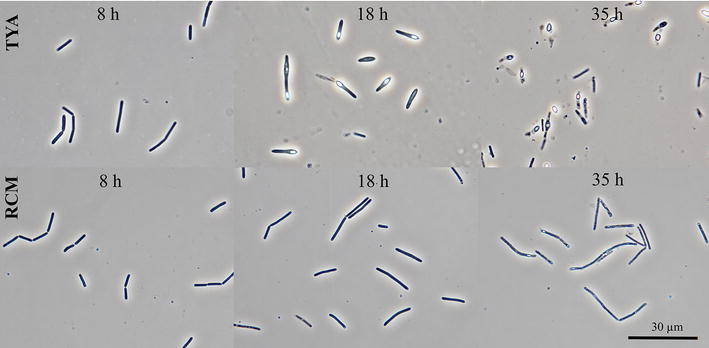
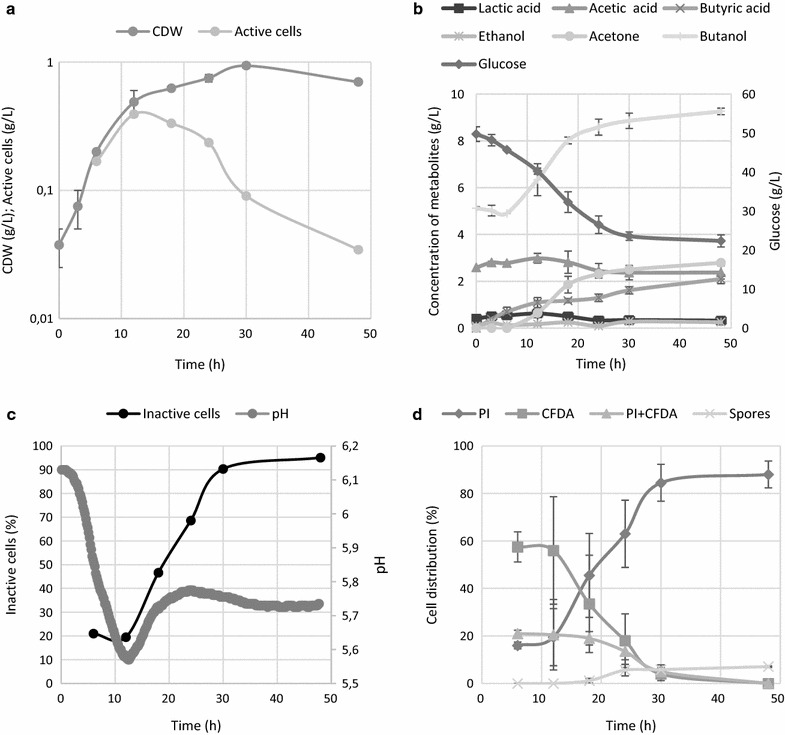
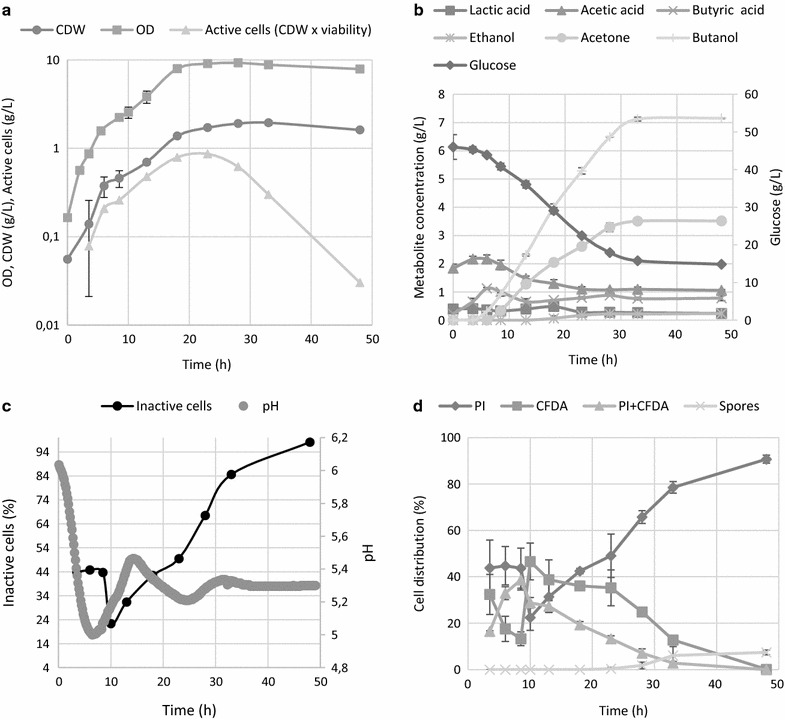
Results: Dual staining by propidium iodide (PI) and carboxyfluorescein diacetate (CFDA) provided separation of cells into four subpopulations with different abilities to take up PI and cleave CFDA, reflecting different physiological states. The development of a staining pattern during ABE fermentation showed an apparent decline in viability, starting at the pH shift and onset of solventogenesis, although an appreciable proportion of cells continued to proliferate. This was observed for sporulating as well as non-sporulating phenotypes at low solvent concentrations, suggesting that the increase in percentage of inactive cells was not a result of solvent toxicity or a transition from vegetative to sporulating stages. Additionally, the sporulating phenotype was challenged with butanol and cultivation with a lower starting pH was performed; in both these experiments similar trends were obtained-viability declined after the pH breakpoint, independent of the actual butanol concentration in the medium. Production characteristics of both sporulating and non-sporulating phenotypes were comparable, showing that in C. beijerinckii NRRL B-598, solventogenesis was not conditional on sporulation.

Conclusion: We have shown that the decline in C. beijerinckii NRRL B-598 culture viability during ABE fermentation was not only the result of accumulated toxic metabolites, but might also be associated with a special survival strategy triggered by pH change.

Keywords: ABE fermentation; Butanol; Clostridium; Cytometry; Fluorescence staining; Sporulation; Stress; Viability.


Figures

Fig. 1
Fig. 1
The time course of a cell growth and total amount of active cells (OD multiplied by reciprocal value of inactive cells from chart c), b metabolite formation, c pH and percentage of inactive cells, d distribution of different sub-populations according to their LS and fluorescence staining pattern for sporulation phenotype and ABE fermentation carried out on TYA medium without addition of external stress factors. Error bars represent standard deviations of three independent biological replicates, and calculated values are presented without error bars
Fig. 2
Fig. 2
Identification of different sub-populations based on their light scatter and fluorescence signals after incubation with PI and CFDA. a Clostridial cells were separated from the background noise and gated as the P1 gate; only the P1 region was analysed for fluorescence, b fluorescence staining patterns: upper left (UL)—solely PI stained population, upper right (UR)—doubly stained cells, lower left (LL—non stained particles, R1—particles with fluorescence properties of mature spores released from mother cells, lower right (LR)—CFDA stained cells, and c identification of spores based on light scatter parameters (only particles occurring in the R1 gate were analysed in this step). FL1 green fluorescence, FL3 red fluorescence, FSC forward scatter signal, SSC side scatter signal
Fig. 3
Fig. 3
Development of staining pattern of C. beijerinckii NRRL B-598 during sporulation for cells stained by CFDA and PI (particular states were used from different microphotographs)
Fig. 4
Fig. 4
Time course of a cell growth and total amount of active cells (CDW multiplied by reciprocal value of inactive cells from chart c), b metabolite formation, c pH and percentage of inactive cells, d distribution of different sub-populations according to their LS and fluorescence staining patterns for the non-sporulating phenotype carried out on RCM medium. Error bars represent standard deviations of three independent biological replicates, and calculated values are presented without error bars
Fig. 5
Fig. 5
Morphology of the sporulating phenotype of C. beijerinckii grown on TYA and non-sporulating phenotype grown on RCM. Microphotographs were taken at the 8th, 18th and 35th hour during the mid-solventogenic phase
Fig. 6
Fig. 6
Time course of a cell growth and total amount of active cells (CDW multiplied by reciprocal value of inactive cells from chart c), b metabolite formation c pH and percentage of inactive cells, d distribution of different sub-populations according to their LS and fluorescence staining patterns for the sporulating phenotype and ABE fermentation carried out on TYA medium with external addition of 5 g/L butanol prior to fermentation. Error bars represent standard deviations of three independent biological replicates, and calculated values are presented without error bars
Fig. 7
Fig. 7
Time course of a cell growth and total amount of active cells (CDW multiplied by reciprocal value of inactive cells from chart c), b metabolite formation, c pH and percentage of inactive cells, d distribution of different sub-populations according to their LS and fluorescence staining patterns for the sporulating phenotype and ABE fermentation carried out on TYA medium with a lower initial pH value of 6.0. Error bars represent standard deviations of three independent biological replicates, and calculated values are presented without error bars

References

    1. Jones DT, Woods DR. Acetone–butanol fermentation revisited. Microbiol Rev. 1986;50:484–524. - PMC - PubMed
    1. Yusri IM, Mamat R, Najafi G, Razman A, Awad OI, Azmi WH, Ishak WFW, Shaiful AIM. Alcohol based automotive fuels from first four alcohol family in compression and spark ignition engine: a review on engine performance and exhaust emissions. Renew Sustain Energy Rev. 2017;77:169–181. doi: 10.1016/j.rser.2017.03.080. - DOI
    1. Pfromm PH, Amanor-Boadu V, Nelson R, Vadlani P, Madl R. Bio-butanol vs. bio-ethanol: a technical and economic assessment for corn and switchgrass fermented by yeast or Clostridium acetobutylicum. Biomass Bioenergy. 2010;34:515–524. doi: 10.1016/j.biombioe.2009.12.017. - DOI
    1. Poehlein A, Solano JDM, Flitsch SK, Krabben P, Winzer K, Reid SJ, Jones DT, Green E, Minton NP, Daniel R, Durre P. Microbial solvent formation revisited by comparative genome analysis. Biotechnol Biofuels. 2017;10:15. doi: 10.1186/s13068-017-0742-z. - DOI - PMC - PubMed
    1. Jiang Y, Liu J, Jiang W, Yang Y, Yang S. Current status and prospects of industrial bio-production of n-butanol in China. Biotechnol Adv. 2015;33:1493–1501. doi: 10.1016/j.biotechadv.2014.10.007. - DOI - PubMed

LinkOut - more resources